ROTATION MATRIX SAMPLING SCHEME FOR MULTIDIMENSIONAL PROBABILITY
DISTRIBUTION TRANSFER
P. Srestasathiern∗, S. Lawawirojwong, R. Suwantong, and P. Phuthong
Geo-Informatics and Space Technology Development Agency (GISTDA), Laksi, Bangkok, Thailand (panu,siam,rata,pattrawuth)@gistda.or.th
Commission VII,WG VII/4
KEY WORDS:Histogram specification, Distribution transfer, Color transfer, Data Gaussianization
ABSTRACT:
This paper address the problem of rotation matrix sampling used for multidimensional probability distribution transfer. The distri-bution transfer has many applications in remote sensing and image processing such as color adjustment for image mosaicing, image classification, and change detection. The sampling begins with generating a set of random orthogonal matrix samples by Householder transformation technique. The advantage of using the Householder transformation for generating the set of orthogonal matrices is the uniform distribution of the orthogonal matrix samples. The obtained orthogonal matrices are then converted to proper rotation matrices. The performance of using the proposed rotation matrix sampling scheme was tested against the uniform rotation angle sampling. The applications of the proposed method were also demonstrated using two applications i.e., image to image probability distribution transfer and data Gaussianization.
1. INTRODUCTION
In remote sensing, the analysis of multi-temporal data is widely used in many applications such as urban expansion monitoring, deforestation, change detection, and agriculture monitoring. One of the difficulties when dealing with multi-temporal images is the difference in image statistics because the images were acquired at different times.
In image classification context, it is possible that the image used for training the system can have statistics different from the image we want to classify. Moreover, images from different areas or times are combined to develop efficient classification system. To obtain a reliable classification result, the probability distributions of the training data and the data we want to classify should be similar.
In (Inamdar et al., 2008), it was pointed out that their are three ap-proaches for relieving the problem of different statistics between images. The first approach is to use the atmospheric model to reduce the interference from atmosphere. The second is to use ground data to calibrate the images. The last one is to transform the image data such that its probability distribution of spectral in-formation is similar to that of the reference or target image. The first two approaches are not possible, especially when the physi-cal information of the atmosphere or ground data is not available.
In the last approach, digital numbers of pixels in a mutlispectral image are treated as multidimensional random variable. Its goal is to transfer statistical properties by reshaping the probability dis-tribution of the source image such that its shape is matched with that of a reference one. In literature, The probability distribution transfer is also known as the histogram specification or histogram matching.
Piti´e and Kokaram (Piti´e and Kokaram, 2007) presented a linear approach for probability distribution transfer. The method uses Monge-Kantorovich theory of mass transportation to transform the shape of the probability distribution. Namely, the principle
∗Corresponding author.
is based on the Monge’s transport problem which is to find mini-mal displacement for mass transportation. The solution from this linear approach can be used as initial solution for non-linear prob-ability distribution transfer methods.
Similarly, in (Rabin et al., 2014), Rabin et al. also used the opti-mal transport technique to address the problem of statistical prerty transfer. Especially, the relaxed and regularized discrete op-timal transport method was utilized. Moreover, the spatial dis-tribution is also taken into account in the convex minimization process in order to deal with the spatial distortion introduced by the mapping.
In (Reinhard et al., 2001), a method for transfer color between im-age was proposed. By rotating the color from RGB color space to Lab color space in order to decorrelate the information be-tween color channels, the statistical properties transfer bebe-tween each channel of two images can be performed independently. Par-ticularly, the color in the rotated space is translated and scaled to transfer the statistical properties. The major drawback of this ap-proach is that it is limited to only RGB color space.
In stead of rotating the original data to a specific color space as presented in (Reinhard et al., 2001), Xiao and Ma (Xiao and Ma, 2006) computed the rotation using the axes defined by the prin-cipal components of each image. The transfer function is then formulated as a series of affine matrix transformation.
In (Piti´e et al., 2007), an iterative method for transforming the probability distribution of an RGB image was proposed. The concept of this approach is to rotate data space using a random rotation matrix and perform 1D distribution transfer on each axe of the new coordinate system. The process iterates with differ-ent random rotations and stops when there is no change in the probability distribution of the modified image.
applicability of the proposed method was tested in three scenar-ios including 1.) supervised classification 2.) semi-supervised classification and 3.) change detection.
The probability distribution transfer is also used transform data such that the shape of its probability distribution is matched with a parametric probablity distribution such as uniform, or normal distribution. For example, Laparra et al. (Laparra et al., 2011) proposed a method for data Gaussianization of which the aim is to make the transformed data distributed with a unit-covariance normal distribution.
In this paper, we adopted the iterative approach presented in (Piti´e et al., 2007). Its disadvantage is that it was originally proposed for 3D probability distribution transfer using 3D rotation matrix. In order to deal with multidimensional rotation matrix, we pro-posed to use the sampling technique propro-posed by Stewart (Stew-art, 1980) to generate a set of random orthogonal matrices. This sampling scheme uses Householder transformation converting nor-mally distributed random variables to a random orthogonal ma-trix. This result in the uniform sampling of the orthogonal mama-trix. The obtained orthogonal matrices are then converted to proper ro-tation matrices. The iterative approach presented in (Piti´e et al., 2007) can then be generalized to multidimensional case.
The rest of this paper is organized as follow. The concept of prob-ability distribution transfer is briefly presented in Section 2.. In Section 3., the proposed random rotation matrix sampling scheme will be presented. The performance of the proposed method will be demonstrated in Section 4.. The conclusion will be discussed in Section 5..
2. PROBABILITY DISTRIBUTION TRANSFER
2.1 The one-dimensional case
In order to explain the distribution transfer which is also known ashistogram specification, lets use the one dimensional data as an example because its formulation is very simple. Letcsand
ct are the probability distribution of the source and target data, respectively. The goal of the distribution transfer is to transform the source data such that the transformed data has probability dis-tribution similar to the target’s one.
According to the change of variable formula, one obtains the fol-lowing constraint:
cs(us)dus=ct(ut)dut, (1)
whereus andut are respectively 1D random variables i.e., the digital number of a gray value image. Let the source data is trans-formed by a transformationT i.e.,T(us) = ut. By integrating
The transformationT can then be expressed in terms of the cu-mulative distributions of the source and target data:
Cs(us) =Ct(T(us))→T(us) =Ct−1◦Cs(us) (3) whereCs andCt are the cumulative distributions of the source and target data, respectively. Since the 1-D cumulative distribu-tion funcdistribu-tion is non-decreasing funcdistribu-tion, the mapping can then be easily implemented using look-up table.
Algorithm 1:Multi-dimensional probability distribution transfer Input : Xs: source data andXt: target data
Output:Transformed source data
1 whileNot convergedo
2 Choose anN×Nrotation matrixR;
3 At each iterationk, rotate the data using the rotation matrix Ri.e.,Xrs(k)←RXs(k−1)andXrt ←RXt;
4 Perform 1-D histogram matching on each of the axis in the
rotated space;
5 Transform the adjusted source data back to the original
space:Xs(k)←R−1Xrs(k);
6 end
2.2 N-dimensional case
To transform the multidimensional probability distribution, this paper adopted the method proposed in (Piti´e et al., 2007). The concept is similar to the Radon transformation such that the data is projected onto the principal axes of rotated space. The one-dimensional distribution transform is then performed indepen-dently on each principal axis. Therefore, the probability distri-bution is iteratively transformed to the target one using rotation matrix sequences.
The work flow of the multidimensional probability distribution transfer is illustrated in Algorithm 1. The proposed rotation ma-trix sampling scheme is presented in the next Section.
3. RANDOM SAMPLING OF ROTATION MATRIX
The proposed random rotation matrix sampling begins with the random sampling of orthogonal matrix. The obtained orthogonal matrices are then converted to proper rotation matrices. A matrix
Qis orthogonal if and only if det(Q) =±1andQQ⊤= I. The set ofN×Northogonal matrices is denoted byO(N)which is so calledorthogonal group. The rotation matrix is a special case of the orthogonal group because the determinant of the rotation matrix is 1. Therefore, the set of rotation matrices is so called
special orthogonal groupwhich is denoted bySO(N)whereN
is the dimension of the rotation matrix.
3.1 Uniformity of orthogonal matrix distribution
Unlike uniform sampling of real number, the sampling of orthog-onal, or rotation matrices needs special care in order to avoid un-intentionally bias. For example, uniform Euler angle sampling does not yield uniformly distributed rotation matrices. Particu-larly, it results in a set of rotation matrix that is heavily distributed in polar region (Kuffner, 2004).
In (Mitchell, 2008), it is pointed out that a scheme can uniformly sample orthogonal matrixQ∈O(N), if these conditions satisfy:
µ(Ω1) = µ(Ω2)
P(Q∈Ω1) = P(Q∈Ω2) , (4)
whereµis the Haar measure assigning orthogonal transformation invariant volume to subset1 Ω1,Ω2 ∈ O(N). This means that,
when the setΩ1andΩ2have the same “volume”, the sampling is
uniform, if the chances of choosing a orthogonal matrixQfrom Ω1, orΩ2are equal. This constraint is also used for the uniform
sampling of rotation matrices.
3.2 Uniform orthogonal matrix sampling
To sample orthogonal matrices, the method proposed by Stewart (Stewart, 1980) is adopted because of uniform sampling. The ob-tained orthogonal matrices are then converted to proper rotation matrices. The orthogonal matrix sampling method is based on the use of Householder transformation to decompose a square matrix into orthogonal and upper triangular matrices i.e., QR decompo-sition.
Given a vectora, there exists a Householder transformationH
such that:
whereuis a non-zero vector. It is trivial to prove that the House-holder transformationHis symmetric orthogonal. The geometri-cal meaning of the Householder transformation is the reflection of a vectoraacross the hyperplane orthogonal touwhich is so calledreflector. The reflectorucan be computed by:
u=sign(a1)kak2e+a, (7)
wherea1is the first element of the vectora.
A series of Householder transformation can then be utilized to perform orthogonal triangularization on anN ×N matrixA. That is, there exists a sequence of Householder transformation
H2,H3, . . . ,HNsatisfying:
H2H3. . .HNA=U, (8)
whereUis upper triangular. By setting
Q=HN. . .H3H2, (9)
we may write
A=QU, (10)
which is known as QR decomposition2.
To sampling orthogonal matrices, the method proposed in (Stew-art, 1980) is based on the decomposition of randomN×Nmatrix
Awhose elements are independently sampled from normal distri-bution with zero mean and a common variance. It was proved that the QR decomposition of the random matrix such that the diago-nal elements of the upper triangular matrix are positive results in the uniform distribution of orthogonal matrixQaccording to Haar measure.
3.3 Optimal rotation matrix
The obtained orthogonal matrix can be an improper rotation ma-trix i.e.,|Q| 6= 1. In this paper, the method proposed by Kanatani (Kanatani, 1994) is adopted to project the obtained orthogonal matrix onto theSO(N)manifold. Therefore, the projected or-thogonal matrix is a rotation matrix.
Given an orthogonal matrixQ, the goal is then to find the rota-tion matrix maximizing trace(R⊤Q). Let the Singular Value De-composition (SVD) of the matrixQbeQ=WDV⊤. The optimal
2In literature, this upper triangular matrix is usually denoted byR
ac-cording to the name of this factorization i.e., QR factorization.
Algorithm 2:Random rotation matrix sampling
Input : N :size of theN×Nrotation matrix;σ:standard deviation of the normal distribution
Output:A sampled rotation matrixR 1 fori←Nto2do
2 Samplingai∈Ri from normal distributionN(0i, σ2Ii);
3 Compute Householder transformationbHireducingaitorie;
4 Hi←diag IN−i,bHi;
rotation matrix can then be computed as follow:
R=W
It can be easily proved that this projection provides proper rota-tion matrix i.e.,|R|= (|W||V⊤|)2= 1because|W|=|V|=±1
By combining the orthogonal matrix sampling with projection ontoSO(N)manifold, we obtain the scheme for sampling the rotation matrix which is illustrated in Algorithm 2. The multi-dimensional rotation matrix can then be randomly sampled and used in the probability distribution transfer.
4. EXPERIMENTAL RESULTS
4.1 Image to image probability distribution transfer
In this experiment, we demonstrate the effectiveness of the mul-tidimensional probability distribution transfer. The performance of the proposed method was evaluated in terms of quality and quantity.
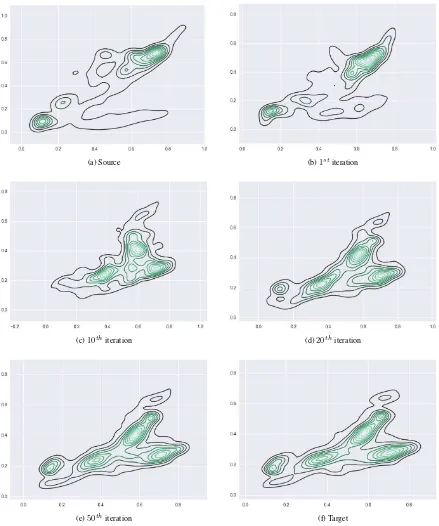
In order to show the evolution of the distribution transfer, we used the two benchmark images from stereo dataset i.e., cones and teddy images3 because of their color variations. In Figure 1, the evolution of the bivariate distribution of the red and green bands is illustrated. The Figure shows the contour plots of color distribution functions at some iterations, which were estimated by kernel density function technique, particularly Epanechnikov kernel. It can be observed that the distribution transfer can trans-form the shape of the source distribution function to match with that of target one.
The proposed method was compared with the method using uni-form angle sampling (Inamdar et al., 2008) e.g., uniuni-form Eu-ler angle distribution in 3D case. The performance indicator is the similarity between the transformed probability distribution and the target one. A popular similarity metric called Kullback-Leibler (KL) divergence is utilized which is defined as follows:
(a) Source (b)1stiteration
(c)10thiteration (d)20thiteration
(e)50thiteration (f) Target
Figure 1: The evolution of source probability distribution function. The bivariate probability distribution of the red and green bands of the source data is shown in Figure 1a. The target probability distribution function is presented in Figure 1f.
It can be noticed that the KL divergence is not symmetric i.e.,
DKL(cs, ct)=6 DKL(ct, cs). In order to make the metric sym-metric, the average of the KL divergence is used:
Davg =
DKL(cskct) +DKL(ctkcs)
2 . (13)
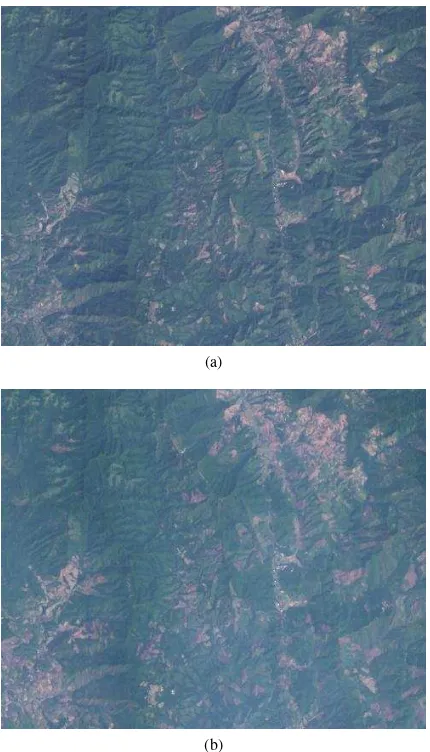
The images used in this comparison are Landsat 8 imageries, see Figure 2. The simulation was repeated 100 times and the aver-aged log Kullback-Leibler divergence at each iteration is shown in Figure 3. It can be observed that the proposed rotation sam-pling scheme yields better convergence than that of rotation angle sampling. The reason is that the rotation angle sampling can have
unintentionally bias in the rotation matrix samples.
(a)
(b)
Figure 2: Landsat 8 imageries used for comparing the perfor-mance of the proposed rotation sampling method and uniform rotation angle sampling.
Figure 3: The averaged log Kullback-Leibler divergence from 100 simulations.
The performance is also analyzed visually using Q-Q plot, where Q stands for quantile. If two sampled are drawn from the same distribution, they are expected to line up on the line of identity. In Figure 4, the Q-Q plots of the red band with and without distri-bution transfer are illustrated. It can be concluded that the source
(a) Without distribution transfer
(b) With distribution transfer
Figure 4: The Q-Q plot of the red band of images illustrated in Figure 2.
Original 1D ND
source data transformation transformation
Band 2 0.145 0.015 0.005
Band 3 0.040 0.003 0.002
Band 4 0.179 0.009 0.001
Band 5 0.214 0.003 0.0005
Band 6 0.151 0.005 0.0007
Band 7 0.095 0.008 0.0008
Band 8 1 0.046 0.210
Table 1: Kolmogorov-Smirnov statistics
and target data are not drawn from the same probability distribu-tion funcdistribu-tion. After distribudistribu-tion transfer, the distribudistribu-tion of the transformed source data is similar to that of target data.
4.2 Data Gaussianization
In some applications, the data distribution has to be transformed into a parametric distribution function, particularly, the Gaussian or normal distribution. A popular approach is to use the power transformation e.g., Box-Cox transformation (Osborne, 2010), which is a parametric transformation. In this experiment, the distribution transfer was applied to transform the shape of the distribution function to that of normal distribution.
(a)
(b)
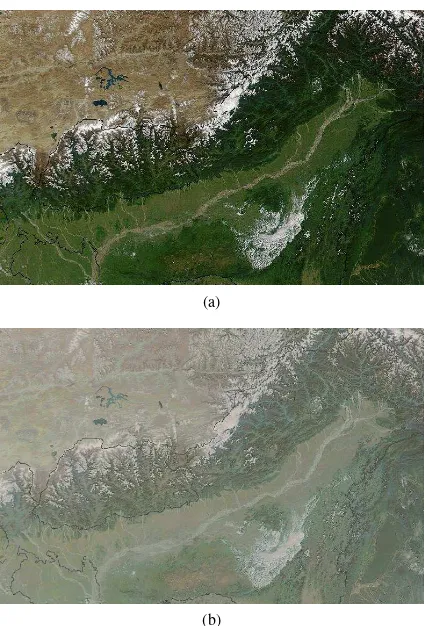
Figure 5: The MODIS imagery before and after data Gaussian-ization.
were computed. The target data was then drawn from the normal distributionN(µ,Σ). The source data was then iteratively
trans-formed to be distributed with the normal distributionN(µ,Σ).
The source data used in this experiment was the true-color MODIS4 image of the semi-arid Tibetan Plateau, illustrated in Figure 5a. The image after distribution function transformation is shown in Figure 5b.
To quantitatively test the normality of the transformed source data, the kurtosis and skew were used (Ghasemi and Zahediasl, 2012). The kurtosis was used for measure the peakedness of the probability distribution function. The asymmetry of the distribu-tion funcdistribu-tion was measured by skew. The shape of a distribudistribu-tion function is similar to that of normal distribution function, if the kurtosis is close to 3 and skew is negative. To pass the normality test with 95% confidence, the p-value must be greater than 0.05. Namely, by not reject the hypothesis of normality, no significant departure from normality is found. The statistics for normality test are tabulated in Table 2. It can be concluded that the multi-dimensional distribution transfer can transform the source data to be normally distributed.
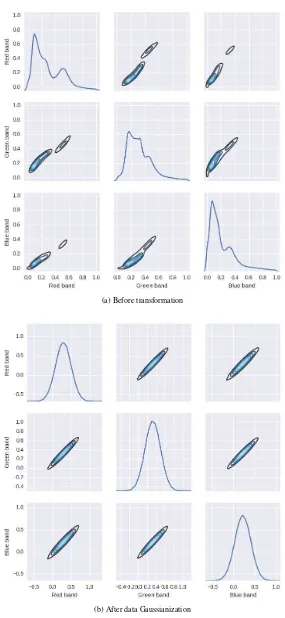
The normality of the data can also be visually inspected using pairwise bivariate distribution plot shown in Figure 6. Particu-larly, the univariate distributions on each variable (color band) are shown on diagonal axis; the bivariate distributions between two variables are shown in off-diagonal elements. It can be observed that distribution transfer can change the shape of the non-normal distribution function to that of normal one.
It is also possible to check that the desired parameters of normal distribution function are obtained using the Kullback-Leibler di-vergence for multivariate normal distributions. Let the desired
4http://modis.gsfc.nasa.gov/
normal distribution beN(µ,Σ), and the obtained normal
distri-butionNb(µb,Σ)b . Therefore, (12) can be simply modified: The desired and obtained means are as following:
µ = [0.2935 0.3244 0.2181]⊤
b
µ = [0.2938 0.3248 0.2183]⊤,
, (15)
and the desired and obtained covariance matrices:
Σ =
In this paper, a rotation matrix sampling scheme for distribution function transfer was presented. We proposed to use the House-holder transformation to uniformly sampling the orthogonal ma-trices first and then transform the orthogonal mama-trices to rotation matrices. Using he advantage of Householder transformation for sampling orthogonal matrix, the rotation matrix can be sampling more efficient than using the rotation angle sampling. This ef-ficiency was demonstrated in the experimental evaluation. The performance of the distribution transfer was tested with two ap-plications i.e., image to image distribution transfer and data Gaus-sianization. It was demonstrated that the use multidimensional distribution transfer yield better results that that of 1D distribu-tion transfer.
REFERENCES
Ghasemi, A. and Zahediasl, S., 2012. Normality tests for statis-tical analysis: a guide for non-statisticians. International Journal of Endocrinology and Metabolism 10(2), pp. 486489.
Inamdar, S., Bovolo, F., Bruzzone, L. and Chaudhuri, S., 2008. Multidimensional probability density function matching for pre-processing of multitemporal remote sensing images. Geoscience and Remote Sensing, IEEE Transactions on 46(4), pp. 1243– 1252.
Kanatani, K., 1994. Analysis of 3-d rotation fitting. IEEE Trans. Pattern Anal. Mach. Intell. 16(5), pp. 543–549.
Kuffner, J., 2004. Effective sampling and distance metrics for 3d rigid body path planning. In: Robotics and Automation, 2004. Proceedings. ICRA ’04. 2004 IEEE International Conference on, Vol. 4, pp. 3993–3998.
Laparra, V., Camps-Valls, G. and Malo, J., 2011. Iterative gaus-sianization: From ica to random rotations. Neural Networks, IEEE Transactions on 22(4), pp. 537–549.
(a) Before transformation
(b) After data Gaussianization
Kurtosis Skew p-value
Red Green Blue Red Green Blue Red Green Blue
Original 3.057 4.339 5.199 0.874 1.081 1.497 0 0 0
source data
Transformed 3.009 3.011 3.007 1.25×10⁻³ −1.894×10⁻³ −8.286×10⁻³ 0.422 0.290 0.627
source data
Table 2: Experimental results for data normality test
Osborne, J. W., 2010. Improving your data transformations: Ap-plying the box-cox transformation. Pract. Assess. Res. Eval. 15, pp. 1–9.
Piti´e, F. and Kokaram, A., 2007. The linear monge-kantorovitch linear colour mapping for example-based colour transfer. IET Conference Proceedings pp. 23–23(1).
Piti´e, F., Kokaram, A. C. and Dahyot, R., 2007. Automated colour grading using colour distribution transfer. Computer Vi-sion and Image Understanding 107(12), pp. 123 – 137.
Rabin, J., Ferradans, S. and Papadakis, N., 2014. Adaptive color transfer with relaxed optimal transport. In: Image Processing (ICIP), 2014 IEEE International Conference on, pp. 4852–4856.
Reinhard, E., Adhikhmin, M., Gooch, B. and Shirley, P., 2001. Color transfer between images. Computer Graphics and Appli-cations, IEEE 21(5), pp. 34–41.
Stewart, G. W., 1980. The efficient generation of random orthog-onal matrices with an application to condition estimators. SIAM Journal on Numerical Analysis 17(3), pp. 403–409.