VEGETATION COVER MAPPING BASED ON REMOTE SENSING AND DIGITAL
ELEVATION MODEL DATA
M. A. Korets, V. A. Ryzhkova, I. V. Danilova, A. S. Prokushkin
Sukachev Institute of Forest SB-RAS, Russia – (mik, vera, tiv80, prokushkin)@ksc.krasn.ru
KEY WORDS: Geographic Information System (GIS), Remote Sensing (RS), Digital Elevation Model (DEM), Vegetation Mapping
ABSTRACT:
An algorithm of forest cover mapping based on combined GIS-based analysis of multi-band satellite imagery, digital elevation model, and ground truth data was developed. Using the classification principles and an approach of Russian forest scientist Kolesnikov, maps of forest types and forest growing conditions (FGC) were build. The first map is based on RS-composite classification, while the second map is constructed on the basis of DEM-composite classification. The spatial combination of this two layers were also used for extrapolation and mapping of ecosystem carbon stock values (kgC/m2). The proposed approach was applied
for the test site area (~3600 km2), located in the Northern Siberia boreal forests of Evenkia near Tura settlement.
1. INTRODUCTION
The growing availability of remote sensing (RS) data of wide resolution range, as well as modern data processing software open the possibility to combine and apply traditional methods of data processing to the landcover mapping tasks of high level. As for the task of vegetation parameters mapping, it requires moreover a logical base for the natural diversity analysis and modeling. To do this, we need to choose classification principles and criteria.
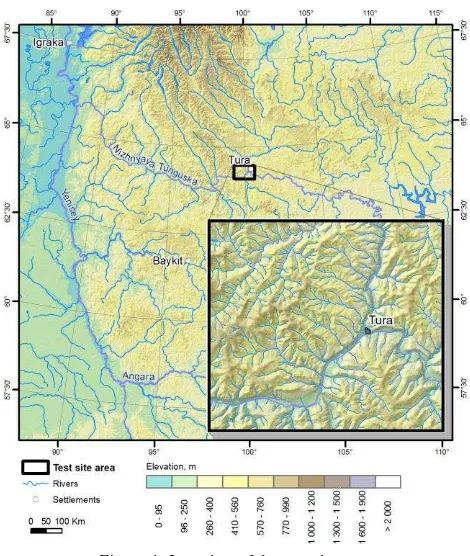
Figure 1. Location of the test site area
We are using the principles and an approach of Russian forest scientist Kolesnikov (Kolesnikov, 1956) for the classification of forest cover. According to this approach, the entire diversity of vegetation communities is classified based on growing condition similarity, and not based on continuously changing characteristics of species composition. Sites similar in
topographic location, combination of mesorelief form and elements, and, hence, in ecological regimes controlling vegetation are identified as forest growing conditions units and based of relief (digital elevation model (DEM)) analysis. Therefore, forest type and forest growing conditions type are elementary units of preliminary conjugate classification of a given area. Forest growing conditions type presents a key element of the forest type concept. It is identified based on climate, geological, geomorphological, and soil parameters of a given area. This approach has great possibilities for mapping of vegetation cover using GIS.
The above tasks were taken into account to develop the combined approach for qualitative (forest types) and quantitative (carbon stock) vegetation characteristics mapping. The test site area (~3600 km2) was located in the Northern
Siberia boreal forests of Evenkia near Tura settlement (Figure 1).
2. INPUT DATA
We used the data of «Central Siberia Forests GIS», developed in the Institute of Forest SB RAS (Korets, 2002), as main data source for our work.
The GIS data includes topographic base maps and DEM; remote sensing imagery; small-scale thematic maps archive (vegetation, soil, landscape, etc.); in-situ data samples (forest inventory and field sites).
We clipped the general 1:200000 scale topography maps of the test area, including vector layers of rivers, roads and relief contours. The last one was converted to raster DEM with 30x30m resolution.
We selected the satellite multispectral images of medium, high and ultra-high spatial resolution:
biomass and soil samples measurements were converted to the carbon stock values (kgC/m2) for ecosystem components: stem,
branch, root, organic and mineral soil layers.
Characteristics of site topography and soil-ground conditions were also recorded. In total, we used 75 sample plots of 2006-2014 fieldwork for landcover classification and 25 plots for carbon stock extrapolation (Prokushkin et al., 2006, 2011).
3. METHODS
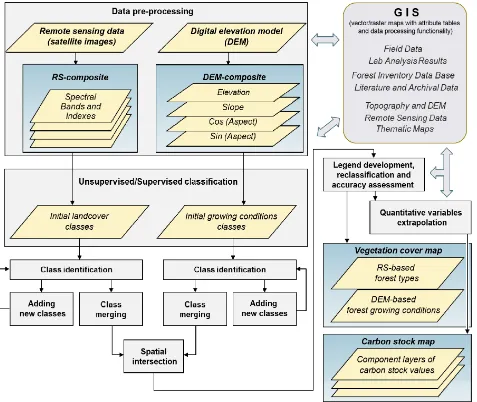
We have elaborated the data processing scheme (Figure 2), combining common and specially designed approaches, to solve the tasks of vegetation cover and carbon stock mapping on the basis of GIS. This methodology is realized with the help of well-known software products: ESRI ArcGIS and ERDAS Imagine. Most of procedures applied in this software are described by Richards J.A. in the book Remote Sensing Digital Image Analysis (2005), and software user manuals (ERDAS, 1999). Data processing approach for extended feature set calculation based on DEM-parameters is presented by the authors (Korets, 2014, Ryzhkova et al., 2011).
3.1 Data pre-processing
The input RS data (Landsat, RapidEye, GeoEye-1) have already passed through the stages of base radiometric corrections.
Additionally we applied Haze Reduction Procedure (ERDAS, 1999) based on Tasseled Cap Transformation Algorithm, for some Landsat 4-7 TM scenes with low and medium haze content. Exclusion masks for “no-data” areas were created for the images with high haze content or compact clouds. We also applied the scene orthorectification and radiometric normalization procedures since the altitude range of the test area was 100 – 800 m. We used Lambertian Reflection Model (Richards, 2005; ERDAS, 1999) with Sun's zenith and azimuth angles (from scene header file), ASTER-based GDEM (20m) and topography data of local scale to assign the reference points.
At the end of this stage, we obtained a set of normalized multiband RS images and RGB-composites. The latter were based on NIR-Red-Green or MIR-NIR-Red spectral bands for better visual representation of vegetation. The usable band numbers for RGB viewing were 5-4-3 or 7-4-2 bands for Landsat TM and RapidEye images, and 4-3-2 bands for GeoEye-1.
Then we applied the DEM-based parameters Elevation (E, m), Slope (S, °) and Aspect (A, °) to estimate the forest growing conditions affected by the relief structure (Ryzhkova et al., 2014).
Aspect and Slopes angles were calculated for each pixel on the base of ASTER GDEM. Instead of direct use of aspect angel (A), we built the Sin (A) and Cos (A) layers (Korets, 2014) in order to prevent the “brake” (359°-0°) in northern slope aspects. A multi-layered image (E, Sin (A) and Cos (A)), named DEM-composite, was applied both for computer-based classification of forest growing conditions types and for visual interpretation in RGB representation by an expert.
3.2 Reference dataset building
We applied the Atomized Reference Building Procedure (Korets, 2002) to produce a training dataset for the blocks of computer-based qualitative classification, quantitative approximation and results accuracy assessment. The locations of reference points and polygons were assigned both by expert and from GPS field data sets. In addition, we converted the reference points to polygons as rectangle point-buffers with 3x3 pixels size, depending on input image resolution. Then we calculated the statistical signatures for each reference polygon, using the pixel values of feature layers (RS-based and DEM-based) inside polygons. The signatures include features mean, standard deviation and inter-feature covariance values. Additionally, the qualitative landcover class name and quantitative values (carbon stock components) were added to the signature table. Then we passed these initial signatures through the number of filtering procedures in order to remove the statistically non-representative ones. The filtering procedures used both spatial homogeneity of reference samples and feature space homogeneity of reference classes. The last one was based on Euclidean distance calculation between the class means and reference signature means in the multi-dimensional feature space. Finally, we got the reduced optimized set of reference (or training) signatures both for vegetation classification and for carbon stock values extrapolation.
Then we applied separability analysis of class signatures to adjust the training set of landcover classes for supervised classification algorithms. We computed the tables of Transformed divergence (Richards, 2005)) for signatures sets to determine how distinct initial signatures were from one another. This utility helped us to determine the best subset of initial classes to use in further mapping procedure. The classes with low separability value were merged to build new ones. As a result, we got a reference samples with signatures: for supervised classification and for quantitative variables extrapolation.
3.3 Forest cover and forest growing conditions mapping
We applied combination of unsupervised and supervised approaches in order to increase the number of initial classes and to detect the undefined classes (not supported by training samples). We used well-known pixel-based classification algorithms: unsupervised clustering - ISODATA and supervised Maximum Likelihood Classification (Richards, 2005; ERDAS, 1999).
We started from ISODATA clustering to map approximately twice as much classes as than training samples had. Then we identified the known classes, which were overlapped with training samples. The rest unknown classes were used to define new additional training samples with the help of auxiliary data (thematic maps and expert data). In addition, new field reference points were planned to the next field season to validate the “known” and to identify the “unknown” classes.
Finally, we applied the training samples for the “known” classes together with additional samples for “unknown” classes to perform the supervised classification algorithm.
We applied the same mapping procedures both for DEM-intersected them to produce the combined map legend.
3.4 Development of the combined map legend and reclassification
We used DEM to locate topological transects that crossed the study area and analyzed these transects using the thematic landscape and soil maps contained in the GIS database. We also took into account ground-based observations, classification of potential forest growing conditions based on site topology and the associated forest types (Ryzhkova, 2014).
Reclassification of the initial landcover classes to produce new ones was done according to the expert data.
This stage resulted in the development of a conjugate classification-legend of forest vegetation and forest growing conditions.
3.5 Map accuracy assessment
To access mapping accuracy of classification approaches, we used confusion matrix, calculated as overlap-area-based zonal statistics for testing map and reference sample polygons and points. The accuracy table included reference totals, number of correct results, percent of accuracy, and Kappa coefficient (Monserud, Leemans, 1992).
3.6 Quantitative variables mapping
Quantitative variables mapping stage focused on carbon stock values extrapolation, using the produced RS-DEM-based classification results and field samples database. The possible ways were either to use landcover-based tabular reclassification approach or to apply approximation algorithms, based on parametric or non-parametric regression analysis. Since we already had the forest cover classes mapped and most of them were provided by filed data samples with carbon stock measured, the easiest way was to use tabular reclassification. In this approach, the average of samples quantitative values were assigned to corresponding combined forest cover and forest growing conditions classes. This method could provide adequate average accuracy of quantitative estimation in case of adequate quality of input data. Unfortunately, this approach could not provide the quantitative values for the classes not provided by field data samples. Therefore, in case of lack of in-situ data we had to add new samples or use the modeling or approximation methods to extrapolate the measured values.
4. RESULTS
4.1 The maps of vegetation growing conditions
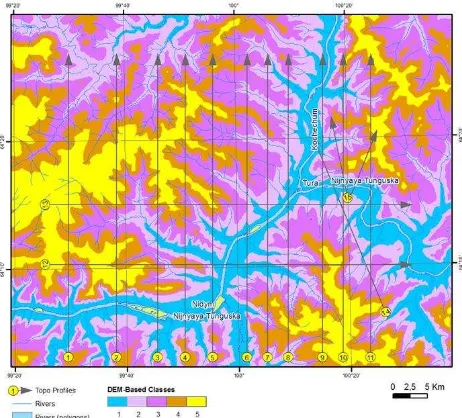
To characterize the test site orography, we built DEM-based topographic profiles that crossed the major mesorelief forms and elements of the site area
An analysis of the profiles with the help of thematic maps, specifically a landscape and geomorphological maps, allowed us to identify sites that were relatively homogeneous in relief forms and elements, in range of elevation above sea level (a.s.l.), and in dominant slope. An unsupervised DEM-composite classification by elevation and slope yielded five classes homogeneous in range of relief morphometric parameters, which elements formed three geomorphological complexes (GMC) of vegetation growing conditions, named GMC I, II, and III (Figure 3). It covered sites similar in mesorelief forms and elevation range, characterized by certain climate, soils and complex of forest types.
To perform more detailed classification, we analyzed each GMC and identified sites that were homogeneous in slope (flat surfaces (0-1°), gentle slopes (1-3°), moderate slopes (3-5°), steep slopes (5-8°), very steep slopes (8-15°), benches, and rocks (>15°)). Those sites have site-specific soil and hydrological conditions as well as corresponding forest growing conditions (FGC) types (Figure 4).
The initial classes resulted from the DEM-composite image analysis were identified by an expert as flat interfluves, slopes of different steepness, river valleys and floodplains found within each geomorphological complex of forest growing conditions. These classes constituted the next level of the map of forest growing conditions, which is required for correct identification of forest types.
Figure 3. DEM-based classes of morphometric relief parameters for the test site:
1. Elevated (112-333 m a.s.l.), hilly and ridged hilly, accumulative-denudation and denudation-erosional plains and plateaus with runoff channels, thermokarst lakes and hollows, frost mounds, bogged depressions, farewell rocks, and other structural forms.
2. Low-mountain accumulative-denudation and denudation-erosional hilly, ridged hilly plains and plateaus with step-like slopes; plains with bogged depressions and thermokarst forms; plateaus step-like and table-step-like, ridged hilly with elongated, gently sloping, flat-topped elevations, and farewell rocks, made up by terrigenous-calcareous rocks with trapps intrusions (260-411 m a.s.l.).
3. Denudation-erosional plateaus of low mountains, ridged hilly, dissected, with step-like slopes, made up by terrigenous-calcareous rocks, with trapps intrusions; low-mountain denudation-erosional, table- step-like, heavily dissected, steep sloping plateaus with nival-permafrost forms, made up by effusive and effusive-sedimentary rocks (lava) (363-470 m a.s.l.).
4. Denudation-erosional hilly, dissected, steep sloping plateaus of low mountains, with clearly step-like slopes, made up by effusive rocks (basic lava); denudation-erosional, ridged hilly plateaus of low mountains with step-like slopes, made up by terrigenous-calcareous rocks with trapps intrusions (409-571 m a.s.l.).
5. Table-step-like denudation, denudation-erosional, heavily dissected plateaus with narrow watersheds and nival-permafrost forms, made up by effusive and effusive-sedimentary rocks (550-790 m a.s.l.).
Figure 4. Two layers composite map of potential forest growing conditions for two hierarchical classification levels: GMC and
types of FGC.
DEM-based geomorphological complexes of forest growing conditions for the test site:
I. Tundra - open woodland, low-mountain, denudation- erosional, table-like and table-step-like, heavily dissected plateaus made up by effusive sedimentary rocks (lava).
II. Tundra - open woodland, low-mountain, denudation-erosional, hilly, step-like, steep sloping, dissected plateaus with residual mountains and other structural elements, made up by terrigenous-calcareous and effusive sedimentary rocks.
III. Open woodland - tundra, denudation, table-step-like, with narrow watersheds and nival-permafrost forms, made up by effusive rocks (basic lava).
4.2. Vegetation cover map
the reference sample plots (25 field sites) and by forest inventory samples (37 polygons), generated according the previously described procedure. Based on them, we built the training samples and signatures for the next more accurate supervised (MAXLIKE) classification of the same input RS-composite.
Using the complete set of data samples, we calculated the confusion matrix for the landcover classes. The Kappa statistics showed the overall accuracy of 0.75.
Based on combined analysis of field validation points, expert data and forest growing condition maps we combined and reclassified the initial landcover classes to produce more generalized forest type classes (Figure 5, Table 1).
The accuracy of the new classes increased to 0.93 overall Kappa.
Forest types and other landcover classes Area, %
1) Larch stands ledum-feathermoss 10.6 2) Larch stands dwarf shrub-lichen-feathermoss 25.9 3) Birch stands blueberry-sedge-feathermoss 9.9 4) Larch stands dwarf shrub-ledum-lichen 8.9 5) Larch open woodlands feathermoss-dwarf
shrub-lichen 19.7
6) Larch stands dwarf shrub-feathermoss 16.7
7) Birch stands sedge-feathermoss 1.7
8) Open surfaces, rocks 2.9
9) Burned area of 2009 2.0
10) Other 1.6
Table 1. Classes present on the test site
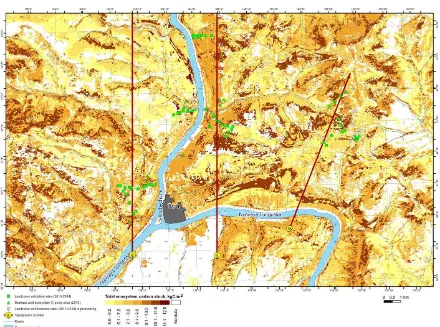
4.3 Carbon stock map
As we mentioned earlier, the spatial combination of RS-based and DEM-based thematic layers could be used for the extrapolation and mapping of the quantitative ecosystem variables. First, we converted the raster layers to the polygonal vector format and intersected them spatially in order to build a combined attribute table. Then we overlaid this vector map with field sample plots where carbon stock components were measured. Finally, we assigned the samples values to corresponding combined landcover and growing conditions classes. Thus, the resulting polygonal map had all needed quantitative attributes (carbon stock in kgC/m2) for components:
stems, branches, roots, organic and mineral soil layers.
As an example, the total ecosystem carbon stock map for the Tura test site is shown on Figure 6.
The «white spots» (or no-data gaps) on the maps of extrapolated field values could help us to plan new field samples locations for the next field seasons. Further, when the extended set of field samples is obtained, we can apply the parametric or non-parametric approximation methods to produce more consistent maps of different scales and wider areas.
5. CONCLUSIONS
The combined use of automated methods and expert interpretation of the obtained classes allowed us to carry out an automated classification and mapping of forest cover characteristics, directly invisible in space images, but very important regarding thematic mapping (forest growing conditions types, forest types, biomass, and carbon stock characteristics). The great advantage of the proposed approach is a possibility of revision and updating the obtained map
models in case of vegetation cover changing and data maintenance. Thus, the spatial layers of vegetation parameters are being used in the complex models of carbon balance and carbon pools estimation in the number of projects (see acknowledgments below).
This methodology is now on the stage of implementation for different test areas of Siberian forest. The improvement of spatial extrapolation procedure is now underway.
ACKNOWLEDGMENTS
We thank all the members of the Sukachev Institute of Forest SB RAS who participated in the field and laboratory work, conducted chemical analysis of samples, and provided data to the GIS database for this study. This study was supported by Russian Science Foundation project №14-24-00113, the Ministry of Education and Science of RF Grant №14.B25.31.0031) and Russian Fundamental Research Foundation Grants №15-04-04013 and № 15-44-04008-r-siberia-a.
REFERENCES
ERDAS, 1999. Field Guide. Fifth edition. USA, ERDAS Inc., 672 р.
eCognition Developer 8.9, 2013. User Guide. Trimble Germany GmbH, Arnulfstrasse 126, D-80636 Munich, Germany.
Richards, J.A., Xiuping, J., 2005. Remote Sensing Digital Image Analysis: An Introduction. Birkhäuser, 439 р.
Kolesnikov B., 1956. Siberian pine forests of the Russian Far East, Nauka Publisher, Moscow-Leningrad, 262 p.
Korets, M.A., 2014. Mapping forest inventory stands based on segmentation of a digital elevation model and satellite images. South-Eastern. European Journal of Earth Observation and Geomatics, 3 (2S), pp. 513-516.
Korets, M.A., Cherkashin, V.P., Ryzhkova, V.A., 2002. Estimation of the forest areas using adjoin analysis of the GIS and remote sensing data. Forest ecosystems of the Yenisei meridian. FUE «Publishing House SB RAS», Novosibirsk, pp. 173-180.
Monserud R.A., Leemans R., 1992. Comparing global vegetation maps with the Kappa statistic. Ecological modeling, 62, pp. 275-293.
Prokushkin, S.G., Abaimov, A.P., Prokushkin, A.S. Masyagina, O.V., 2006. Biomass of ground vegetation and forest floor in larch forests of cryolitozone of Central Siberia. Contemporary problems of ecology, 2, pp. 131-139 (in Russian).
Prokushkin S. G., Bogdanov V. V., Prokushkin A. S., Tokareva I.V., 2011 Post-fire restoration of organic substance in the ground cover of the larch forests in permafrost zone of Central Evenkia. Biology Bulletin, 38, pp. 183-190.
Ryzhkova, V., Danilova, I., Korets, M., 2011. A GIS-based mapping and estimation the current forest landscape state and dynamics. Journal of landscape ecology, 4 (1), pp. 42-55.
Figure 5. RS-based forest types layer overplayed by DEM-based morphometric classes for the fragment of test site