ANALYSIS OF THE INFLUENCE OF DISTANCE ON DATA ACQUISITION INTENSITY
FORESTRY TARGETS BY A LIDAR TECHNIQUE WITH TERRESTRIAL LASER
SCANNER
F. Bordina,d, E.C. Teixeiraa,b, S. B. A. Rolima, F.M.W. Tognolic, C.N. Souzad, M.R. Veronezc
a Graduate Program in Remote Sensing, Federal University of Rio Grande do Sul (UFRGS), Porto Alegre - RS, Brazil [email protected]
b
State Foundation of Environmental Protection Luiz Henrique Roessler (FEPAM), Porto Alegre - RS, Brazil [email protected]
c Graduate Program in Geology, University of Vale do Rio dos Sinos (UNISINOS), São Leopoldo-RS, Brazil, (ftognoli, veronez)@unisinos.br
d
Civil, Surveying and Cartographic Engineering, University of Vale do Rio dos Sinos (UNISINOS), São Leopoldo-RS, Brazil, (fabianebor, souza)@unisinos.br
KEY WORDS: Remote sensing, Terrestrial laser scanner, k-means algorithm, LIDAR, laser intensity, radiometric calibration
ABSTRACT:
The forest sciences as well as other areas of knowledge benefit from technological advances to develop their working methods and increase their knowledge of their specific field of study. New equipment and methods are continually developed to support these applications. In the last decade, laser scanning and profiling systems have been consolidated as one of the most effective technologies for geospatial data acquisition. Based on the time-of-flight and with an electromagnetic spectrum that ranges into the mid-infrared, 1535nm, the terrestrial laser systems are appropriate for correlating the intensity data with physicochemical properties. Thus, the main objective of this study was to evaluate the influence of the distance to the target in the data acquisition intensity targets forest in order to support future studies of correlation between this variable and the physicochemical characteristics of the targets. In this study we used the Terrestrial Laser Scanner 3D Ilris with Optech operating principle based on flight time and wavelength of 1535nm spectral range from infrared magnetic medium. The data acquisition targets intensity was assessed at distances (1m à 50m) by using a target reference of 99% reflectance. The results were analysed and showed that the distance interferes with the return of intensity. From the results of this research recommend that the intensity data are calibrated in relation to distance before using them as a source for study of the physical-chemical characteristics of the targets.
1. INTRODUCTION
The forest sciences as well as other areas of knowledge benefit from technological advances to develop and improve their working methods and to increase their knowledge about a specific field of study. New equipment and methods have been continually developed to support these applications. In the last decade, systems for laser scanning and profiling have been consolidated as one of the most effective technologies for geospatial data acquisition. The automated data acquisition has expanded rapidly in recent years, together with the technological advances made in the areas of surveying and mapping (Buckley et al., 2008). The scanning systems and laser profiling, also known as Terrestrial Laser Scanner (TLS), have some characteristics that apply so important in forest analysis. The TLS has the advantage of being a fast method of non-destructive data acquisition (Seielstad et al., 2011). In the most cases, the Terrestrial Laser Scanner generates its own format file of the data collected. The files are based on a structure in which coordinates of the points in space (X, Y, Z), the value of the intensity of the laser pulse (I), and the values obtained from the digital camera (RGB) are stored according the sequence XYZ, I, RGB. Spatial information obtained from laser scanners are commonly used for both volume estimation and identification of geometric features. RGB data improve the visual identification of features and provide a better understanding of the object. However, there is a lack of specific applications for the intensity values that return after interaction with the target. Variations in physical and chemical
characteristics of the targets do modify the intensity. The main goal of this study was to test a methodology for acquisition of intensity from laser scanner in forest targets and to analyse the influence of distance in the quality of data intensity acquisition. The results will support future studies that will approach the correlation between intensity and physicochemical characteristics of the forest targets.
1.1 Intensity
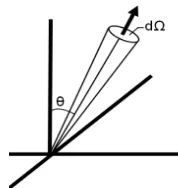
In this study, the intensity is based in the definition by Colwell (1983) that is the variation of the flux by energy for unity by solid angle irradiated in the same direction from the point source. It is characterized by the symbol I and is given in watts per estereoradian (W/sr). Or even as the quantity by energy that passes through by a unit area per second, per estereoradian. The Figure (1) and the Equation (1) illustrate this concept.
Figure 1. Point source radiating energy in a solid angle (Colwell, 1983).
=
Ω (1)
where I = intensity
E = quantity by energy that passes through by a
unit area per second
dΩ = solid angle
Therefore, the radiation does a solid angle dΩ with the normal to the area “A”. And, the projection this area with the radiation passing is given for Acosθ.
The intensity can to be defined also, realizing an analogy to the radar equation. For the LIDAR, the energy that returns is described for Equation (2), (Baltsavias 1999, Wehr and Lohr 1999, Wagner et al. 2008, Höfle and Pfeifer 2007).
=
(2)where Pr = is the energy that returns to the sensor after
its issuance, the target reflection and dispersion in the atmosphere.
Pt = is the energy of the laser output pulse
ρ = is the reflectance of the target
A = is the effective area of the laser on the
surface of the target.
R = is the distance between the sensor and the
target.
= is the transmission efficiency of the optical sensor, the laser pulse and the properties of the receiver.
= is the efficiency of transmission of the atmosphere between the sensor and target.
Other terms such as brightness, irradiance, BRDF or BRF (radiation backscattered from the surface in a given direction), reflectance factor or relative reflectance are also used.
In practice, the laser scanner sensors measure the photon flux that enter in the receiver from a given direction and the solid angle, namely, the scattered radiation which is related to the received signal power. Laser scanners record the discrete return of pulse power received as a single digital number representing the intensity. The recorded intensity is proportional to the function of bi-directional reflectance distribution (BRDF) the target, which can be written in terms of laser power in accordance with the Equation (3) (Leader, 1979).
=
Ω (3)
where Pi and Ps = are the energy incident on the target
and the energy (dispersion) that returns to the sensor, respectively.
Ωs = is the solid angle of dispersion.
θs = is the angle between the direction of the
surface normal and the scattering target.
The fact is that the intensity of return is dependent upon the physicochemical characteristics of the target material.
2. MATERIALS AND METHOD
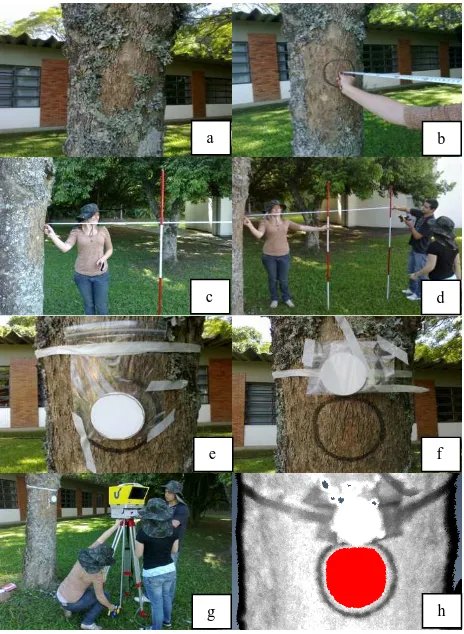
The study materials for data acquisition intensity values were a tree located on the campus of the University of Vale do Rio dos Sinos in São Leopoldo, Brazil and a terrestrial laser scanner 3D Ilris Optech TLS. The acquisition was planned and executed in two steps. The first study was performed to determine the minimum distance between the equipment and the target (a trunk of a tree) to acquire intensity data. Were tested distances for 1 meter to 5 meters. The following study was performed in two different targets on the same tree trunk. One target was a sample trunk and the other standard Spectralon® 99% reflectance at different distances and radiometric resolutions of 8 and 16 bits. At this point we performed an analysis of the interference distance (5 to 50 m) the value of the intensity of return TLS. The acquisition of the intensity data of this stage is shown step by step in Figure (2).
Figure 2. Mosaic of pictures showing the procedures of acquisition of the intensity data as a function of distance and type of targets. (a) Tree before cleaning. (b) Tree and the target demarcated after cleaning. (c and d) Marking the distances. (e and f) Representation of the target in the trunk and Spectralon® 99%. (g) Measuring the height of park equipment for maintaining the viewing geometry. (h) Points of interest enhanced in red in the point cloud.
The stem of the tree originally had lichens, which were previously removed (Figure 2a). After cleaning, an area was selected in a trunk-shaped circle and marked with black pen (Figure 2b). After that, different distances were marked using metric tape, beacons and pickets (Figure 2c and 2d). The fixation of the Spectralon® 99% on the tree trunk required a plastic bag so that Spectralon® 99% would not have contact with the surface of the tree and would be removed when necessary (Figure 2e and 2f). The plastic was cut so that the center of Spectralon® 99% was the same without the plastic coating, leaving only a 5mm circular edge to fixate the plate. This
a b
c d
e f
g h
fixation procedure was performed with plastic protection for the preservation of Spectralon® 99%, because it cannot come into contact with dust or grease.
In order to maintain the viewing geometry it was necessary to perform the acquisition twice in the same area, one of them scanning the Spectralon® 99% and after scanning only the trunk (Figure 2e and 2f). For the same geometry, were also kept the heights of park equipment (Figure 2g). Scanning was performed with a spacing of 0.5 mm between points at four distances, 1m, 2m, 3m and 5m for both the trunk and for the Spectralon® 99%. These distances were analysed to determine what the minimum spacing between the target and the TLS for intensity data acquisition purposes.
After scanning, the (X, Y, Z, I) data were processed. It was possible to identify the targets of interest as shown in detail in the Figure (2h). The red area illustrates the selection of the target in the point cloud directly on the trunk. For the different distances, i.e., 1m, 2m, 3m and 5m, the intensity data were collected and compared in order to determine the average intensity of return of the laser beam. Such information has helped to establish some criteria for imaging of forest targets, aiming the correlation with physicochemical properties.
In the moment that was defined the range for the acquisition distances were studied for radiometric calibration. The calibration model was developed from the distances of 5m, 10m, 15m, 20m, 30m, and 50m and was adjusted by the method of least squares (Equations 5, 6, 7 e 8) from a second-order polynomial (Equation 4), according to the following above:
!
= " ∗
$
2 !+ ' ∗ $
!+ (
!(4)
where I = is the intensity acquired with "n" ranging from 1 to 6 experiments performed at distances of 5m, 10m, 15m, 20m, 30m and 50m.
d = is the distance to the target in meters. a, b and c = are adjustment coefficients of the the partial derivative of intensity with respect to the coefficients a, b and c of the model with "n" ranging from 1 to 6 experiments.
. = ;
=1!⋯
independent terms of equation system I(n).
From the results of the intensity acquisition (at distances of 5m, 10m, 15m, 20m, 30m and 50m) were designed a model for the radiometric calibration with the variables I (intensity in digital numbers from 0 to 255) and d (distance meters ranging from 5 to 50m).
3. RESULTS AND DISCUSSION
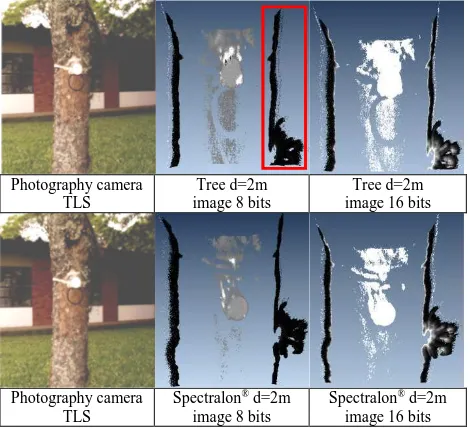
At this stage it was possible to verify the behavior of the return intensity of laser interacting with the targets set in the study object. Intensity data obtained at distances of 1, 2, 3 and 5 meters were collected. For these distances the object was processed with radiometric resolutions of 8 and 16 bits. The Figures, 3, 4 and 5 illustrates the targets reconstructed from the point cloud generated by TLS positioned a distance of 2 m, 3m and 5m from the target. The acquisition of 1 meter far from the target did not record any point and consequently a digital model was not generated.
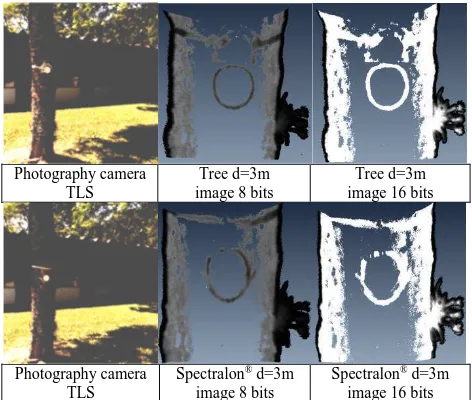
For the distances of 2 and 3 meters the point cloud did not have a complete record (Figures 3 and 4). For the distance of 5 meters the record of the point cloud was satisfactory with 8 bits of radiometric resolution (Figure 5). It was possible to verify the edge effect in all images highlighted in red rectangle in Figure (3). The mean intensity of return of Spectralon® 99 % was the maximum over a distance of 5m (Figure 5). Although Ilris - 3D operate with the principle of time of flight, the same result was observed in equipment operating by phase difference (Kaasalainen et al, 2009). target with 0.5mm spacing between points and radiometric resolution of 8 and 16 bits. Edge effect highlighted in red rectangle.
Photography camera TLS
Tree d=3m image 8 bits
Tree d=3m image 16 bits
Photography camera TLS
Spectralon® d=3m
image 8 bits
Spectralon® d=3m
image 16 bits Figure 4. Images produced by the intensity of the TLS 3m target with 0.5mm spacing between points and radiometric resolution of 8 and 16 bits.
Photography camera TLS
Tree d=5m image 8 bits
Tree d=5m image 16 bits
Photography camera TLS
Spectralon® d=5m
image 8 bits
Spectralon® d=5m
image 16 bits
Figure 5. Images produced by the intensity of the TLS 5m target with 0.5mm spacing between points and radiometric resolution of 8 and 16 bits.
Following were tested the distances of 5m, 10m, 15, 20m, 30m and 50m and the intensity showed lower values up to 10m, probably due to the glare reducer (Figure 6). It was possible to reach a modelling of intensity versus distance which may be represented by a second order polynomial with R2 = 0,9588 (Equation 9).
I = -3,4643d2 + 12,079d + 229,6 (9)
where I = is the return intensity in digital number of TLS.
d = is the distance to the target in meters.
In this study case was found that from 5m the intensity increased until close distance of 10m where occurred the deflection curve returning to decrease. It’s important to notice that the equation is based on a methodology where the edge effect was isolated and the scan was performed perpendicular to
the target (90°), was admitted that there was no influence of the viewing angle on the acquisition of intensity.
This model adjusts the intensity acquired at different distances to be normalized when it needs the comparison targets in which the intensity has been acquired at different distances. In other words, if methodologically it’s not possible to provide images targets on the same distance, a model must be developed for the intensity correction so the distance doesn’t interfere in the quality of results.
I = -3,4643d2+ 12,079d + 229,6 R² = 0,9588
170 180 190 200 210 220 230 240 250
5m 10m 15m 20m 30m 50m
In
te
ns
it
y
(D
N
)
Distance (meters)
Figure 6. Mathematical model of intensity adjusted for distance.
The distance showed it to have a direct influence on the intensity data acquisition, in this study. Before the intensity is used for studies of correlation with other variables, you should thoroughly study the type of equipment and behaviour in relation to the same distance as the target to be explored. In a study published by Eitel et al (2010) using a device with operating principle of flight time, but with a wavelength in the visible region comprising, 532nm, a methodology was developed for acquisitions much closer ranging from 1m to 2,6m. The authors report that the distance did not affect the acquisition of intensity data. However, it was found that the equipment requires a minimum initial distance of 5m and the return intensity of TLS decreases as the distance increases. Some devices have a dimmer brightness, which makes acquisitions closer or less than 3m, (Kaasalainen et al 2009), these results in lower intensities distance depends on the characteristics of each manufacturing equipment. This manufacturing information often not available to the end user.
4. CONCLUSION
The main objective of this study was to evaluate the influence of the distance to the target in the data acquisition intensity targets forest in order to support future studies of correlation between this variable and the physicochemical characteristics of the targets.
As the target is represented by a georreferenced point cloud it is supposed to be possible to determine the total volume of each variable separately, facilitating the process of the future studies to the determinate the amount of biomass. Any object modelled from a TLS is subject to the edge effect. In this study it was International Archives of the Photogrammetry, Remote Sensing and Spatial Information Sciences, Volume XL-2/W1, 2013
observed this phenomenon. Future researches in this area must develop methods for reducing or eliminating the edge effect of the point cloud during the processing. The results obtained in this study recommend that the minimal distance for scanning of forest targets is 5 meters considering only the intensity as variable of interest.
The distance showed it to have a direct influence on the acquisition of intensity data in this study. Therefore, before the intensity is used for studies of correlation with other variables, should thoroughly study the type of equipment and the performance of relative distance and the target to be explored. Each device has a different wavelength and interacts differently with targets to be studied. To infer a calibration data TLS with a specific target, should be developed calibration model.
In the case of using RGB pattern, the method presented in the study is not applicable because of the parallax distortion between the point cloud and the digital photograph.
These results allowed establishing some criteria for imaging target forest as well as the understanding and modelling of the interference distance of the data acquisition with Terrestrial Laser Scanner. Due to the results obtained with laser scanner 3D Ilris suggested that the minimum distance forest targets to scan in order to study correlation between the intensity of the laser return and physicochemical properties of the target, either 5 meters modelling point cloud with radiometric resolution of 8 bits.
Acknowledgements
The authors thank the technicians and researchers of the Remote Sensing and Digital Cartography Lab (LASERCA/UNISINOS), especially Beto Reis, Gabriel Soares and Marcelo Kehl de Souza for their support in the field activities. Leonardo Inocencio is thanked for their support in the processing and classification activities. PETROBRAS S/A is thanked for the financial support to the projects NEAP (Center for Applied Stratigraphy, Covenant 16 - SAP 4600242459) and "Mapping 3D Georeferenced Outcrops Using a LIDAR technique (Light Detection And Ranging)" (Statement of Cooperation 0050 0044869. 4.8 - SAP: 4600285973), both funded by the Sedimentology and Stratigraphy Technological Network. Geological Remote Sensing Laboratory at Federal University of Rio Grande do Sul (UFRGS) is thanked for facilities and equipment. ECT thanks the research grants provided by the Brazilian Council of Scientific and Technological Development (CNPq).
References
Baltsavias, E.P., Airborne laser scanning: basic relations and formulas. ISPRS Journal of Photogrammetry and Remote Sensing v. 54, p. 199–214, 1999.
Buckley, S. J., Howell, J. A., Enge, H. D., Kurz, T. H. Terrestrial laser scanning in geology: data acquisition, processing and accuracy considerations. Journal of the Geological Society, London, v. 165, p. 625-638, 2008.
Colwell, R.N.; Manual of Remote Sensing. American Society of Photogrammetryand Remote Sensing, Falls Church. Virginia, 2nd ed,1983.
Eitel, J.U.H., Vierling, L.A., Long, D.S. Simultaneous measurements of plant structure and chlorophyll contente in
broadleaf saplings with a terrestrial laser scanner. Remote Sensing of Environment v. 114, p. 2229-2237, 2010.
Höfle, B., and Pfeifer, N. Correction of laser scanning intensity data: Data and model-driven approaches: Journal of Photogrammetry and Remote Sensing, v. 62, p. 415–433, 2007.
Kaasalainen, S.; Krooks, A.; Kaartinen, H. Radiometric calibration of terrestrial laser scanners with external reference targets. Remote Sensing. v. 1, p. 144-158, 2009.
Leader, J.C. Analysis and prediction of laser scattering from rough-surface materials. J. OPT. Soc. Am. 1979, 69 610-629.
Seielstad, C.; Stonesifer, C.; Rowell, E.; Queen, L. Deriving fuel mass by size class in douglas-fir (pseudotsugamenziesii) using terrestrial laser scanning. Remote Sensing. v. 3, p. 1691-1709, 2011.
Wagner, W., Hyyppä, J., Ullrich, A., Lehner, H., Briese, C., Kaasalainen, S. Radiometric calibration of full-waveform small-footprint airborne laser scanners International Archives of Photogrammetry, Remote Sensing and Spatial Information Sciences, v.37 (Part 1), p. 163–168, 2008.
Wehr, A., Lohr, U., Airborne laser scanning an introduction and overview. ISPRS Journal of Photogrammetry & Remote Sensing. v. 54, p. 68–82, this issue, 1999.