AUTOMATIC MODEL SELECTION FOR 3D RECONSTRUCTION OF BUILDINGS
FROM SATELLITE IMAGARY
T. Partovi
a*, H. Arefi
a,b, T. Krauß
a, P. Reinartz
aa
German Aerospace Center (DLR), Remote Sensing Technology Institute, D-82234 Wessling, Germany
(tahmineh.partovi, hossein.arefi, thomas.krauss, peter.reinartz)@dlr.de
b
University of Tehran, College of Engineering, Dept. of Surveying and Geomatics Engineering, Tehran, Iran
[email protected]
Commission III, WG III/4
KEY WORDS: Digital Surface Model (DSM), Worldview-2, Orthophoto, Model-driven, Automatic 3D Roof Modelling
ABSTRACT:
Through the improvements of satellite sensor and matching technology, the derivation of 3D models from space borne stereo data obtained a lot of interest for various applications such as mobile navigation, urban planning, telecommunication, and tourism. The automatic reconstruction of 3D building models from space borne point cloud data is still an active research topic. The challenging problem in this field is the relatively low quality of the Digital Surface Model (DSM) generated by stereo matching of satellite data comparing to airborne LiDAR data. In order to establish an efficient method to achieve high quality models and complete automation from the mentioned DSM, in this paper a new method based on a model-driven strategy is proposed. For improving the results, refined orthorectified panchromatic images are introduced into the process as additional data. The idea of this method is based on ridge line extraction and analysing height values in direction of and perpendicular to the ridgeline direction. After applying pre-processing to the orthorectified data, some feature descriptors are extracted from the DSM, to improve the automatic ridge line detection. Applying RANSAC a line is fitted to each group of ridge points. Finally these ridge lines are refined by matching them or closing gaps. In order to select the type of roof model the heights of point in extension of the ridge line and height differences perpendicular to the ridge line are analysed. After roof model selection, building edge information is extracted from canny edge detection and parameters derived from the roof parts. Then the best model is fitted to extracted façade roofs based on detected type of model. Each roof is modelled independently and final 3D buildings are reconstructed by merging the roof models with the corresponding walls.
* Corresponding author.
1. INTRODUCTION
Detection and three-dimensional modelling of buildings from digital surface models (DSM) is an essential prerequisite in many 3D city applications such as placement of telecommunication towers, planning of disaster management and urban development, marketing, tourism, real estate, web based mapping and many more.
Automatic three-dimensional modelling of buildings has been a popular research topic in the last decade. Nevertheless representing a suitable method to achieve the required rapid, complete automation, accurate extraction of realistic models for large urban area for GIS applications and photogrammetry is a still challenging problem, especially if only satellite data are available. Thus, a new technique and strategy that increase the efficiency for the 3D city modelling is required.
With the fast advancement of spatial and spectral data acquisition systems in recent years, numerous approaches for detection and reconstruction of buildings from various types of data such as high resolution aerial images, airborne LiDAR data, oblique imagery, terrestrial laser scanning, digital surface model derived from stereo and multi-stereo matching and combination of heterogeneous data sources have been presented. As rather new research topic in this context, the two
latter cases can be mentioned. A generated DSM from spaceborne data using stereo image matching has several problems in quality and resolution especially for ridge line and eave detection. Therefore for automatically improved model generation, a fusion with additional data sources together with the generated DSM could be helpful (Sirmacek et al. 2012, Avbelj et al. 2013).
The many proposed approaches for reconstruction of 3D building models can be categorized into two strategies (Maas and Vosselman, 1999): data-driven, non-parametric or bottom-up strategy and model-driven, parametric or top-down strategy. Model-driven approaches consider a point could of primitive building and search among basic building shapes in a model library, and then the most appropriate model fitting to the point cloud is selected. Optimum parameters for each model are calculated and assigned to selected model (Tarsha-Kurdi et al., 2007). For model estimation and selection, several approaches have been proposed. Maas and Vosselman (1999) suggested closed solutions for the determination of the parameters and used standard gable roof type building models based on invariant moments of 2 1/2-D points cloud. They worked on original laser scanner data points without using an interpolation to a regular grid. Brenner and Haala (1998) segmented buildings into basic primitives based on the given ground plan International Archives of the Photogrammetry, Remote Sensing and Spatial Information Sciences, Volume XL-1/W3, 2013
and then fitted these primitives to the DSM data. To this end the DSM is segmented according to the directions of normal vectors. These compatible regions as well as obtained rectangles of ground plan decomposition are used for parameter estimation. Then the quality of the reconstructed final model is evaluated by a reliable test.
Suveg and Vosselman (2004) developed a method for 3D reconstruction of buildings by integrating 3D information from stereo images and a large scale GIS map. First a building on ground plan is subdivided into primitives. Optimum schemes of partitioning are determined by minimum description length criteria and a search tree. Then the building primitives are verified by a least square fitting algorithm. The approximated values of the fitting method are obtained from map and 3D information from the stereo images. Kada and McKinley (2009) proposed a method for decomposition of the footprint by cell decomposition. In this method, the buildings are partitioned into non-intersecting cells along its façade polygons using vertical planes. The roof shapes are determined by directions generated from LiDAR points. Then models of buildings blocks are reconstructed using a library of parameterized standard shapes of model. Arefi and Reinartz (2013) proposed a model-driven approach based on the analysis of the 3D points of DSM from satellite images in a 2D projection plane. In this method parametric models are generated through single ridgeline reconstruction and subsequent merging of all ridgelines for a building. The edge information is extracted from the orthorectified image.
In contrast to model-driven methods, data-driven approaches model primitives or complex building by using a point cloud regardless of a model library. In this strategy, the methods based on segmentation (Rottensteiner and Briese, 2003), region growing (Rottensteiner, 2006), 3D Hough transforms (Vosselman and Dijkman, 2001) or Random Sample Consensus (RANSAC) (Kurdi et al., 2008) are used to estimate and segment roof planes. Sirmacek et al (2010) proposed a method based on rectangular shape detection (box fitting) algorithm to detect and reconstruct simple and complex buildings. In this method canny edges and DSM from Ikonos image pairs are used. Sohn et al (2009) presented a data-driven algorithm based on Binary Space Partitioning Tree (BSP-Tree). The proposed method integrates airborne LiDAR data with high-resolution satellite data for creating prismatic building models. Verma et al. (2006) presented a method based on integration of data-driven and model-data-driven strategies to reconstruct complex buildings from airborne LiDAR data. The main steps consist of using algorithms for segmentation of roof and terrain points and roof topology inference. Tarsha-Kurdi et al. (2007) made a comparison between data-driven and model-driven methods. The advantage of a model-driven approach is that it provides parametric and geometrical models without visual deformation. It generally exhibits high computing speed because only the parameter values are calculated. The disadvantage of these methods is to be dependent on the building types in the building library. In contrast to model-driven, data-driven methods can be used for a complex building but they may provide the models with visual deformations, which leads to higher processing times (Tarsha-Kurdi et al., 2007). Also the accuracy of the model is more related to the techniques used in building modelling approaches than to the approach type (Tarsha-Kurdi et al., 2007).
In this paper, a model-driven combined with a data-driven approach is proposed to reconstruct 3D building in the urban area from Wordview-2 DSM and orthorectified image.
Orthorectified images are employed for a better extraction and modification of building edges (eaves) and ridgelines. After extracting and enhancing each ridgeline, points perpendicular to the ridgeline are generated in several profile lines. According to these points the slope parameter for each roof can be computed. The type of roof is detected by the analysis of height of roof points in direction of ridgeline. In order to achieve a proper building outline, a method is proposed based on canny edge detection. The third dimension for each building façade is determined by analysing the point heights in direction perpendicular to and along ridgelines. A 3D model is finally defined by merging all the individual models. Then some post processing refinements is employed to optimize the shape of approximate model.
2. PROPOSED ALGORITHM FOR 3D BUILDING RECONSTRUCTION
In this section, an overview of the proposed algorithm is presented. Most important is the integration of Digital Surface Model (DSM) from WorldView-2 multi stereo satellite images and the corresponding orthorectified panchromatic and multispectral images. The DSM is produced from four panchromatic WordView-2 images with 50cm ground sampling distance using a fully automated method based on minimization of total variation by convex optimization (Kuschk, 2013).
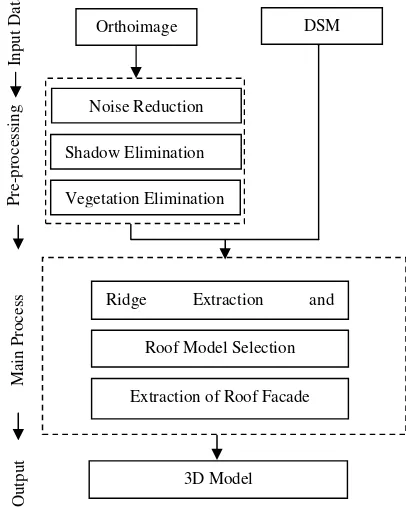
The work flow of the proposed method, to reconstruct automatically full 3D buildings is depicted in Figure 1. The details of the algorithm are explained in the following subsections.
Figure 1. Work flow of the proposed method
2.1 Pre-processing
In the pre-processing step, in order to improve the final model, some enhancements are performed on the orthorectified images. The method mainly consists of two steps: First, using a noise filter so that redundant details are removed from the
3D Model
Ridge Extraction and
Roof Model Selection
Extraction of Roof Facade
Orthoimage DSM
panchromatic images. Next, masks of shadow and vegetation are generated from the pansharpened orthorectified image, and eliminated from the orthorectified panchromatic image. The details of each step are explained as following:
2.1.1 Noise Reduction: In order to remove noise and redundant details from the image, a bilateral filter is used (Tomasi and Manduci, 1998). Bilateral filter is a non-linear smoothing where the intensity value of each pixel is replaced by weighted mean of intensity value of neighborhood pixels. According to this property, it can remove noise and still preserve edges (Sirmacek, et al 2012). Figure 2 illustrates the noise reduction by showing images before and after filtering.
Figure 2. (a) PAN image (b) Bilaterally filtered result
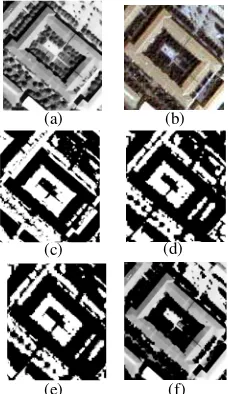
Masking Vegetation and Shadow Regions: For using spectra and spatial information with high resolution, a pansharpened image is used. Vegetation regions are detected by calculating the Normalized Difference Vegetation Index (NDVI). In order to eliminate the shadow areas, the ratio of the chromaticity to the intensity in the HSV color space is used (Tsai 2006). The shadow areas exhibit a higher ratio of H to V. The suitable thresholds for both masks are determined according to Otsu’s method (Otsu, 1979). Figure 3 illustrates the filtered panchromatic and pansharpened images, the generated shadow and vegetation masks, the integrated shadow and vegetation mask, and the filtered panchromatic image with eliminated shadow and vegetation.
Figure 3. (a) Orthorectified PAN image (b) Pansharpened image (c) Shadow mask (d) Vegetation mask (e) Integration of masks (f) Refined image
2.2 Main Process of the Proposed Method
The process of the proposed method consists of three main steps ridge extraction and refinement, roof model selection and
extraction of roof façade. Detailed explanations are given in the following subsections.
2.2.1 Ridge Line Extraction and Refinement: In this method, extracted ridge lines are the basis for the 3D model. Therefore the location of the ridge line in buildings with tilted roofs should be extracted carefully. The quality of the final model depends strongly on the extracted ridge lines. In order to extract the ridge line, three feature descriptors such as surface normal, local maxima and canny edges are extracted from DSM and orthoimages which were refined in several ways in previous steps. The surface normal is a perpendicular vector to the surface which represents the orientation of a pixel and its neighborhood in the surface. The surface normal is estimated based on a bicubic fit of data, and then a cross product is performed to get the normal (Jain and Dubes, 20xx). This feature is used to eliminate edges such as eaves which exhibit sharp height jumps at the edges of buildings. The other feature is local maxima which are extracted from the DSM by using image reconstruction based on geodesic dilation (Arefi and Hahn, 2005). In this method, two images are considered as mask and marker. The mask image is predefined, here it is considered as the DSM. The marker image is built by a height offset to the mask image. In iterative steps, the marker image is dilated and compared with the mask image. Then the distances of the pixels considered between mask and marker image are calculated and pixel with lower heights are replaced. This means that the marker image is limited to the mask image. In the final step, stability is reached and local maxima are obtained. The third feature for ridge line extraction is canny edges from modified ortho-panchromatic image. These three features are used to extract the ridge points. Next, Random Sample Consensus (RANSAC) algorithm (Fischler and Bolles, 1981) is employed to extract the final ridge lines from the ridge points. Figure 4 illustrates the steps of ridge line extraction.
Figure 4. (a) Surface normal (b) Local maxima (c) Canny edge information (d) Ridge points (f) Ridge lines
After ridge line extraction based on the RANSAC algorithm, some modifications are performed to merge or improve lines. For instance, as can be seen from figure 5 on the left side, two ridge lines are extracted which are close and parallel to each other. Therefore, these extra lines can be discarded from our results by considering predefined distance threshold in company of neighbouring lines.
(a) (b)
(c) (d)
(e) (f)
(a) (b)
(b)
(a) (c)
(d) (f)
Figure 5. Elimination of extra line
On the other hand, the RANSAC algorithm is highly depends on the density of the points and sometimes like in figure 6 on the left side; one line is divided to two lines which are separated from each other. Therefore, by considering some criteria, these separated lines can be merged together to form one unique line.
Figure 6. Merge two lines to one line as ridge line
In some cases, length of extracted ridge lines may be longer or shorter than the real one. In order to overcome this problem, we can utilize the canny edge detector and extend or shorten these imperfect lines within the predefined radius of the neighborhood to intersect extracted lines using the canny edge detection algorithm (Figure 7).
Figure 7. Refinement of ridge line according to canny lines
After performing the aforementioned modifications, sometimes the extracted ridge lines pass or do not reach the intersection point and the end point of the lines may be located within a short distance from the intersection point. Therefore, the distance of the end points are calculated from the intersection point and if the computed distance is below the predefined threshold, the intersection point is considered as an endpoint and the modification can be performed (Figure 8) .
Figure 8. (left) Closer view of ridge lines of roof, (right) refined ridge lines
2.2.2 Roof Model Selection: In this paper, a novel approach has been implemented to define an appropriate model for each roof. Since building roofs as seen from space exhibit only a low spatial resolution (e.g. 1 m pixel size), only three types of roofs can possibly be distinguished (flat, gable and hipped). Top and side views of these roofs are indicated in figure 9. As can be seen from the side view of the hipped roof in figure 9, the changes of the height from two end points of the ridge line are smooth and the roof height decreases gradually. For the gable roof, the two end points of the ridge line are followed by a vertical wall. On the other hand, in flat roofs, the situation is different and a ridge plane is existent instead of a ridge line. Therefore, for two roof cases, height changes are very large and perpendicular to the ridge line/plane.
Figure 9. Roof Models
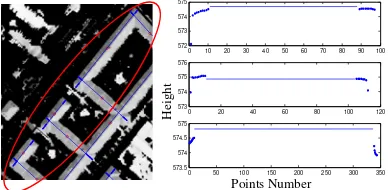
The first step is to distinguish tilted roofs (hipped and gable roofs) from flat roofs. Thereafter, for tilted roofs, two main parameters which are height variation in the direction of the ridge lines at the two end points (ridge points) are investigated to reach a reliable roof model selection. For this purpose, the extension of the ridge line across the ridge points are analysed based on predefined thresholds. This procedure is continued until the last point on the roof is found. Depending on the slope at these extended points a decision can be taken, as indicated in figure 10, and the appropriate roof model is selected. All buildings in figure 10 are hipped roofs and the height variation close to the two ridge points show a rather smooth slope.
0 10 20 30 40 50 60 70 80 90 100
572 573 574 575
0 20 40 60 80 100 120
573 574 575 576
0 50 100 150 200 250 300 350
573.5 574 574.5 575
Figure 10. (left) Extracted ridge line with points along ridge, (right) height profile of points and ridge line
Furthermore, as mentioned before, height variations in the perpendicular direction to the ridge lines are investigated. In figure 11, extracted ridge lines and perpendicular bisectors are shown on the left side and height of the bisector points are indicated on the right side.
Points Number
He
ig
ht
Flat Roof
Gabled Roof
Hipped Roof
0 2 4 6 8 10 12 14 16 574.2
574.4 574.6 574.8 575 575.2
0 2 4 6 8 10 12 14 16 18
573 574 575 576 577
Figure 11. (left) Points of perpendicular bisector to the ridge line (right) Heights of these points.
After roof model selection, in order to define the slope value of the roof on each side of the ridge line, an appropriate buffer parallel to the ridge line is defined and height differences within inner points of the buffer are computed. Then, the mean of these height differences is considered as slope of that roof part and this procedure is continued for all available roof parts.
Figure 12. Extracted points in direction perpendicular to the ridge line.
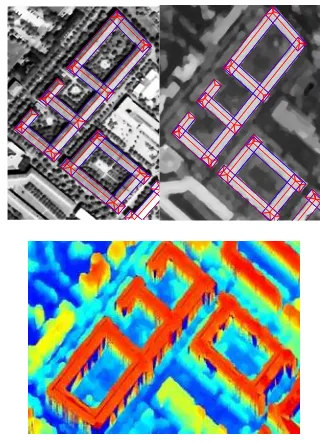
2.2.3 Extraction of Roof Façade: After roof model selection and determining its parameters, building roof boundaries can be delineated. Prerequisites of this delineation are corner points of building roofs in addition to two end points of the ridge lines. In order to detect these corner points, a novel approach has been implemented on the basis of utilizing ridge lines and canny points from modified ortho-panchromatic imagery. This procedure is performed in an iterative manner. Firstly, a line in parallel and close to the ridge line considered. Then the distances between all canny points and this line are computed and the numbers of points that have shorter distance are sorted in the matrix. This is continued enlarging the distance to the ridge line until a distance threshold between the last line and ridge line is reached. Then the line which exhibits the maximum number of canny point (the lowest minimum distance of all points) is selected as roof boundaries (Figure 13 (left)). This method needs some modification and after implementing aforementioned algorithm, these extracted lines are extended or shortened to intersect each other at corner points. Then, these corner points are connected to each other by polygons to derive finally the delineated building roofs boundaries (Figure 13 (right)).
Figure 13. (left) Extracted roof boundaries with canny point (right) Final roof boundaries.
2.2.4 3D Roof Model: In this section, 3D building models are provided by including different height levels and prismatic (LOD1) and parametric (LOD2) roof models are generated. For this purpose, after generating roof façade and their parameters in the previous sections, based on roof type, a best model is fitted to the roof points.
Figure 14. (left) Roof façade on the orthophoto-image (right) roof façade on the DSM (down) 3D building on the DSM
Each ridge line introduces a roof and each roof is modelled independently. To generate the final model, the individual models of the roofs are merged together. In the figures 15 and 16, LOD1 and LOD2 building models are showed.
Figure 15. Prismatic Model (LOD1)
Figure 16. Parametric Model (LOD2)
3. CONCLUSIONS
In this paper, an algorithm for 3D building reconstruction is proposed. This algorithm is based on ridge line extraction and differences of height in direction of and perpendicular to the ridge lines. This algorithm employed orthorectified PAN image and DSM generated by dense matching from Worldview-2. International Archives of the Photogrammetry, Remote Sensing and Spatial Information Sciences, Volume XL-1/W3, 2013
This method is a fast and simple way to extract a roof model type from a model library. In this method the accuracy of the ridge line extraction is crucial for the final model. At first some pre-processing has to be done for eliminating shadow and vegetation. Ridge points are extracted by integration of DSM and PAN data and ridge lines constructed by the RANSAC method. Next the heights in direction of and perpendicular to ridge lines are verified. Accordingly the types of roof model can be detected. Also the slope of each roof plane is computed by differences of heights perpendicular to ridge line. The boundaries of each roof are finally delineated by a new method based on canny point and extracted ridge lines. Further work will introduce validation and accuracy analysis, refine the steps and introduce more sophisticated minimization methods for building model improvements.
REFERENCES
Arefi H., and Hahn M., 2005. A morphological reconstruction algorithm for separating off-terrain points from terrain points in laser scanning data. In: International Archives of Photogrametry, Remote Sensing and Spatial Information Sciences, Vol. 36, part 3/W19.
Arefi H., and Reinartz P., 2013. Building Reconstruction Using DSM and Orthorectified Images, Remote Sensing, 5(4): pp.1681-1703.
Brenner C., Haala N., 1998. Rapid acquisition of virtual reality city models from multiple data sources. International Archives of Photogrammetry, Remote Sensing and Spatial Information Sciences, 32 (Part 5), pp. 323–330.
Avbelj J., Müller R., Reinartz P., 2013. Fusion of hyperspectral images and height models using edge probability. In: Whispers conference, IEEE Xplore, Florida,USA.
Fischler M., and Bolles R., 1981. Random Sample Consensus: A Paradigm for model fitting with applications to image analysis and automated carthography. Communications of the ACM 24(6), pp. 381-395.
Huang H., Brenner C., Sester M., 2011. 3D building roof reconstruction from point clouds via generative models. In: Proc. of 19th ACM SIGSPATIAL International Conference on Advances in Geographic Information Systems, Chicago, Illinois, USA, 1–4 November, pp. 16–24.
Jain A., and Dubes R. C., 1988. Algorithms for clustering data, Prentice Hall, EnglewCliffs, NJ.
Kada M., McKinley L., 2009. 3D building reconstruction from LIDAR based on a cell decomposition approach, International Archives of Photogrammetry, Remote Sensing and Spatial Information Sciences,38 (Part 3/W4), pp. 47–52
Kuschk G., 2013. Model-free Dense Stereo Reconstruction for Creating Realistic 3D City Models. In: JURSE, Urban Remote Sensing Event, Sao Paulo, Brazil, pp. 202-205.
Maas, H.G., Vosselman, G., 1999. Two algorithms for extracting building models from raw laser altimetry data, ISPRS Journal of Photogrammetry and Remote Sensing, 54(2-3), 153-163.
Otsu N., 1979. A threshold selection method from gray-level histograms, IEEE Transactions on Systems, Man and Cybernetics, 9 (1), pp. 62-66.
Rottensteiner F., 2006. Consistent estimation of building parameters considering geometric regularities by soft constraints. International Archives of Photogrammetry, Remote Sensing and Spatial Information Sciences, 36 (Part3), pp. 93– 106.
Rottensteiner F., Briese C., 2003. Automatic generation of building models from LIDAR data and the integration of aerial images. International Archives of Photogrammetry, Remote Sensing and Spatial Information Sciences, 34 (Part 3-
W13), pp. 174–180
Sirmacek, B.,. Taubenböck H., Reinartz P. 2012. Performance evaluation for 3-D city model generation of six different DSMs from air- and spaceborne sensors. IEEE Journal of Selected Topics in Applied Earth Observations and Remote Sensing, 5(1), 59-70.
Sohn G., Huang X., Tao V., 2008. A data-driven method for modelling 3d building objects using a binary space partitioning tree. In: Topographic Laser Ranging and Scanning: Principles and Processing, CRC Press, Taylor Francis Group, New York, NY, USA, pp. 479–50.
Suveg I., Vosselman G., 2004. Reconstruction of 3D building models from aerial images and maps. ISPRS Journal of Photogrammetry and Remote Sensing, 58 (3-4), pp. 202–224. Tarsha-Kurdi F., Landes T., Grussenmeyer P., Koehl M., 2007. Model-driven and data-driven approaches using LIDAR data: analysis and comparison. International Archives of Photogrammetry, Remote Sensing and Spatial Information Sciences, 36 (Part 3/W49A), pp. 87-92.
Tarsha-Kurdi F., Landes T., Grussenmeyer, P., 2008. Extended RANSAC algorithm for automatic detection of building roof planes from LIDAR data. The Photogrammetric Journal of Finland, 21 (1), pp. 97–109.
Tomasi C., and Manduci R., 1998. Bilateral filtering for gray and color images. In: International Coference on Computer Vision 1, pp. 839-846.
Verma V., Kumar, R., Hsu S., 2006. 3D Building detection and modeling from Aerial LIDAR Data. In: Proceedings of 2006 IEEE Computer Society Conference on Computer Vision and Pattern Recognition (CVPR 2006), New York, NY, USA, Vol II, pp. 2213–2220.
Victor J. D., Tsai., 2006. A Comparative Study on Shadow Compensation of Color Aerial Images in Invariant Color Models, IEEE Transactions on Geoscience and Remote Sensing, 44(6), pp.1661-1671.
Vosselman G., Dijkman E., 2001. 3D building model reconstruction from point clouds and ground plans. International Archives of Photogrammetry, Remote Sensing and Spatial Information Sciences, 34 (Part 3/W4), pp. 37–43. International Archives of the Photogrammetry, Remote Sensing and Spatial Information Sciences, Volume XL-1/W3, 2013