MULTISPECTRAL IMAGING IN CULTURAL HERITAGE CONSERVATION
S. Del Pozo a, P. Rodríguez-Gonzálvez a, b, L. J. Sánchez-Aparicio a, A. M uñoz-Nieto a, D. Hernández-López c, B. Felipe-García c, D. González-Aguilera a
a
Dept. of Cartographic and Land Engineering, Higher Polytechnic School of Ávila, University of Salamanca, Ávila, 05003, Spain - (s.p.aguilera, pablorgsf, luisj, alumni, daguilera)@usal.es
b
Dept. of M ining Technology, Topography and Structures, University of León, Avda. Astorga, s/n, Ponferrada, León, 24401, Spain - [email protected]
c
Institute for Regional Development (IDR), Albacete, University of Castilla La M ancha, Ciudad Real13003, Spain – [email protected], [email protected]
Commission II, WG II/8
KEY WORDS : Remote Sensing, Close-Range, Cultural Heritage, Camera, M ultispectral, Laser Scanning, Classification
ABS TRACT:
This paper sums up the main contribution derived from the thesis entitled "Multispectr al imaging for the analysis of mater ials and pathologies in civil engineer ing, constr uctions and natur al spaces" awarded by CIPA-ICOM OS for its connection with the preservation of Cultural Heritage. This thesis is framed within close-range remote sensing approaches by the fusion of sensors operating in the optical domain (visible to shortwave infrared spectrum). In the field of heritage preservation, multispectral imaging is a suitable technique due to its non-destructive nature and its versatility. It combines imaging and spectroscopy to analyse materials and land covers and enables the use of a variety of different geomatic sensors for this purpose. These sensors collect both spatial and spectral information for a given scenario and a specific spectral range, so that, their smaller storage units save the spectral properties of the radiation reflected by the surface of interest. The main goal of this research work is to characterise different const ruction materials as well as the main pathologies of Cultural Heritage elements by combining active and passive sensors recording data in different ranges. Conclusions about the suitability of each type of sensor and spectral range are drawn in relation to each particular case study and damage. It should be emphasised that results are not limited to images, since 3D intensity data from laser scanners can be integrated with 2D data from passive sensors obtaining high quality products due to the added value that metric brings to multispectral images.
1. INTRODUCTION
There is an increasing commitment to preserve and restore Cultural Heritage (CH) since it is a rich legacy on which the footprint of time does not go unnoticed. Therefore, current generations have the undeniable responsibility to preserve and safeguard it by studying the evolution of its state in order to avoid future damages on it (Sánchez-Aparicio et al., 2016). For that reason, the degradation study and assessment of historical buildings is one of the central themes in the maintenance of the world Cultural Heritage. Conservation activities in the field of heritage require new techniques for careful monitoring and evaluation of the integrity of these heritage elements.
Among the most common physical factors causing deterioration of materials in CH are moisture (by capillarity, filtration or condensation), erosion and pollution. Other factors such as the appearance of salts, animal or vegetal organisms, as well as the exposure to acid or alkaline environments produces a gradual decomposition of their construction materials being the main cause of aging and degradation of CH (Del Pozo et al., 2016b). In this way, changes on CH due to these factors are susceptible
of being assessed with new technologies since their capabilities can enhance and improve the effectiveness of more traditional strategies and methodologies for the preservation and protection of CH.
Furthermore, digital methods and techniques are able to link historical documentation data and disseminate them for a better understanding and perception of their evolution through time (Rodíguez-Gonzálvez et al., 2017). Within the broad diversity of techniques that can be used for this purpose, close-range remote sensing has become really important. This technology, together with the use of appropriate algorithms and data processing methodologies, allow data acquisition and interpretation in a fast, reliable and accurate way.
At this point, multispectral imaging technique plays a key role since it allows the integration of data acquired by all these non-destructive technologies proving to be a powerful tool to analyse damages on CH (Lerma et al., 2011). M oreover, multispectral imaging allows the generation of useful hybrid mapping products for quantitative and qualitative analysis: rectified images and orthoimages for visual interpretation (in true or false colour), 3D textured models from images acquired at different regions of the spectrum and also the so called 4D models; 3D models that are comparable over time in order to address monitoring processes. All of them may act as input data in the application of different strategies of multispectral classification and dimensional analysis, in order to assess possible chemical and physical pathologies, respectively.
In this framework, the present paper proposes multispectral imaging as comprehensive methodology to succeed documentation, interpretation and mapping of most common damages of CH assets based on: (i) sensor fusion of both active and passive sensors operating in different regions of the optical spectrum (400-3,000 nm) and (ii) the radiometric calibration of them in order to analyse physical values and obtain accurate results.
2. THEORETICAL BACKGROUND
In this section, a brief review of the phy sical fundamentals on which multispectral imaging data is based is presented.
2.1 Fundamentals of Remote S ensing
By studying the radiation behaviour through remote sensing, it is possible to derive conclusions about physical and chemical damages in CH elements. This is possible since the share of energy reflected, absorbed and transmitted by an object depends not only on the wavelength but also on the material composition and the roughness of its surface. Although each material has its specific spectral behaviour, it varies substantially as a function of the physicochemical properties of that material. In this way, moisture, degradation and decomposition influence this spectral behaviour. The amount of spectral bands required to identify a given material or pathology depends on the amount of materials to be discriminated as well as their possible alterations. Within the multispectral framework, a deep knowledge of the advantages provided by the different sensor operating principle as well the wavelength configuration of them are required to achieve successful pathology assessments and material characterizations of CH assets.
2.2 Passive and Active S ensors
M ultispectral imaging is usually associated with data captured by a single remote sensor capable of recording information at various wavelengths at the same time. However, multispectral datasets can be acquired by the combination of data from different typ es of sensors adding the advantages that various sensors can bring to the limited registration of a single one.
Sensors specialized in capturing the portion of energy reflected on the optical spectrum can be divided into passive or active according to their operating principle (Barrett, 2013). Passive remote sensing is based on recording radiation naturally reflected from the objects; in this case, the sun acts as the source of radiation. However, active remote sensors provide their own source of radiation being the backscatter signal the radiation that characterises the object. Active sensors do not portray the results in image format so to conduct studies through the fusion of both techniques rigorous corrections must be undertaken to achieve uniformity in the resolution of the final products.
Each sensor has its own advantages so that by selecting the most appropriate in each case we can better adapt to the needs required for case (Gonzo et al., 2004). In this way, reaching a compromise between costs, level of accuracy , size and complexity of the object, etc. it is possible to cover a wide variety of studies being able to adapt better to every specific need. Among the advantages of passive sensors for multispectral analysis are their portability, cost savings, the short data acquisition time required, and their level of detail among others. However, they are very sensitive to changes in lighting conditions, are affected by shadows, and they should require some image corrections (e.g. vignetting and background noise produced by the optical systems and the electronics). In the particular case of multispectral cameras, sensors use multi-lenses systems with different filter combinations to acquire images simultaneously for its spectral ranges. They have the advantage of recording reflected energy in discrete wavelength ranges (Colwell, 1961). On the other hand, active sensors have the added value of providing metric to the narrowband radiometric intensity data without depending on lighting conditions. TLS have the capacity of performing 3D surveys useful to quantify chemical and physical damages of the CH asset (cracks, deformations, material losses, etc.). In most cases, a combination of both types of sensors is the best solution (Fuchs et al., 2004).
2.3 Radiometric Calibration
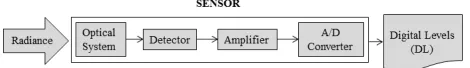
Figure 1 outlines the operation of all these devices. Detectors receive the incoming radiation that is converted into an electronic signal proportional to the radiance (W·m-2·sr-1·nm-1) reflected by surfaces. Some transformations regarding spatial, radiometric, and geometric characteristics of the radiance happen at this point. It is important to study these alterations to properly design data processing algorithms (Schowengerdt, 2006).
Figure 1. Process followed by radiation inside a sensor
resolution in the spatial, spectral and temporal measurement domains (Parr et al., 2005). The spatial resolution refers to the size of the smallest possible feature that can be detected and depend primarily on the distance between the object and the sensor as well as the field of view. The spectral resolution is the sensitivity of a sensor to respond to a specific frequency electromagnetic range. Finally, the concept of temporal resolution refers to the time interval between data acquisitions.
One of the most important challenges of remote sensing is t o be able to classify objects and their characteristics trough the analysis of the radiation reflected from their surfaces. Thus, the key is to invert the transformation process undergone by the radiation from the objects until it is digitally stored (Figure 1). This reverse process is known as the radiometric calibration of the sensor (Dinguirard and Slater, 1999). While remote sensing data in digital levels can be used without needing further processing (Robinove, 1982), this methodology does not take the full advantage of the possibilities that a radiometric calibration process open to it. The digital levels should be converted to their corresponding physical value (radiance or reflectance) to perform rigorous analysis as well as multisensory data fusion. In this way, the range of studies is broadened allowing multi-temporal analysis both qualitative and quantitative.
Regarding the radiometric calibration process, two are the most common methods: (i) the absolute and (ii) the relative calibration (Lo and Yang, 1998). For absolute calibration, the instrument response is compared with a known and consistent radiation source while the relative calibration consists of the equalization of the output signal when the sensor is irradiated by a uniform source of radiance (Dinguirard and Slater, 1999). Works referred to in this paper were performed by applying passive and active sensors calibrated by the absolute radiometric calibration method. In this way, each spectral band parameter is determined in order to transform the signal from raw digital levels to physical values.
At this point, the question arises whether all sensors have the same pattern of behaviour. Usually, a linear model with gain and offset parameters is appropriate to represent the internal behaviour of passive sensors (Richards and Richards, 1999) as Equation 1 shows.
DL = digital levels of the image pixels
E = solar irradiance of the scene
However, it must be borne in mind that Equation 1 is generic since passive sensors usually transmit a series of radiometric and geometric distortions to output images due to the optical and electronic system. Regarding the radiometric distortions, they usually correspond to an increase of the signal for the case
of the background noise and an attenuation for the case of the vignetting effect (Del Pozo et al., 2014). For its part, it is necessary to correct the sensor from the geometric distortion in order to perform radiometric analysis by sensor fusion. In this case, it is important to ensure that the projection of any point corresponds to the same pixel for all the images from the different sensors used.
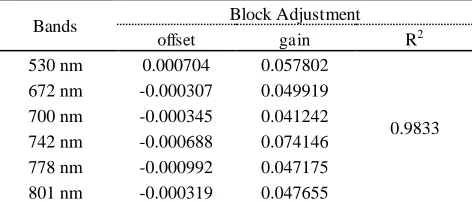
Taking into account all the above and for the particular case of a 6-band multispectral camera (M ini-M CA6, Tetracam®), Table 1 summarizes the calibration coefficients obtained after applying the Equation 1 particularized for this sensor (Del Pozo et al., 2014). The M ini-M CA6 was radiometrically calibrated on board an unmanned aerial system (at 30 m high) through a vicarious radiometric calibration (Slater et al., 1987) by using a self-developed software, M ULRACS. Figure 2 outlines the field campaign performed which required: (i) a test area with Lambertian surfaces, (ii) a spectroradiometer for ground truth measurements and (iii) a simultaneous data acquisition between the sensor and the ground-based spectroradiometer.
Figure 2. Sketch of the multispectral data acquisition performed to radiometrically calibrate the M ini-M CA6
Bands Block Adjustment
Table 1. Radiometric calibration coefficients of the M ini-M CA6
it is related not only to the scanning geometry but also to the scattering properties of the object surface.
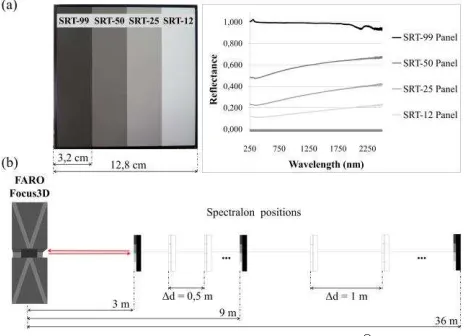
In order to show this logarithmic behaviour, Equation 2 shows the radiometric calibration equation obtained for the particular case of a phase shift TLS, the Faro Focus3D (905 nm). This sensor was calibrated by the reflectance-based method and under laboratory conditions (Del Pozo et al., 2016a). In this case, a 4-panel calibrated Spectralon® (Figure 3a) was stationed at 0.5 m distance intervals from 3 to 36 m in order to study the distance-behaviour of the backscattered TLS radiation (Figure 3b).
Figure 3. (a) Spectral behaviour of the Spectralon® panels. (b) Sketch of the Faro Focus3D data acquisition
I
= reflectivity of the object at the wavelength of the TLS depending of the distance range
a ,b= empirical coefficients related to the signal attenuation and laser scanner internal conversion
d= distance between the laser scanner and the object
I
DL = digital levels of the backscattered intensity data
The incidence angle (α) affects the backscattered intensity according to the Lambert´s Law (Höfle and Pfeifer, 2007), so that the higher the incidence angle the smaller the amount of light coming back to the TLS (Equation 3).
= reflectivity of the object at the wavelength of the TLS corrected from the incidence angle effect.
Taking into account the above and for the particular case of the Faro Focus3D, Table 2 summarizes the empirical calibration coefficients obtained after applying the Equation 2 for each range of distances (Del Pozo et al., 2016a).
Distances (m) a b gain R2
3-5.25 -1.0928 3.0295·10-5 0.0064 0.9868 5.25-9 -0.1134 4.9446·10-7 0.0059 0.9932 9-36 0.0214 3.9072·10-7 0.0054 0.9966 Table 2. Empirical calibration coefficients of the Faro Focus3D
For the radiometric calibration of both types of sensors, it was assumed that the surfaces of materials have a perfect Lambertian behaviour.
2.4 S ensor fusion
In order to perform damage assessments of CH and obtain hybrid cartographic products through multispectral images, it is necessary to make a correct registration of the different sensor used. If data from active laser scanners is combined with data from passive sensors, 3D intensity data must be converted into images with the same radiometric and spatial resolution as images recovered by the passive sensors. Therefore, it is necessary to conduct several geometric rectifications and radiometric transformations before the classification process (Table 3). The registration methodology follows two main steps: (i) to determine the angular and spatial position of the sensors and (ii) to reconstruct the 3D geometry of the object. Once the geometry and the position of the sensors is resolved, it is possible to extract the radiometric values of interest for each of the spectral bands of each sensor.
The internal orientation, through which focal length, principal point and geometric distortion are obtained, are usually solved before the radiometric calibration of the sensors (Luhmann et al., 2013). The external orientation can be solved by establishing the collinearity condition model. This model involves ground control
Classification techniques Characteristics Examples of classifiers
Pixel-based techniques Each pixel is assumed pure and typically labelled as a single class
Unsupervised: K-means, ISODATA, SOM , hierarchical clustering. Supervised: M aximum likelihood, M inimum distance-to-means, M ahalanobis distance, Parallelepiped, K-nearest neighbours.
M achine learning: artificial neural network, classification tree, random forest, support vector machine, genetic algorithms.
Sub-pixel-based techniques
Each pixel is considered mixed, and the areal portion of each class is estimated
Fuzzy classification, neutral networks, regression modelling, regression tree analysis, spectral mixture analysis.
Object-based techniques Geographical objects, instead of individual pixels, are considered the basic unit
points and tie-points of unknown position measured automatically in the images by SIFT (Scale-Invariant Feature Transform, Lowe, 1999) or SURF (Speeded Up Robust Features, Bay et al., 2006) algorithms. Accordingly, as an alternative to this process, there is the possibility of re-projecting the different images onto a common plane using a 2D projective transformation (Hartley et al., 2003).
2.5 Multispectral Analysis: Image Classification
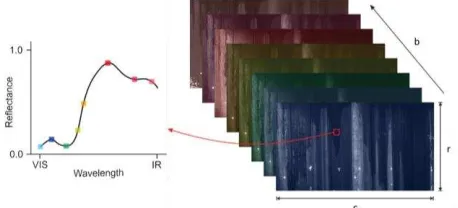
A multispectral dataset is essentially made up of an r×c×b matrix of numerical values in radiance or reflectance levels (if the calibration is performed). The value of each pixel will be located in a row (r), column (c) and a band (b) conforming the multispectral image (Figure 4).
Figure 4. r×c×b multispectral image and a spectral signature
The analysis of these data consists of a classification to identify and classify pixels with different properties. In the classification, a particular class is assigned to each pixel based on its radiometric and spectral characteristics (pixel-based techniques). The two generic approaches are the supervised and the unsupervised classifications (Lillesand et al., 2014). In supervised classification, the expert user identifies some pilot areas known as training polygons. These areas must correspond to specific informational classes (building materials, chemical pathologies, etc.). These areas must show a certain degree of homogeneity and balanced distribution in different zones of the multispectral image. For its part, unsupervised classification does not require the interaction of the user in the definition of classes. This is an automatic procedure that looks for spectral clustering of pixels. Finally, the user must analyse the classes detected to establish possible correspondences with informational classes.
It is common to choose mixed classification strategies that firstly apply unsupervised classifications serving as a guide for later supervised classifications. Furthermore, both strategies can take into account additional criteria as the surface roughness for the case of active sensors. In this case, the surface characteristics of the object would serve as an additional band that will improve the results of the final classification. Finally, thematic maps will be obtained showing the different building materials or the spatial distribution of a given pathology. These products will serve as a basis for problem-solving and decision–making in order to preserve CH elements. Furthermore, they can be back-projected to the 3D model for a complete inspection and management. Table 3 synthesizes the most significant image classification algorithms
3. MULTIS PECTRAL IMAGING APPLIED TO HIS TORICAL CONS TRUCTIONS
This section deals with the application of multispectral imaging to real cases in order to evaluate the flexibility and potential of this technique for detecting and classifying accurately a wide range of construction materials as well as their pathologies. Based on these premises, three consecutive case studies are addressed. The first one tested a multispectral sensor to different rock outcrops in order to analyse the ability of the sensor to differentiate types of construction materials used in CH elements (Figure 5). The second case study sought to evaluate the ability of this technique to assess different degrees of moisture since this is the most common pathology presented in CH constructions (Figure 6). In this case, sensor fusion of both active and passive sensors was the chosen technology.
Finally, all the knowhow and experience acquired with the previous works was applied to a specific heritage case study, the damage assessment of the façade of a church with apparent pathologies (Figure 7). For this final study, it was opted to apply a combination of both active and passive sensors previously calibrated.
The study area for this fist case study was an area lithologically characterized by sedimentary rocks (limestones, marlstones and sandstones) and placed in south-eastern part of the Rhône-Alps region of France. By using a M ini M CA-6 (530-801 nm) multispectral camera previously calibrated a total of 12 formations were remotely acquired. In addition, a standard calibrated reflection target (Spectralon®) was placed in each scene in order to obtain the irradiance at the each capture moment and so be able to obtain images in reflectance values (see Equation 1).
Figure 5. (a) Band 5 of the M ini-M CA6 in reflectance values, (b) images of probability and (c) the final rock classification map
(Del Pozo et al., 2015)
Transformed divergence Limestone M arlstone Vegetation
M arlstone 1,999 - -
Vegetation 1,999 2,000 -
Shadows 1,918 1,808 1,989
Table 4. Separability between classes (0-2)
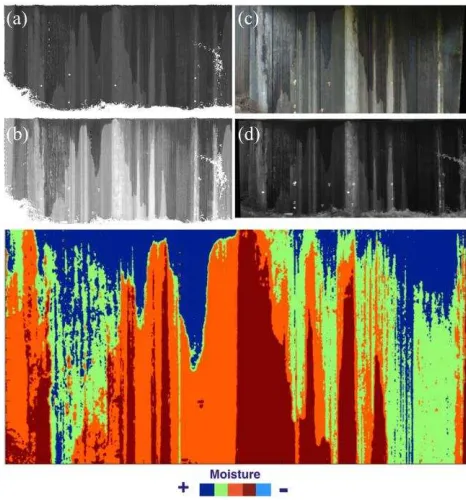
Regarding the second case study, a concrete structure was selected (Figure 6) in order to analyse the feasibility of automating the inspection of moisture through the analysis and processing of multispectral data from multiple sensors. This pathology was selected since it is a critical parameter for the early detection of CH assets degradation. In this case, a total of four sensors, two active laser systems and two passive digital cameras were used covering the visible, near and short wave infrared ranges. The active sensors involved a Faro Focus3D (905 nm) and a Riegl-Z390i (1550 nm) TLS. Passive sensors comprise a Canon EOS5D (400-700 nm) and a M ini-M CA6 multispectral camera (530-801 nm).
Sensor fusion was achieved in an 11-band multidimensional matrix after several geometric data transformations: (i) processing of 3D point clouds from laser scanners to 2D orthoimages and (ii) correction and registration of images from the two passive sensors. Orthoimages were generated from 3D models by the projection point clouds into a plane. For its part, 2D data from passive sensors was rectified. Finally and before the classification procedure, a homogenization of the geometric and radiometric resolution of the images was performed establishing a GSD of 25 mm and a radiometric resolution of 8 bits. Figure 6 shows the results of the last stage consisted of the
automatic mapping of different levels of moisture by applying the fuzzy k-means unsupervised classification method.
Figure 6. M oisture classification map. Combination of (a)(b) two active and (c)(d) two passive sensors. (Conde et al., 2015)
After this study, it was concluded that multispectral imaging is a suitable technique to detect different degrees of moisture where active sensors gave the added value of quantifying the damages and affected areas. Finally, and thanks to an analysis of variance, it was determined that the most suitable spectral range for moisture detection is the near and shortwave infrared.
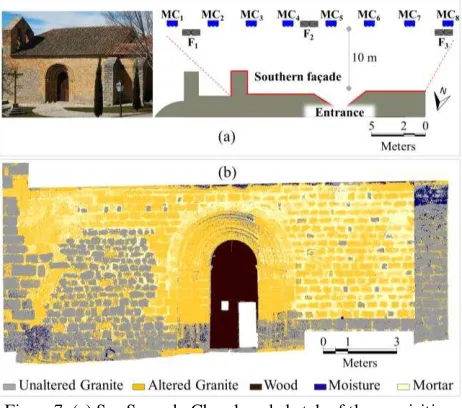
The final case study also proposed the hybridization of passive and active sensors in order to detect different building materials and pathologies in a façade of a church. In this case, the M ini-M CA-6 multispectral camera and the Faro Focus3D TLS previously calibrated were used as remote sensing technologies. The aim of this final work was to be able to achieve a damage assessment of the façade as well as evaluate the degree of improvement obtained by working with radiometrically calibrated sensors.
orthoimages were finally classified by applying a previous unsupervised and a last supervised classification.
Figure 7. (a) San Segundo Church and sketch of the acquisition setup. (b) Supervised classification map. (Del Pozo et al.,
2016a)
The multisensory map obtained after the final classification allowed to differentiate and quantify two different types of granite stones, the mortar between them, the wood of the main door as well as the main pathology, moisture (from capillarity and filtration). In addition and for both cases, significant improvements were achieved from the use of the sensors radiometrically calibrated. A 34% improvement of the results, by means of Kappa coefficient (Cohen, 1960), was reached after calibrating both sensors.
4. CONCLUS IONS
The thesis entitled " Multispectr al imaging for the analysis of mater ials and pathologies in civil engineer ing, constr uctions and natur al spaces" has been awarded by the CIPA-ICOM OS for its contribution to the preservation of Cultural Heritage. The research work deals with the study and classification of materials and pathologies in CH assets. This paper summarizes the main contributions to this field after a comprehensive study performed on a wide variety of sensors covering the optical range of the spectrum (from the visible to the shortwave infrared). In this way, the greater suitability for each specific pathology or case study has been established. Each sensor offers its specific advantages depending on its nature, operating principle and the wavelength for which it acquires information. The main conclusions reached after performing this research work are listed below:
- The basis of robust CH assessment by multispectral imaging is the use of sensors that have been previously radiometrically calibrated. In this way , it is possible to analyse physical values instead of digital levels as well as to monitor the evolution of CH pathologies through time by sensor hybridisation.
- To take the advantage of different sensors, sensors hybridisation stands out as the best solution to conduct comprehensive multispectral studies of CH. In this regard, four sensors (two active and two passive) have been combined successfully thanks to the pertinent radiometric and geometric calibrations of each one.
- Regarding passive sensors, some radiometric corrections had to be applied prior to the radiometric calibration process. Background error and vignetting are common systematic errors that are transmitted affecting the results. Although, these sensors have the disadvantage of being very sensitive to changes in lighting conditions they are very versatile, allowing to perform low-cost data acquisitions and analysis.
- Regarding active sensors, they are less influenced by changes in lighting conditions than passive sensors although they are more expensive. Since they are monochromatic, they have to be combined with other sensors in order to perform multispectral analysis. Thanks to them, it is possible to calculate the surface roughness that can serve as an additional criterion in the classification process of materials as well as to quantify the damages detected.
- Regarding multispectral sensors, it is very important to choose a correct configuration of their spectral bands in order to cover the spectral behaviour of the pathology /material to be analysed. The configuration of the multispectral camera used in this study (the M ini M CA-6, 530-801 nm) is ideal to analyse biological colonisations (mosses, lichens and vegetation) in CH elements. However, this configuration is not ideal to discriminate construction materials and other pathologies like moisture so it should be combined with other sensors operating at the short-wave infrared range in order to obtain more comprehensive results.
- In relation with the most common pathology of CH elements, the moisture content, it can be drawn that it is well characterised in the near to medium infrared range.
Finally, some implementations are open to improve these works in relation to obtain better CH analysis. These can include the study of the anisotropic behaviour (Soulié et al., 2007) of building materials in order to improve their characterization.
REFERENCES
Barrett, E.C., 2013. Intr oduction to envir onmental r emote sensing. Routledge, Abingdon.
Bay et al., 2006. Surf: Speeded up robust features. Computer vision–ECCV, (pp. 404–417).
Cohen, J., 1960. A coefficient of agreement for nominal scales. Educational and psychological measur ements, 20(1), pp. 37-46.
Conde et al., 2015. Automatic mapping of moisture affectation in exposed concrete structures by fusing different wavelength remote sensors. Str uctur al Contr ol and Health Monitor ing.
Del Pozo, S. et al., 2014. Vicarious radiometric calibration of a multispectral camera on board an unmanned aerial system. Remote Sensing, 6(3), pp.1918-1937.
Del Pozo, S. et al., 2015. Discrimination bet ween sedimentary rocks from close-range visible and very -near-infrared images. PloS one, 10(7).
Del Pozo, S. et al., 2016a. M ultispectral Radiometric Analysis of Façades to Detect Pathologies from Active and Passive Remote Sensing. Remote Sensing, 8(1), 80.
Del Pozo, S. et al., 2016b. M ultispectral Imaging: Fundamentals, Principles and M ethods of Damage Assessment in Constructions. In Non-Destr uctive Techniques for the Evaluation of Str uctur es and Infr astr uctur e, 11, 139.
Dinguirard, M . and Slater, P.N., 1999. Calibration of space-multispectral imaging sensors: A review. Remote Sensing of Envir onment, 68(3), pp.194-205.
Doneus et al., 2008. Archaeological prospection of forested areas using full-waveform airborne laser scanning. Jour nal of Ar chaeological Science, 35(4), pp. 882-93.
Fuchs et al., 2004. Confrontation du relevé laser 3D aux techniques de relève conventionnelles et développement d'outils numériques pour la restitution architecturale. Revue fr ançaise de photogr ammétr ie et de télédétection, 173-74, pp. 36-47.
González-Aguilera et al., 2009. 3D digital surveying and modelling of cave geometry: Application to paleolithic rock art. Sensor s, 9(2), pp. 1108-1127.
Gonzo et al., 2004. Photo-Realistic 3-D Reconstruction of Castles with M ultile-Sources Image-Based Techniques. In: The ISPRS XXth Congress, Istanbul, Turkey (12 July 2004).
Hartley et al., 2003. Multiple view geometr y in computer vision, Cambridge University Press, Cambridge.
Höfle, B., and Pfeifer, N., 2007. Correction of laser scanning intensity data: Data and model-driven approaches. ISPRS Jour nal of Photogr ammetr y and Remote Sensing, 62(6), pp. 415-433.
Lerma et al., 2011. M ultispectral sensors in combination with recording tools for cultural heritage documentation. Change Over Time, 1(2), pp. 236-250.
Li et al., 2014. A Review of Remote Sensing Image Classification Techniques: the Role of Spatio-contextual Information. Eur opean Jour nal of Remote Sensing, 47(1), pp. 389–411.
Lillesand, T. et al., 2014. Remote sensing and image inter pr etation. John Wiley & Sons, Hoboken (New Jersey).
Lo, C. and Yang, X., 1998. Some practical considerations of relative radiometric normalization of multidate landsat M SS data for land use change detection, Proceedings of the ASPRS/RTI 1998 Annual Convention, Tampa, Florida (30 M arch 1998).
Lowe, D.G., 1999. Object recognition from local scale-invariant features. Paper presented at the ICCV ’99. Procedings of the seventh IEEE International Conference on Computer Vision, Kerkyra, Greece (20 Sep. 1999).
Luhmann et al., 2013. Geometric calibration of thermographic cameras. In Ther mal Infr ar ed Remote Sensing. Springer, Netherlands, pp. 27–42.
Parr, A.C. et al., 2005. Optical r adiometr y. Academic Press, Cambridge, Vol. 41.
Pfeifer et al., 2008. Analysis of the backscattered energy in terrestrial laser scanning data. ISPRS, 37, pp.1045-1052.
Richards, J.A. and Richards, J., 1999. Remote sensing digital image analysis. Springer, Berlin, Vol. 3.
Robinove, C.J., 1982. Computation with physical values from landsat digital data. Photogr ammetr ic Engineer ing and Remote Sensing 48(5), pp.781-784.
Rodríguez-Gonzálvez et al., 2017. 4D Reconstruction and visualization of cultural heritage: Analyzing our legacy through time. The Inter national Ar chives of the photogr ammetr y, Remote Sensing and Spatial Infor mation Sciences, Vol XLII-2/W3.
Rodríguez-Gonzálvez et al., 2017. M obile LiDAR System: New Possibilities for the Documentation and Dissemination of Large Cultural Heritage Sites. Remote Sensing, 9(3), 189.
Sánchez-Aparicio et al., 2016. Practical Use of M ultispectral Techniques for the Detection of Pathologies in Constructions. In Non-Destr uctive Techniques for the Evaluation of Str uctur es and Infr astr uctur e, 11, 253.
Schowengerdt, R.A., 2006. Remote sensing: Models and methods for image pr ocessing. Academic Press, Cambridge.
Slater et al., 1987. Reflectance-and radiance-based methods for the in-flight absolute calibration of multispectral sensors. RemoteSensing of Envir onment, 22(1), pp.11-37.