QUANTITATIVE ANALYSIS OF URBAN EXPANSION IN CENTRAL CHINA
Y. Zeng a, *, Y. Xu a, S. Li a, b, L. He a, F. Yu a, Z. Zhen a, C. Cai c
a
School of Geoscience and Geomatics, Centre for Geoinformatics and Sustainable Development Research, Central
South University, Changsha 410083, China - [email protected]
b
Department of Civil Engineering, Ryerson University, Toronto, Ontario Canada M5B 2K3 - [email protected]
c
School of Distance Education, Central South University, Changsha 410083, China - [email protected]
Commission VII, WG VII/5
KEY WORDS: Urban Landscape, Dynamic Changes, Metropolitan Areas, Centre China
ABSTRACT:
Quantifying urban expansion forms is important to understanding regional urbanization processes and urban planning. For this pur-pose, conventional landscape indices are commonly used for quantitative analysis of urban landscape patterns. However, these land-scape indices only reflect information for one particular temporal phase of landland-scape patterns. This paper studies and quantifies the dynamic changes of urban landscape from 1993 to 2006 in Changsha-Zhuzhou-Xiangtan metropolitan areas in Hunan province of China using landscape expansion index (LEI), which contains information of the formation processes of landscape patterns. The re-sults indicate that there are three types of urban expansions: infilling, edge-expansion and outlying in the study area. The change of proportion of the three urban expansion types reveals that urban expansion patterns have changed from a messy, dispersed early de-velopment phase to more compact and reasonable layout from 1993 to 2006. Moreover, the urban expansion modes varied in differ-ent periods. From 1993 to 1996, the edge-expansion and outlying were the main types of urban expansion forms, indicating an early stage of rapid urban developments. Comparing with the edge-expansion, the outlying expansion increased rapidly in this period, which indicates urban development is messy and dispersion. Overall, the edge-expansion was the major type of urban expansion form during the study period with outlying as the second and rapidly-increasing major form of expansion prior to 1998, which indi-cates urbanization is in the early stage of rapid urban developments, and infilling as the second and rapidly-increasing major form of expansion after 1998.
1. INTRODUCTION
Since the 20th century, urbanization has been accelerated global-ly. With ongoing urbanization, a large population is inclined to concentrate in urban areas. It is estimated that more than 50% of the world’s population lives in urban areas and the projected proportion of urban population will reach 69.6% by 2050, with urban growth concentrated in Africa and Asia (UN Millennium Project, 2005; UNFPA, 2007). As the largest developing coun-try in the world, China has experienced unprecedented econom-ic growth and rapid urbanization since 1980s. Its urban popula-tion has rapidly increased. The projected proporpopula-tion of urban population will reach 75% by 2050, more that the world’s pro-jected increase.
As the economic development policies are being implemented in Central China, e.g., the Changsha-Zhuzhou-Xiangtan metro-politan areas in Hunan province. China has been experiencing significant growth in both population size and urban area. Rapid urbanization and accelerated urban expansion have converted natural landscape to largely impervious land use patterns. These landscape pattern changes associated with urbanization are im-portant factors that contribute to ecological and climatic chang-es at local, regional, and global levels. Therefore, quantitative information about urban expansion types and processes and its explicit expression are of great interest to diverse studies and applications such as urban planning, water and land resource management, and climate change research, among others. As a result, it is important to quantitatively reveal urban expansion forms for understanding the regional urbanization process,
con-trolling and planning future development of Changsha-Zhuzhou-Xiangtan metropolitan areas.
The urban land use change is commonly described as either a change of urban extent or the rate of urban land change. The ex-tent and rate of urban expansion provide indications of the ag-gregate size of cities and the rate at which non-urban land is converted to urban uses (Seto et al., 2002). However, aggregate growth rates and extent give limited information about spatial patterns of urbanization. In order to quantify and describe changes in urban land-use patterns beyond extent and growth rates, landscape indices have been applied to urban morphology (Luck and Wu, 2002; Herold et al., 2003; Seto et al., 2005). Although these indices have been used to conduct empirical analyses of landscape patterns, they are generally focused on simple analysis and description of the geometric features of a landscape patch or pattern, while neglecting information on dy-namic changes of landscape patterns (Liu et al., 2009). In order to describe urban expansion forms quantitatively, Wilson et al. (2003) proposed a moving window method to quantify three ur-ban growth types according to the percentage of land cover types. Xu et al. (2007) distinguished different urban growth types using the ratio between the length of common edge and patch perimeter. Liu et al. (2009) developed a quantitative method to identify and visualize different types of urban growth.
The core area of Changsha-Zhuzhou-Xiangtan metropolitan in Hunan, China includes the City of Changsha and its surround-ing areas. The total area is about 1428.99 km2 and is the key center of economy, culture, manufacturing and transportation of
International Archives of the Photogrammetry, Remote Sensing and Spatial Information Sciences, Volume XXXIX-B7, 2012 XXII ISPRS Congress, 25 August – 01 September 2012, Melbourne, Australia
Hunan Province, China. It is also one of biggest and rapidly de-veloping cities in Central China. Therefore, this study choses the core area of Changsha-Zhuzhou-Xiangtan metropolitan as the case study area. Using land use and land cover data derived from remotely sensed data from 1993 to 2006, the land use and land cover changes of four periods are calculated using GIS analyses. The dynamic changes of urban landscape from 1993 to 2006 in Changsha-Zhuzhou-Xiangtan metropolitan areas is then quantified and expressed using landscape expansion index (LEI), which contains information of the formation processes of landscape pattern.
2. DATA AND METHODS
This section briefly describes the data used in the study and the calculation of LEI, and discusses why LEI is better than the tra-ditional methods for analyzing dynamic changes of multi-time landscape patterns.
2.1 Land Use and Land Cover Data
Landsat TM/ETM+ images in 1993, 1996, 1998, 2001 and 2006 were selected for this study. For detecting urban expansion, the images were rectified to a Transverse Mercator coordinate sys-tem based on 1:5,000 scale topographic maps, and were re-sampled to a pixel size of 30m for all bands using the nearest neighbour algorithm. A root mean square error of less than 0.5 pixels was obtained for all of the rectifications.
Support Vector Machine (SVM) method was used for land use and land cover classification in this study. The images were classified in five land use and land cover types, that is, built-up, forest, cropland, bare land, and water. The overall accuracy and kappa variance were calculated based on an error matrix for each classified map. The overall accuracy and kappa coefficient of land use and land cover map was about 85% and 0.81, re-spectively. Land use and land cover data derived from remotely sensed data have a reasonable level of accuracy and are suffi-cient for urban landscape analysis and change detection.
Using land use and land cover data from 1993 to 2006, the changes of land use and land cover in the study area can be identified in four different periods: 1993 to 1996, 1996 to 1998, 1998 to 2001 and 2001 to 2006.
2.2 Landscape Expansion Index (LEI)
LEI is defined by using the minimum bounding box. The box represents the spatial extent of newly grown path, which is identified using maximum and minimum coordinates of the path. If a newly grown patch belongs to the infilling growth type, the box is mostly occupied by newly grown patch and the rest of box is taken by existing urban patch. If a newly grown patch belongs to the edge-expansion growth type, the box is partially occupied by newly grown patch, and the rest of box is occupied by existing urban patch and other land use patch. If a newly grown patch belongs to the outlying growth type, the box is partial occupied by newly grown patch and there is no other land use type except newly grown patch. In short, the LEI for a newly grown patch can be defined and calculated through ex-amining the characteristics of its minimum bounding box. When the newly grown patch is not rectangular, LEI is calculat-ed using equation (1); otherwise, using equation (2) (Liu et al., 2009).
where LEI = the landscape expansion index for newly grown patch,
AE = the area of minimum box Ap = the area of newly grown patch Ao = the existing urban patch
When the newly grown patch is rectangle,
ALe = the area of enlarged minimum box
ALo = the area the existing urban patch in enlarged minimum box.
LEI range in 0 ≤ LEI ≤ 100.
In contrast with conventional landscape indices, LEI contains information of the formation processes of landscape patterns. Since conventional landscape indices only reflect information for one particular temporal phase of landscape patterns, LEI can be used to analyze the dynamic changes of two or more tem-poral phases of landscape patterns.
Using land use and land cover change data in the study area from 1993 to 2006, the landscape expansion indices (LEI) are calculated in the four different periods. These indices and their threshold of different urban expansion types are then used to identify different urban expansion types.
3. RESULTS AND DISCUSSION
Based on LEI described in the previous section, this section presents the study results related to the identification of differ-ent types of urban expansions and expansion modes in differdiffer-ent time periods.
3.1 Urban Landscape Expansion Type
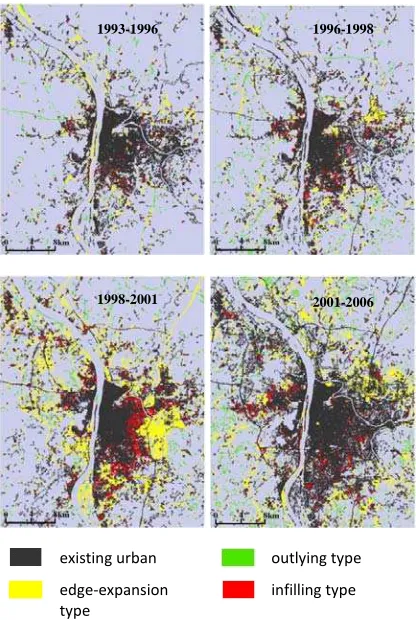
According to the landscape expansion index (LEI) value and threshold of different types of urban expansions, the distribution of urban expansion types are identified in the four different pe-riods from 1993 to 2006. The results are shown in Figure 1.
The results indicate that urban landscape expansion had been taking place in the study area from 1993 to 2006. Many non-urban lands were converted to non-urban uses. There were three types of urban expansions identified, i.e., infilling type, edge-expansion type and outlying type in the study area.
International Archives of the Photogrammetry, Remote Sensing and Spatial Information Sciences, Volume XXXIX-B7, 2012 XXII ISPRS Congress, 25 August – 01 September 2012, Melbourne, Australia
existing urban outlying type
edge‐expansion
type
infilling type
Figure 1. Distribution of urban expansion types in different pe-riods from 1993 to 2006
The areas and patch counts of different urban expansion types are calculated and showed in Figure 2 and 3. For each period, Figure 2 shows the percentage of area each urban expansion type takes, e.g., outlying type takes 31% of the total expansion area from 1996 to 1998, and Figure 3 shows the percentage of patch counts for each urban expansion type, e.g., patch count for edge-expansion type from 1993-1996 is 50% of the total ex-pansion patches.
According to the comparison of areas or patch counts of differ-ent urban expansion types (see Figure 2 and 3), the edge-expansion type was the main urban edge-expansion form. The change of proportion of urban expansion types of the study area over the study period reveal that urban expansion patterns had changed from a messy, dispersed early development phase to more compact and reasonable layout close to the end of the study period.
0 10 20 30 40 50 60 70 80
1 9 9 3 ~1 99 6 19 9 6 ~1 9 9 8 1 9 9 8 ~2 00 1 20 0 1 ~2 0 0 6
o u t l y i n g e d g e - ex p a n s i o n i n f i l l in g
Figure 2. Areas of three urban expansion types in different peri-ods
0 10 20 30 40 50 60
1993~1996 1996~1998 1998~2001 2001~2006
outlying edge-expansion infilling
Figure 3. Patch counts of three landscape expansion types in different periods
3.2 Urban Landscape Expansion Periods
The study results demonstrate that there were different urban expansion modes in four different periods. In the first period from 1993 to 1996, the edge-expansion and outlying types were both main urban expansion forms. During this period, the ur-banization reflected the characteristics of the early stage of rap-id urban developments. In the second period from 1996 to 1998, although edge-expansion type was still the main urban expan-sion form, the outlying type had been increasing rapidly, which indicates urban development is messy and dispersion. In the third period from 1998 to 2001, the edge-expansion and infil-ling type became the primary urban expansion forms. This peri-od was the proliferation phase in the rapid development of ur-banization. In the last period from 2001 to 2006, the edge-expansion and infilling remained the main urban edge-expansion forms, which indicate urban expansion was shifted towards compact development.
4. CONCLUSIONS
Quantitative studies of urban expansion forms help identify ferent types of urban expansions and expansion modes in dif-ferent time periods. This paper used landscape expansion indi-ces (LEI) to quantify the dynamic changes of urban landscape in a selected study area over 13 years, which resulted in the fol-lowing:
Urban expansion patterns changed from a messy, dispersed early development phase to more compact and reasonable layout from 1993 to 2006 in Changsha-Zhuzhou-Xiangtan metropolitan areas, Central China.
From 1993 to 1998, the dominant form of urban expansion in the study area was the edge-expansion type along with outly-ing type, which shows messy and dispersed developments.
From 1998-2006, the dominant form of urban expansion in the study area was the edge-expansion type along with infil-ling type, which indicate urban expansion was moving to-wards compact development.
China has experienced major urban developments from 1993 to 2006. The study results shows that the edge-expansion type of urban expansion has continuously contributed around 60% of the overall expansion, and the infilling type of expansion re-mained the same level and the outlying type of expansion slightly dropped. More meaningful interpretation of the study results may require further investigation of related urban devel-opment policies, laws and by-laws, as well as more analysis of the areas with the similar characteristics.
1993-1996 1996-1998
1998-2001 2001-2006
%
%
International Archives of the Photogrammetry, Remote Sensing and Spatial Information Sciences, Volume XXXIX-B7, 2012 XXII ISPRS Congress, 25 August – 01 September 2012, Melbourne, Australia
REFERENCES
Herold, M., Goldstein, N.C., & Clarke, K.C., 2003. The spatio-temporal form of urban growth: measurement, analysis and modeling. Remote Sensing Environment, 86(3), pp. 286-302.
Wilson, E.H., Hurd, J.D., Civco, D.L., Prisloe, M.P., & Arnold, C., 2003. Development of geospatial model to quantify, de-scribe and map urban growth. Remote Sensing Environment, 86(3), pp. 275-285.
Liu, X., Li, X., Chen, Y., Qin, Y., Li, S., & Chen, M., 2009. Landscape expansion index and its applications to quantitative analysis of urban expansion. Acta Geographica Sinica, 64(12), pp. 1430-1437
Luck, M., & Wu, J., 2002. A gradient analysis of urban land-scape pattern: a case study from the Phoenix metropolitan re-gion, Arizona, USA. Landscape Ecology, 17(4), pp. 327-339.
Seto, K.C., Woodcock, C.E., Song, C., Huang, X., Lu, J. & Kaufmann, R.K., 2002. Monitoring land-use change in the Pearl River Delta using Landsat TM. International Journal of Remote Sensing, 23, pp. 1985-2004.
Seto, K., & Fragkias, M., 2005. Quantifying spatiotemporal pat-terns of urban land-use change in four cities of China with time series landscape metrics. Landscape Ecology, 20(7), pp. 871-888.
UN Millennium Project., 2005. A Home in the City. Task Force on Improving the Lives of Slum Dwellers. http://www.unmillenniumproject.org/documents/Slumdwellers-complete.pdf (accessed 1 Apr 2012).
UNFPA., 2007. State of world population 2007: Unleashing the Potential of Urban Growth, United Nations Population Fund, Thoraya Ahmed Obaid, Executive Director. http://www.unfpa.org/swp/2007/presskit/pdf/sowp2007_eng.pdf (accessed 1 Apr 2012).
Xu, C., Liu, M., Zhang, C., An, S., Yu, W., & Chen, J., 2007. The spatiotemporal dynamics of rapid urban growth in the Nan-jing metropolitan region of China. Landscape Ecology, 22(6), pp. 925-937.
ACKNOWLEDGEMENTS
The research is supported by the National Science Foundation of China (No. 41171326 and No. 40771198) and the Hunan Provincial Natural Science Foundation of China (No. 08JJ6023).
International Archives of the Photogrammetry, Remote Sensing and Spatial Information Sciences, Volume XXXIX-B7, 2012 XXII ISPRS Congress, 25 August – 01 September 2012, Melbourne, Australia