REMOTE SENSING BASED BIOPHYSICAL CHARACTERIZATION OF TROPICAL
DECIDUOUS FOREST IN CENTRAL INDIA
R.P.Singh†1, Sheshakumar Goroshi1, N.K. Sharma2, G.D. Bairagi2, R. Sharma2, P. Jalil3, Avinash Jain4, Ajit Sonakia5 and J.S.Parihar1 (†rpsingh @sac.isro.gov.in)
1
Space Applications Centre (ISRO), Ahmedabad, India 2
MP Council of Science and Technology, Bhopal, India 3
State Forest Research Institute, Jabalpur, India 4
Tropical Forest Research Institute, Jabalpur, India 5
Madhya Pradesh Forest Department, India
KEYWORDS: Forest Ecosystem, Biophysical Parameter, Net Primary Productivity, Biomass, Phenology, Climate change ABSTRACT
The paper reports the measurements of biophysical parameters using field and satellite data over a tropical deciduous forest Kanha National Park (KNP), central India. Field measurement (GBH, LAI, litter, soil moisture) was carried out over ten quadrates of 0.1ha in KNP for characterization of biophysical parameters with specified measurement protocol and sampling. Satellite based remote sensing analysis (LAI, Phenology, and NPP) was carried out using multi date observations of IRS-LISS-III, IMS-1MX, SPOT-VEGETATION and EOS-MODIS instruments. Rank correlation analysis using field data collected in the selected quadrates at KNP showed Sal (Shorea robusta) is dominant forest species followed by Lendia, Jamun (Syzygium cumini), Saja, Harra and Dhawda etc. Field measurement of Sal showed GBH range from 20 cm to 170 cm. Different forest classes such as Sal; Sal mixed with Jamun, Bamboo (Dendrocalamus strictus) etc, including grasslands/scrubland were classified with overall accuracy of 85.56 percent using March, May and October multi spectral data. Sal has distinct growth characteristics (low vegetation growth/ leaf fall in March instead of May) as compared to other vegetation species. As per the Leaf Area Index (LAI) measurement using hemispherical photographs, Sal showed the highest LAI (6.95 m2/m2) during September and lowest LAI (2.63 m2/m2) during March. Overall good agreement (r= 0.79) was found between the LAI generated from LISS-III and MODIS data product. It was observed from SPOT-VEGETATION analysis that NPP varied from 8.4 tC/ha/year (dry deciduous forest) to 14.25 tC/ha/year (Moist deciduous forest) in KNP.
1. INTRODUCTION
Tropical deciduous forest plays an important role in governing energy, water and carbon exchange over tropics (Bonan et. al. 1992). It is generally known that forests have lower albedo, great-er net radiation and evapotranspiration as compared to grassland (Bonan 2008). Tropical forests represent ~ 25% of the carbon stock of terrestrial biosphere and uptake large amount of carbon annually. It is expected that these biospheric processes of energy and mass exchange would gives positive benefit that mitigate global warming through evaporative and carbon cooling and car-bon sequestration. Ravindranath et al. (2006) have reported that there can be shifts in forest types in India under different climate projections using BIOME4 model.
Complete understanding of forest atmosphere interaction requires observations on biophysical characteristics of different forest eco-system. Satellite remote sensing provides important input to ad-dress some of the issues concerning biophysical parameters but al-so needed validation of products from field measurements (Pandya et al. 2005). Recent development of network of automatic weather instruments is providing new dimension to research in forest me-teorology. Satellite based biophysical products such as land cover; LAI and phenology help in modeling the fluxes in forest using climate models at the different temporal and spatial scales. Satel-lite derived LAI has been incorporated into land surface models and demonstrated its importance in climate simulation. The paper reports the experimental details and salient finding of the forest
biophysical characterization and modeling experiment being car-ried out in Kanha National Park (KNP), Madhya Pradesh under the Energy and Mass Exchange in Vegetative System (EMEVS) project of ISRO-Geosphere and Biosphere Program, India.
2. STUDY AREA AND DATA USED
Study was carried out in Kanha National Park (KNP), Madhya Pradesh, India (Lat: 220 21’ 47.7’’, Long:800, 34’ 58.6’’). The KNP region (Fig. 1) has been the focus of numerous studies on vegetation type (Parihar et al., 1986; Roy et al. 1986) and biophys-ical characterization of vegetation such as phenology (Goroshi et al. 2010) and leaf area index (Goroshi et al. 2011). Study site was selected to assess the natural vegetation conditions in protected environment without much anthropogenic influence. The study area is located in sub humid region over central plains and consists of moist deciduous (Sal), dry deciduous forest (Lendia, Bamboo etc.) as well as grassland interspersed between the forest areas. The maximum temperature ranges from 29-400C and minimum temperature varies from 11-250C respectively. The highest monthly rainfall is observed in Sept. (650 mm) and the total an-nual rainfall is 1750 mm.
June. Ten quadrates of 0.1ha were selected for characterization of biophysical parameters (GBH, biomass, LAI, soil moisture, litter etc.) with specified measurement protocol and sampling.
Figure 1. Forest type map of Kanha National Park using IRS-LISS-III and IMS-1 MX data.
3. METHODOLOGY
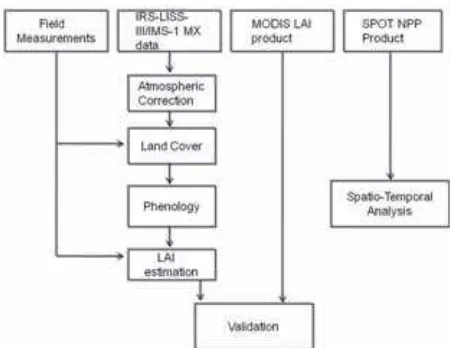
The study is based on field-based observations in selected qua-drates as well as analysis using multi source remote sensing data. Satellite based remote sensing analysis was carried out using multi date observations of IRS-LISS-III, IMS-1 MX, SPOT-VEGETATION and EOS-MODIS instruments. Atmospheric cor-rection was carried out for each IRS-LISS-III observation using MODTRAN based FLAASH model. Remote sensing analysis was mainly focused to map land cover type and model phenology, LAI and NPP of different forest types. Satellite data and different processing steps used in analysis is shown in Fig. 2
Figure 2. The satellite data and the processing steps used in remote sensing analysis.
3.1Forest Type Classification:
The pattern recognition technique such as Maximum likelihood classification was used to discriminate different forest types of KNP. Three date multi spectral data of IRS-LISS-III (28 March & 20 May) and IMS-1 MX (14 October) was used for classification.
The training site information was collected using extensive field surveys carried out in different seasons (March, July and October) with GPS locations.
3.2 Phenology:
The forest phenology was modeled using 13 IRS-LISS-III data collected for different months. The NDVI (NDVI= (N-R)/(N+R)) of different vegetation classes were calculated from atmospheri-cally corrected reflectance values of red (R) and NIR (N) bands of IRS-LISS-III data. A simple cosine function with time as inde-pendent variable and NDVI as deinde-pendent variable was used to model vegetation growth profile as given below:
Where NDVI (t) is modelled NDVI for each day of the year (t = 1 to 365 day, corresponding to the dates 1 January to 31 December) as estimated by the equation. a is seasonal amplitude for the cos wave, b is vertical shift, c is frequency, t is a time variable and d is the phase.
The coefficients were established using non-linear iterative fitting using Curve Expert 1.3 software. Detailed finding of this phenol-ogy work is reported by Goroshi et al. (2010).
3.3 Leaf Area Index (LAI):
The site specific forest LAI was measured using hemispherical photographs. Hemispherical photographs capture the light obstruc-tion/penetration patterns in the canopy, from which the canopy ar-chitecture and foliage area can be quantified (Chen et al., 1991; Fournier et al., 1996; Nilson, 1999). Hemispherical photographs have the advantage of spatial discrimination, and are particularly useful for acquiring foliage angular distributions, and gap fractions at different zenith and azimuthal angles. Gap fraction method is used to calculate LAI (Norman and Cambell, 1989). The transmit-ted radiation (T) of a beam of radiation in a canopy with randomly distributed elements is given by Beer-Lambert equation as
) 2 ( )
cos( * ) , ( exp )
( −−−−
−
=
i i ij
z PAI z
K z
T
α
Where
K
ijis the extinction coefficient at a zenith angle zi for class of leaves j with inclination angleα
.) 3 ( * + −−−−−
=C LAI WAI
PAI
PAI is the effective plant area index. C is Clumping factor, WAI is wood area index and LAI is leaf area index.
The empirical model was developed between the site specific NDVI and LAI estimated from hemispherical photographs. This empirical model was used further to estimate image level LAI over the KNP using satellite data acquired during different sea-sons. LAI measured from IRS-LISS-III was compared with the global product of MODIS 8 day composite gridded at 1 km spatial resolution during the synchronous observation dates.
Grassland/villages Misc. forest Mixed forest with Jamun Mixed forest with Bamboo Sal forest Mixed forest
)
1
(
)
cos(
)
3.4 NPP Modeling:
SPOT-VEGETATION NPP data composited at 10 days (1 km) (Chhabra and Dadhwal, 2004, Panigrahy et al.2004) was used to estimate annual NPP for major forest type of KNP. Following eq-uation represents the Production Efficiency Model (Kumar and Monteith 1981) used by SPOT VEGETATION group to estimate NPP of different terrestrial land cover types.
)
where S is the daily incoming global solar radiation (MJ/m2/d); c is the climatic efficiency 0.48, fAPAR is the fraction of adsorbed PAR estimated from RS based NDVI, ε is the photosynthetic
effi-ciency 1.10 (gC/MJ(APAR), p(T) is normalized temperature de-pendency factor (value between 0 and 1), and CO2 fert is norma-lized CO2 fertilization factor (dimensionless), and r is the fraction of assimilated photosynthates consumed by autotrophic respira-tion; modeled as simple linear function of daily mean air tempera-ture.
4. RESULTS AND DISCUSSION 4.1 Field Observations:
The dominant factors governing the forest type in KNP was ana-lyzed as soil moisture, organic carbon content and availability of percentage clay amount. Rank correlation analysis showed Sal is dominant forest species followed by Lendia, Jamun, Saja, Harra, Dhawda etc. GBH of Sal was found to vary from 20 cm to 170 cm. Soil moisture varied from 4 % (Sarhi site) to 15 % (Supkhar site) during March, 2010 in different sites. Inter site soil organic carbon (OC) ranges between 0.4 % (Mukki site) to 1.8 % (Bhaisan Ghat). Measured specific leaf area (g/cm2) varied from 0.007 to 0.012 for Sal and Tendu respectively. Above ground biomass of Sal trees of varying girth classes were used to develop allometric equation for quantification of carbon.
It was observed that Above Ground Biomass (AGB in kg) is re-lated with GBH (in cm) as:
This allometric equation was based on the experiment in Sal trees at Mawai forest range of west Mandla division, Madhya Pradesh, India.
4.2 Remote Sensing Data Analysis:
4.2.1 Forest Type Classification: Forest type classification for KNP was performed using cloud free IRS P6 LISS III (March, and May ) and IMX-1 MX (October) scenes. Each scene represents the different phenological phase of the deciduous forest. The over-all classification accuracy of 85.56 percent was observed in classi-fication of Sal; Sal mixed with Jamun, Bamboo etc, including grasslands/scrubland in Kanha . Figure 1 shows the forest type map of KNP and table 1 shows the confusion matrix of classifica-tion. Table 1: Confusion matrix showing percentage of correct classification among different forest type classes classified using IRS LISS III and IMS-1 MX data. (1:Sal, 2: Water, 3: Mixed forest, 4: Mixed forest with jamun association, 5: Mixed forest with bamboo association, 6: Miscallaneous forest and 7: Grassland represents the land cover types used in classification of KNP. Average classification, overall classification and Kappa Coefficient of the confusion matrix are 88.32%, 85.56% and 0.788 respectively.)
4.2.2 Biophysical Parameters: Distinct phenological patterns (Sal, Mix forest and Grassland) were observed. Sal has distinct growth characteristics as compared to other vegetation species. Sal has characteristic low vegetation growth (due to leaf fall) in March instead of May as compared to other vegetation species.
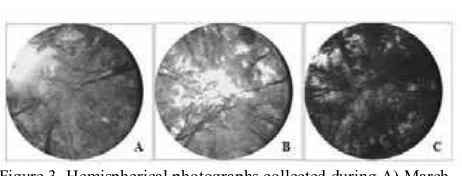
The forest LAI measured from hemispherical photographs (Supk-har site) was found to vary from 2.26, 3.42, and 6.63 in March, Ju-ly and October respectiveJu-ly. Forest LAI was estimated from anal-ysis of hemispherical photographs. Fig. 3. Shows the hemispherical photograph of sal forest used for estimation of gap fraction based LAI estimation. The spectral model developed us-ing field based LAI and IRS-LISS-III derived NDVI is as follows.
)
Figure 3. Hemispherical photographs collected during A) March, B) July and C) October of Sal in KNP.
Forest Type (Ö)
Sal
forest Mixed forest
Mixed forest with jamun
ýfo with bamboo
Miscellaneo
us forest Grassland
Month (Ø)
LAI (m2/
m2)
SD (m2/
m2)
LAI (m2/
m2)
SD (m2/
m2)
LAI (m2/
m2)
SD (m2/
m2)
LAI (m2/
m2)
SD (m2/
m2)
LAI (m2/
m2)
SD (m2/
m2)
LAI (m2/
m2)
SD (m2/
m2)
Jan 4.63 1.03 3.59 1.43 4.90 1.19 3.59 1.28 3.37 1.34 1.91 0.71 Feb 3.08 0.80 2.34 0.89 3.40 0.99 2.23 0.78 2.33 0.92 2.15 0.76 Mar 2.63 0.78 1.99 0.71 3.25 1.08 1.74 0.55 2.01 0.78 2.06 0.61 Apr 2.79 0.88 1.75 0.66 2.16 0.86 1.42 0.31 1.51 0.40 1.72 0.47 May 3.43 0.89 1.83 0.62 2.57 0.91 1.36 0.22 1.43 0.32 1.80 0.51 Jun 5.39 1.26 3.14 1.40 4.45 1.37 1.93 0.78 2.16 1.03 1.87 0.60
Jul+ 6.28 - 4.83 - 5.69 - 4.27 - 4.34 - 2.86 -
Aug+ 6.91 - 5.79 - 6.51 - 5.69 - 5.65 - 3.43 -
Sept+ 6.95 - 6.10 - 6.75 - 6.30 - 6.14 - 3.61 -
Oct 6.40 1.38 5.85 1.49 6.38 1.61 6.16 0.96 5.94 0.89 3.45 1.14
Nov+ 5.34 - 4.77 - 5.51 - 5.06 - 4.77 - 2.81 -
Dec 3.34 0.72 2.72 0.91 3.70 0.88 2.76 0.87 2.42 0.76 1.60 0.43
Table 2. Temporal variability of LAI in tropical deciduous forest species, retrieved from LISS III data (+ Fitted LAI values, SD: Standard
Deviation)
S.NO Forest Type NPP (t/ha/yr) SD (t/ha/yr)
1 Sal forest 14.26 0.55
2 Mixed Forest 13.39 0.53
3 Mixed Forest with Jamun 11.92 0.51
4 Mixed Forest with bamboo 10.07 0.49
5 Misc. forest 8.40 0.40
6 Grassland 10.31 0.50
Table 3: The NPP of different forest types of Kanha National Park estimated using SPOT-Vegetation data
It was observed from SPOT-VEGETATION analysis that NPP va-ried from 8.4 tC/ha/year (Dry deciduous) to 14.25 tC/ha/year (Moist deciduous) in KNP. The Singh and Singh, 1991 have re-ported 8.15 t/ha net above ground primary production (ANP) for dry deciduous forest ecosystem in India by field measurements. Similarly, Singh and Singh, 1989 have reported 12.9 t/ha ANP for Sal forest type. The estimated NPP in present study for the deci-duous forest and Sal forest type is broadly in agreement to above reported field studies. Recent remote sensing based study using SPOT VEGETATION NPP product reported that, total net C fixa-tion of India was estimated as 2.18 PgC, which amounts to area-weighted terrestrial NPP of 6.66 tCha–1 yr–1 for the period June 1998–May 1999 (Chhabra and Dhadwal, 2004). Similarly, long term study using NOAA AVHHRR NPP product (Singh et al. 2011) reported that, net carbon fixation over Indian landmass ranged from 3.56 PgC (in 1983) to 4.57 PgC (in 1998). Table 3. shows the forest type wise estimation of annual NPP in KNP. There is need to assimilate these observed biophysical parameters in modeling processes involved in energy and mass exchange in forest ecosystem.
4. CONCLUSION AND FUTURE DIRECTION Spatial distribution of the forest type (Sal dominant) is primarily due to variations in soil moisture variability, organic carbon con-tent and percentage of clay. It was observed that classification
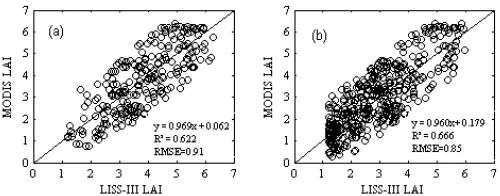
us-ing three dates (in March, May and October) which captures the distinct phonological pattern of forest growth helped in discrimi-nation of forest types with accuracy 85.56 percent. The study vali-dated (r = 0.79, RMSE=0.91) most popular and freely available MODIS LAI product (Ver. 4) in forest-dominated ecosystem of central India. Study demonstrates the approaches and potential of remote sensing observation for biophysical parameter estimation in forest ecosystem. Phenological observations and monthly LAI values generated from remote sensing analysis will be useful in modelling hydrological as well as carbon cycle in forests of cen-tral India.
Figure 4. Inter comparison of IRS-LISS-III derived LAI with MODIS LAI product in KNP over (a) Sal forest and (b) mixed
REFERENCES
Bonan, G. B., 2008. Forest and Climate Chane: Forcings, Feedbacks, and the Climate Benefits of Forest, Science 320, p. 1444.
Bonan, G. B., Pollard, D. and Thompson, S. L.,1992. Effect of boreal forest vegetation on global climate. Nature, 359, 716–718. Chen, J.M., Black, T.A., Adams, R.S., 1991. Evaluation of hemispherical photography for determining plant area index and geometry of a forest stand. Agric. Forest Meteorol. 56, 129–143. Chhabra, A., & Dadhwal, V. K. 2004. Estimating terrestrial net primary productivity over India using satellite data. Current Science, 86(2), 269.
Fournier, R.A., Landry, R., August, N.M., Fedosejevs, G., Gauthier,R.P., 1996. Modelling light obstruction in three conifer forests using hemispherical photography and fine tree architecture. Agric.Forest Meteorol. 82, 47–72.
Goroshi, S. K., Singh, R. P., Guptha, P. K., Sharma, N., Sharma, R., Nagar, A. K., Negi, H. S., Sonakia, Ajit and Parihar, J. S. 2010. Monitoring vegetation phenology using IRS P6-LISS-III sensor data. Scientific Report, Space Applications Centre, Ahmedabad, SAC/EPSA/ABHG/IGBP-EMEVS/SR/02/2010. Goroshi, S. K., Singh, R. P., Sharma, N., Sharma, R., Bairagi, G.D., Nagar, A. K., Negi, H. S., Sonakia, Ajit and Parihar, J. S., 2011. Estimation of LAI Using Remote sensing Observation and Hemispherical Photograph over Tropical Deciduous Forest in Central India. Scientific Report, SAC/ABHG/IGBP-EMEVS/SR/04/2011.
Kumar, M and Monteith, J. L.1981. Remote sensing of crop growth In: H. Smith {ed.}, plants and the daylight spectrum academic Press, London, pp. 133-144.
Nilson, T., 1999. Inversion of gap frequency data in forest stands.Agric. Forest Meteorol. 98–99, 437-448.
Norman, J. M., Campbell, G. S., 1989. Canopy structure. In: Pearcy, R. W., Ehlesinger, J., Mooney, H. A., Rundel, P. W. (Eds.), Plant physiological Ecology. Field Methods and Instrumentation. Chapman and Hall, London, pp. 301-325. Pandya M.R., Singh R.P., Chaudhari K.N., Sharma R., Bairagi G. D., Dadhwal V.K., Parihar J.S., 2006. Leaf area index retrieval using IRS LISS-III sensor data and validation of MODIS LAI product over India, IEEE Trans. Geosci. Remote Sensing, 44 (7),1858-1865.
Panigrahy, R. K., Panigrahy, S., Parihar, J. S. (2004). Spatiotemporal pattern of agro ecosystem net primary productivity of India: A preliminary analysis using SPOT VGT data. Int. Symp. on Geospatial Databases for Sustainable Development, Goa 36(4): pp. 724–729.
Parihar, J. S., Battacharya, B. K., Singh, R. P., Goroshi, S. K and Panigrahy, S. (2010). Site characteristics of network of INSAT linked agro-met station (AMS) for micrometeorological measurements in India. Scientific Report, Space Applications Centre, Ahmedabad, SAC/EPSA/ABHG/IGBP-EMEVS/SR/01/2010.
Parihar, J.S., Kotwal, P.C., Panigrahy, S., and Chaturvedi, N. 1986. Study of wildlife habitat using high resolution space photographs : A case study of Kanha National Parks. ISRO Special Publication, ISRO-SP-17-86, SAC, Ahmedabad
Ravindranath, N. H., Joshi, N. V., Sukumar, R and Saxena, A., 2006. Impact of climate change on forests in India. Current Science, 90, No. 3, 10 February 2006.
Roy, P.S., Saxena, K.G., Pant, D.N., Kotwal, P.C. 1986. Analysis of vegetation types using remote sensing techniques for wildlife evaluation in Kanha National Park. 22 Proc. Seminar-cum-Workshop, Wildlife Habitat Evaluation using Remote Sensing Techniques, 22-23 October, 1986, Dehradun, pp. 83-116
Singh, L. and Singh, J. S. 1991. Species structure, dry matter dynamics and carbon flux of a dry tropical forest in India. Annals of Botany 68:263-273.
Singh, R. P., Rovshan, S., Goroshi, S. K., Panigrahy, S., Parihar, J. S., 2011. Spatial and Temporal Variability of Net Primary Productivity (NPP) over Terrestrial Biosphere of India Using NOAA-A VHRR Based GloPEM Model. J. Indian Soc. Remote Sensing. Published online (DOI 10.1007/s12524-011-0123-1).
Singh, S. P and Singh, J. S., 1989. Ecology of central Himalayan forests with special reference to sal forest ecosystem. In: Perspectives in Ecology, Singh, J.S. and Gopal, B. (eds.). Jagmander Book Agency, New Delhi. pp. 193-232.
ACKNOWLEDGMENT