COMPARISON OF DISCRETE RETURN AND WAVEFORM TERRESTRIAL LASER
SCANNING FOR DENSE VEGETATION FILTERING
A. Guarnieri, F. Pirotti, A. Vettore
CIRGEO-– Interdepartment Research Center for Geomatics, University of Padova, viale dell’Università 16, 35020 Legnaro (PD), Italy - [email protected]
Commission VII/ WG7
KEY WORDS: Terrestrial Laser Scanner, DTM, full-waveform, analysis, vegetation filtering, multi-target capability.
ABSTRACT
In this paper we present the results of the comparison between two terrestrial laser scanners (TLS), a discrete return system (Riegl LMS-Z620) and an echo-digitizing system (Riegl VZ-400), employed for the survey of a dense forested area, in the italian Alps. The site is actually undergoing a strong debate among the inhabitants and local government authorities about the exploitation of the area as a huge quarry to produce building material. The dispute originates from the uncertainty about the instability of the underlying mountain slope, which was interested in 1966 by a landslide. The whole area was surveyed with the two laser scanners on February 2011 during the vegetation dormant period. A slight different processing workflow was applied to the collected datasets: the VZ-400 scans were pre-filtered by exploiting the “calibrated relative reflectance” readings and the multi-target capability provided by this laser scanning system. Next, two different spatial filters were applied to both the resulting georeferenced 3D models, in order to eliminate as much vegetation as possible: iterative filter and a custom morphological filter, developed by the authors. Achieved results show that for both datasets, the iterative and the morphological filters perform quite well for eliminating the vegetation, though some manual editing is still required since vegetation does not feature a prevalent growing direction. Furthermore, the comparison between the number of points left in the final DTMs shows that the VZ-400 provided a one order of magnitude denser point cloud wrt. the LMS-Z620. This demonstrates that a TLS with multi-target capability can potentially provide a more detailed DTM even in presence of dense vegetation.
1. INTRODUCTION
Distinguishing vegetation characteristics in a terrestrial laser scanner dataset is an interesting issue for environmental assessment. Most of the methods developed so far for discriminating between ground and off-ground points have been applied to datasets derived from airborne laser scanner (ALS), while minor interest has been shown towards the application to terrestrial laser scanners (TLS). The extraction of an accurate digital terrain model (DTM), digital surface model (DSM), as well as correct information on vegetation density and height, is a challenging task which calls for consideration on some significant aspects. For example, in densely vegetated areas the obstruction of the laser beam is particularly relevant, as well as the rapid drop of point density as the distance from the laser sensor increases. For these reasons, different issues, with respect to ALS applications, must be taken into account in the development of methods for the processing of TLS data acquired in these natural environments. An overview of ground filtering methods which have been applied to aerial laser scanner point clouds is presented in (Maas, 2010) and can be divided in three main groups: one based on mathematical morphology, one on progressive densification of a triangle mesh, and another on linear prediction and hierarchic robust interpolation. The first group derives from the work of (Haralick and Shapiro, 1992) which propose erosion e and dilation d filters in succession either for opening d → e or closing e → d operations. The second group of filters is well represented by Axelsson’s algorithm (Axelsson, 2000) based on the progressive densification of a triangular mesh. The initial triangle network is created using a set of local minima
points over an area of user-defined size; points are then added using a criteria on the new triangle slope. The last group is based on the method proposed by (Kraus and Pfeifer, 2001) where a surface model is defined using linear prediction and hierarchic robust interpolation.
In recent years the Riegl company has developed a new line of terrestrial laser scanners (VZ-series), based on pulsed Time-Of-Flight (TOF) technology, providing some interesting features which may help to solve the problem of generating reliable DTMs in forested areas. Indeed, these instruments provide real time echo digitization and online waveform processing, thus combining the advantages of analogue detection systems (immediate results wihtout the need for post-processing) with those of airborne echo digitizing systems (multi-target capability).
In this paper we present the results of the application of two filters, related to the first and second class of methods mentioned above, for the removal of the vegetation present in the datasets acquired with two terrestrial laser scanners in a dense forested area, in the italian Alps. The employed laser scanners are both based on pulsed TOF technology but they adopt different measurement recording approaches: analogue discrete return (Riegl LMS-Z620) and echo-digitizing caability (Riegl VZ-400).
2. STUDY SITE AND DATA ACQUISITION
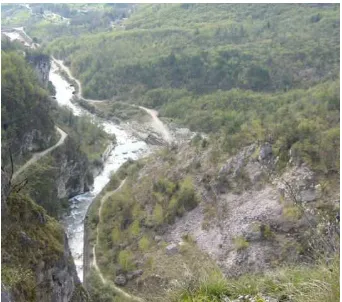
The study site (Figure 1) is located on the slope of the Brustolè mount, in front of the small town of Arsiero (Vicenza, northern Italy). This site is actually undergoing a strong debate among the inhabitants and local government authorities about the exploitation of the area as a huge quarry to produce building material. The dispute originates from the uncertainty about the instability of the underlying mountain slope, which was interested in 1966 by a landslide. After this event, the area has been continuously monitored by measuring the dynamics of terrain displacements. The landslide covers approximately a surface of 600000 m2, with an extent of around 400 m in vertical direction and 1 km in the horizontal direction, at the bottom of the slope. Elevation ranges from 350 to 750 m a.s.l. The main sliding surface is located at a depth of 20 m at the top and at the bottom of the landslide body, while it reaches a depth of 100 m in its central part. The volume of material involved in the event of 1966 was estimated to be around 20-30 millions of cubic meters (Bitelli et al., 2009).
Figure1: Multi-scale views of the study area.
Figure 2: View of the bottom side of the landslide.
In order to perform a 3D simulation of the morphological changes the site may undergo during the excavation of the quarry, on February 2011 the entire area was surveyed with a long-range TLS, the Riegl LMS-Z620. After a few weeks, still during the vegetation dormant period, a second survey was carried out with a full-waveform system, the Riegl VZ-400. Due to time constraints and the limited operational range
of this laser scanner (max. 600 m), only the lower part of the landlside body could be surveyed, where coppice and high forest alternates with rocks and cliffs. The presence of dense vegetation, ranging from low understore to high trees, added complexity to the scan of the area as it covered multiple strata above the ground (Figure 2). Tables 1 and 2 show the main technical features of the LMS-Z620 and of the VZ-400 laser scanners, respectively, while table 3 reports some properties of the scans acquired with both instruments.
Table 1: Technical specifications of the Riegl LMS –Z620
Table 2: Technical specifications of the Riegl VZ-400
Table 3: Some properties of acquired laser scans
LMS-Z620 VZ-400
# of scans 7 3
Average meas.
per scan 3400000 15300000
Max. range 900 m 350 m
Average scan resolution
0.5 mrad
(≅ 25 cm @ 500 m) 0.5 mrad
3. SCAN REGISTRATION AND GEOREFERENCING
furtherly refined by applying the Multi Station Adjustment (MSA) procedure, a variant of the ICP (Iterative Closets Point) algorithm implemented in Riegl’s RiscanPro companion software. This algorithm performs an initial fitting of a set of planes in the point clouds and then tries to align them by finding the best corresponding planes.
Because of the very large number of measurements acquired with the Riegl VZ-400, merging and managing together both full laser datasets revealed to be unfeasible. Therefore the data analysis and comparison between the two laser scanners were restricted to a limited area of the landslide, shown on the right side of figure 2. To this aim a specific procedure was adopted to merge together the corresponding scans. In a first step the global registration was applied separately to Riegl for both laser scanners (10 mm for the Z620 and 5 mm for the VZ-400). However it should be noted that the scans were aligned prior to filter the vegetation, whose presence may have therefore affected the fitting of planes and the serach for correct correspondences between the scans during the MSA procedure.
4. WAVEFORM PROCESSING IN TLS
Conventional terrestrial laser scanners based on the Time-Of-Flight measurement principle characterize as analog discrete return systems (Ullrich and Pfennigbauer, 2011). For each emitted pulse, target detection and time-of-arrival (TOA) estimation of the returned pulse are performed in real time through analog devices. Regardless the various estimation methods adopted, the resulting value of the TOA is affected by trigger walk, i.e. by the amplitude of the target signal detected by the receiver frontend. In presence of multiple targets along the laser beam axis, analog estimators can yield significant range errors for the second and further targets or completely fail to detect them, depending on the temporal separation between consecutive target echoes with respect to the emitted pulse width. In contrast to a discrete return systems, in an echo-digitizing system returned signals are sampled at high rate and converted in a digital form prior to perform the target detection. All subsequent processing steps are executed in the digital domain on-line or in post-processing. The latter approach is typically adopted in airborne LiDAR systems where sample data are stored in specific high capacity data recorders (Ullrich and Reichert, 2005). Applying the full-waveform analysis (FWA) to these data enables to acquire additional information with respect to conventional discrete return laser systems.
Beside range measurements, resulting from echo detection and estimation of related TOA, backscattering properties of the targets can be retrieved as well, such as the amplitude of echo signal, which provides an estimate of target’s laser cross-section, and the pulse width, that represents a measure of the backscatter profile of the target along the laser beam. As mentioned in (Ullrich and Pfennigbauer, 2011), the different approaches proposed so far to extract the target backscattering properties from digitized returned signals can be grouped into two main classes: deconvolution based methods (Roncat et al., 2011) and procedures based on the
modeling of digitized waveform with basic functions (Wagner et al., 2006; Roncat et al., 2008). An example of the latter approach used for FWA is represented by the Gaussian decomposition. This method relies on the assumption that the system response can be modeled with a Gaussian function and that all the contributions of the backscattering targets are also Gaussian. Echo detection is therefore performed by finding Gaussian pulses in the returned waveform. Such approach has been implemented in RiANALYZE, the Riegl software dedicated to the FWA of echo-digittizing systems.
In recent years the Riegl company has developed a new line of terrestrial laser scanners (VZ-series) providing a different approach to FWA. In contrast to Airborne Laser Scanning (ALS) systems, where digitized echo signals are stored during the flight for subsequent post-processing, the lack of computational power for real-time processing and the need to immediately analyze the received signals, has led Riegl to implement an online waveform processing for the VZ-line products. Basically, upon echo pulse reception a highly accurate estimate of its amplitude and TOA is performed in real-time. Through hardware-oriented implementation of the processing algorithm, a VZ-series laser scanner is able to perform about 1.5 million range and amplitude measurements per second. As denoted in table 2, given a laser pulse repetition rate of 100 kHz (42000 measurements per second in long range mode) and 300 kHz (125000 measurements per second in high speed mode), the Riegl VZ-400 laser scanner can record 10 or 5 targets per laser shot, respectively (Doneus et al., 2009). Similarly to ALS-based echo-digitizing systems, the Riegl’s VZ-series instruments provide some additional and very interesting features with respect to the conventional analog discrete return-based terrestrial laser scanners, as briefly described in the following subsections.
4.1 Multi-target capability
As previously mentioned, thanks to the adoption of online waveform processing, the VZ-400 laser scanner can record multiple echoes for each emitted laser pulse. However, the capability to correctly discriminate two consecutive echoes is determined by the laser’s pulse width and the receiver bandwidth: for the Riegl’s VZ-line laser scanners the multi-target resolution (MTR) distance is about 0.8 m. Echo pulses separated by shorter distances between scatterers within the same laser shot cannot be distinguished as the corresponding echo signals are overimposed. Consequently, the measured range will be estimated somewhere in between the targets, thus resulting in an erroneus point.
4.2 Calibrated amplitude reading
Beside geometrical information, the VZ-line additionally delivers a calibrated amplitude information for each target echo, which can be used to improve the object classification. The amplitude reading is defined as the ratio of the actual detected optical amplitude of the echo pulse versus detection threshold (eq. 1). The ratio is stated in decibels (dB).
10 log
echo dBthr
P
A
P
= ⋅
(1)
where
AdB = calibrated amplitude [dB] Pecho = echo signal power [W] Pthr = power detection limit [W]
4.3 Calibrated reflectance reading
With the VZ-series of laser scanners, Riegl has introduced some measure of the laser radar cross-section by providing a reflectivity value for each target echo. The reflectivity value gives the ratio of the actual optical amplitude versus the optical amplitude of a diffuse white target located at the same range (it is furtherly assumed that the white target is larger than the laser footprint, 100% reflecting, flat, and its surface is orthogonal to the laser beam). The value is again given in dB (eq. 2).
ρ
rel(
R
T)
=
A
dB(
R
T)
−
A
dB White,(
R
T)
(2)where
RT = target T range [m]
ρrel,(RT) = calibrated reflectance of target T at range RT AdB,T = calibrated amplitude of T at range RT [dB] AdB,White = amplitude of white target T at range RT [dB]
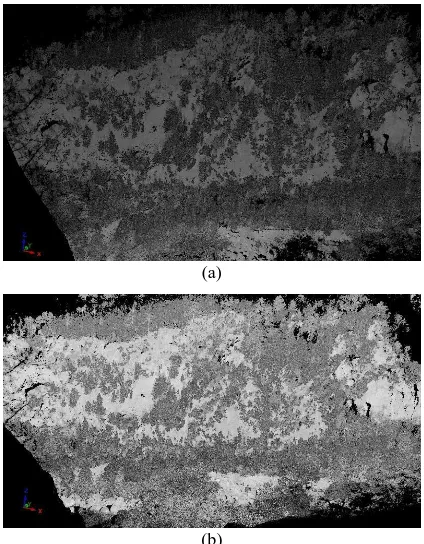
White diffuse targets would have assigned about 0 dB, while black paper with a reflectance of 10% would give about -10 dB. Reflectivity values above 0 dB indicate that the target returns an optical echo amplitude larger than those of a diffuse white target, i.e., the target is (partially) retro-reflecting. By assigning a brightness value to each point of a point cloud according to the reflectivity, objects with the same reflectivity will have the same brightness regardless of the distance to the scanner. Note that this applies only to single and first targets, not for the succeedings ones located along the laser beam axis. Indeed, except for single and first targets, the response of each subsequent target hit by the laser beam is a combination of the respective laser radar cross section and of the attenuation of the laser pulse due to the preceding targets. Since this target-induced attenuation cannot be retrieved from the amplitude of the backscattered pulse, actually the calibrated reflectance readings are representative of the backscattering properties of just the single or first targets acquired by a multi-echo digitizing system. An example of calibrated amplitude and calibrated reflectance is shown in figures 3(a) and 3(b), while a small portion of a VZ-400 scan coloured according to the recorded multiple echoes is displayed in figure 4.
(a)
(b)
Figure 3: Front view of the test area rendered according to the calibrated amplitude (a) and the calibrated reflectance (b).
Figure 4: Side view of a small portion of the landslide surveyed with the Riegl VZ-400 laser scanner. Green color denotes single targets, yellow first targets, light blue intermediate targets and blue last targets.
5. VEGETATION FILTERING
based on the calibrated reflectance was applied to single, first and last echoes. Though the use of the calibrated reflectance allowed to strongly reduce the number of points, some vegetation elements, like trunks, could not be completely removed as they showed reflectance values similar to those of ground points. An example of the results of this kind of filtering is shown in figure 5, where the red points represent single and first targets filtered out by applying a reflectance threshold of -6 dB. A lower threshold (-8 dB) was set for the group of last echoes because the reflectance values of vegetation elements resulted to be more similar to that of ground points. As discussed in previous section, this is due to the attenuation effect that preceding targets produce on the emitted laser pulse, so that reflectance values recorded for the last echoes are not range independent and do not actually represent the backscattering properties of corresponding targets. For each class of echoes, the reflectance thresholds were determined empirically through the analysis of the reflectance distribution plot provided by RiscanPro software and by checking the reflectance value of some points (clearly recognized as vegetation and ground) manually picked in the 3D view of the test area.
Figure 5: Example of vegetation filtering based on the calibrated reflectance.
After the pre-filtering of VZ-400 laser data, the same processing steps were applied to the datasets derived by both instruments. Two different spatial filters were then applied to the corresponding 3D models, in order to eliminate as much vegetation as possible: an iterative filter (Axelsson, 2000) originally developed for the filtering of ALS data, and a custom morphological filter, developed by the authors for the mapping and quantification of vegetation in forested areas (Pirotti et al., 2011).
In the iterative the original point cloud S is firstly projected on a reference plane pi and then rasterized on a regular grid by selecting the point with minimum laser elevation (Z axis orthogonal to the plane). Next S is compared with the obtained DEM and only the points closer than a distance threshold are preserved. This process is repeated iteratively by reducing at each step the size of both the grid cell and the threshold, until the vegetation is completely removed. In the morphological filter three main group of parameters are derived from a dataset acquired with an echo-digitizing system: spatial coordinates of measured points, amplitude and ordinal number of return signal. These two features are used in the first two steps of the algorithm in order to extraxt candidate ground points from the original point cloud. A threshold is applied to the amplitude data recorded with the laser measurements. Such threshold is determined by the first value of the last quartile of the cumulative distribution function of the amplitude values. In a second step, a custom
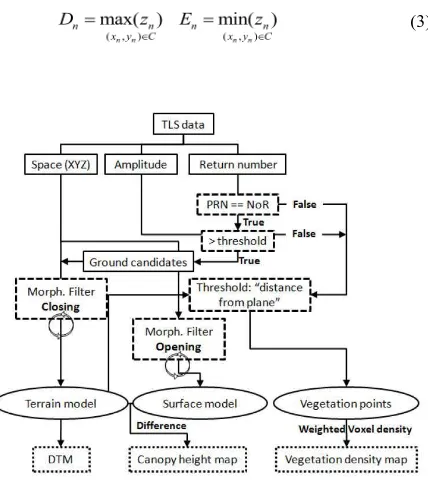
morphological filter (Haralick and Shapiro, 1992), composed by erosion (E) and dilation (D) operators, is applied to maximum and minimum laser elevations falling inside a regular grid (eq. 3). By iteratively decreasing the cell size C of the grid, a set of DTMs are obtained until the vegetation is almost completely removed. The conceptual workflow of this algorithm is shown in figure 6.
(3)
Figure 6: Workflow of the morphological filter; PRN is denotes the point return number, while NoR the total number of returns.
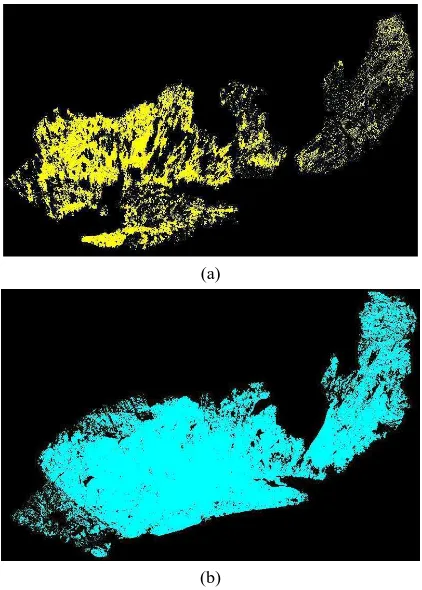
Numerical results of the application of the iterative and of the morphological filters for the vegetation removal are presented in table 4, while the final filtered point clouds derived from the Riegl LMS-Z620 and VZ-400 laser scanners are shown in figures 7a and 7b, respectively. Note that the numerical values shown in table 4 were rounded to the most significative digit for clarity sake.
Table 4: Results of the filtering of the Riegl LMS-Z260 and Riegl VZ-400 datasets.
LMS-Z620 VZ-400
# of initial points 2500000 12200000
# of points after multi-
target filtering N/A 10750000
# of points after filtering based on calibrated reflectance
N/A 6230000
# of points left after
iterative filtering 400000 3020000
# of points left after
(a)
(b)
Figure 7: Point clouds resulting after the removal of the vegetation through the morphological filter. LMS- Z620 dataset (a), VZ-400 dataset (b).
5. CONCLUSIONS
Achieved results show that for both datasets, the iterative and the morphological filters perform quite well for eliminating the vegetation, though some manual editing is still required since vegetation does not feature a prevalent growing direction. Furthermore, the comparison between the number of the laser returns left in the final DTMs shows that the VZ-400 provided a one order of magnitude denser point cloud wrt. the LMS-Z620. This demonstrates that a TLS with multi-target capability can potentially provide a more detailed DTM even in presence of very dense vegetation, as in the case of the Brustolè landslide area. The use of the calibrated reflectance revealed to be quite effective to reduce the number of off-ground points in the pre-filtering stage. However the selection of the more suited threshold values was quite difficult as it was based on empirical and manual methods. This applies overall in the case of the last echoes where the attenuation effect of preceding targets makes the calibrated reflectance values of that echoes still range dependent, so that ground and off-graound points tend to assume more similar reflectance values. It is authors opinion that in order to improve the potential of this additional information for object classification more sophisticated analysis tools should be developed.
ACKNOWLEDGEMENTS
Authors wish to thank prof. Gabriele Bitelli and his research team of the Department of Civil, Environmental and Materials Engineering (DICAM) of the University of
Bologna (Italy) for the provision of the Riegl VZ-400 laser scanner and the technical support given during the survey.
REFERENCES
Axelsson, P., 1999. Processing of laser scanner data algorithms and applications. In: ISPRS Journal of
Photogrammetry & Remote Sensing, vol. 54, pp. 138-147.
Bitelli, G., Gatta, G., Landuzzi, A., Vittuari, L., Zanutta, A., 2009. La fotogrammetria digitale di archivio per lo studio multitemporale di un’area in frana nelle Prealpi vicentine. In:
Proceedings of the 13th Italian National Conference ASITA,
Bari, Italy.
Doneus, M., Pfennigbauer, M., Studnicka, N., Ullrich, A., 2009. Terrestrial waveform laser scanning for documentation of cultural heritage. In: Proceedings of the XXIIth CIPA Symposium, Kyoto, Japan.
Haralick, R.M., Shapiro, L.G., 1992. Computer and Robot Vision. Addison-Wesley, Longman Publishing Co. Inc., Boston, MA, USA.
Kraus, K., Pfeifer, N., 2001. Advanced DTM generation from LiDAR data. In: The International Archives of Photogrammetry and Remote Sensing, 34(3/W4) , pp. 23–30.
Maas, H.G., 2010. Foresty Applications. In: Airborne and
terrestrial laser scanning. Vosselman, G., Maas, H.G. Eds.,
Whittles Publishing, UK.
Pirotti, F., Guarnieri, A, Vettore, A., 2011. Vegetation
Characteristics Using Multi-Return Terrestrial Laser Scanner. In: Laser Scanning 2011, 7th ISPRS Workshop,
Calgary, Canada, 29-31 August 2011.
Roncat, A., Wagner, W., Melzer, T., Ullrich, A., 2008. Echo detection and localization in full-waveform airborne laser scanner data using the averaged square difference function estimator. In: The Photogrammetric Journal of Finland, 21 (1), pp. 62-75.
Roncat, A., Bergauer, G., Pfeifer, N., 2011. B-spline deconvolution for differential target cross-section determination in full-waveform laser scanning data. In:
ISPRS Journal of Photogrammetry and Remote Sensing, vol.
66, pp. 418-428.
Ullrich, A., Reichert, R., 2005. High resolution laser scanner with waveform digitization for subsequent full waveform analysis. In: SPIE Laser Radar Technology and Applications
X, Orlando, Florida, USA, pp. 82-88.
Ullrich, A., Pfennigbauer, M., 2011. Echo digitization and waveform analysis in airborne and terrestrial laser scanning. In: Photogrammetric Week 2011, Dieter Fritsch Ed., Stuttgart, Germany
Wagner, W., Ullrich, A., Ducic, V., Melzer, T., Studnicka, N., 2006. Gaussian decomposition and calibration of a novel small-footprint full-waveform digitising airborne laser scanner. In: ISPRS Journal of Photogrammetry and Remote