C. Stentoumis a, E. Protopapadakis b, A. Doulamis a, N. Doulamis a
a Lab. of Photogrammetry, Dept. of Surveying Engineering, National Technical University of Athens, 15780 Athens, Greece - (cstent, ndoulam, adoulam)@mail.ntua.gr
b Institute of Communication and Computer Systems, Zografou 157 80, Athens, Greece. – [email protected]
Commission V, WG V/1
KEY WORDS: Cracks, Inspection, Automation, Deep Learning, Recognition, Matching, Reconstruction
ABSTRACT:
In this work, it is examined the 2D recognition and 3D modelling of concrete tunnel cracks, through visual cues. At the time being, the structural integrity inspection of large-scale infrastructures is mainly performed through visual observations by human inspectors, who identify structural defects, rate them and, then, categorize their severity. The described approach targets at minimum human intervention, for autonomous inspection of civil infrastructures. The shortfalls of existing approaches in crack assessment are being addressed by proposing a novel detection scheme. Although efforts have been made in the field, synergies among proposed techniques are still missing. The holistic approach of this paper exploits the state of the art techniques of pattern recognition and stereo-matching, in order to build accurate 3D crack models. The innovation lies in the hybrid approach for the CNN detector initialization, and the use of the modified census transformation for stereo matching along with a binary fusion of two state-of-the-art optimization schemes. The described approach manages to deal with images of harsh radiometry, along with severe radiometric differences in the stereo pair. The effectiveness of this workflow is evaluated on a real dataset gathered in highway and railway tunnels. What is promising is that the computer vision workflow described in this work can be transferred, with adaptations of course, to other infrastructure such as pipelines, bridges and large industrial facilities that are in the need of continuous state assessment during their operational life cycle.
1. INTRODUCTION
At the time being, the structural integrity inspection of large-scale infrastructures is mainly performed through visual observations by human inspectors, who identify structural defects, rate them and, then, categorize their severity. This visual inspection (VI) process is slow, labour intensive and subjective (i.e. depending on the experience and fatigue). Generally, it is carried out in spiteful environments and under rather uncomfortable condi-tions. Moreover, the evaluation of infrastructure’s health is empirical, incomplete and lacks any engineering analysis; it is therefore, hard to integrate it in a trustworthy and automated spatio-temporal monitoring procedure. One should add here that the cost of new tunnel construction is very high and, thus, inspection, assessment and repair of the existing infrastructure is of utmost importance. Also, the inspection and assessment should be speedy in order to minimize tunnel closures or partial closures.
In this work, an automatic procedure based on computer vision is described and the results on images grabbed in an actual tunnel are presented. What is interesting is that the computer vision workflow described in this work can be transferred, with adaptations of course, to other infrastructure such as pipelines, bridges and large industrial facilities that are in the need of continuous state assessment during their operational life cycle. Approaches that utilize automated procedures for VI of concrete infrastructures aim specifically to the detection of defects and structure evaluation, often in the content of BIM (building information modelling). Towards this direction, such methods exploit image processing and machine learning techniques. Some automated approaches have already been tested in real life scenarios including roads, bridges, fatigues, and sewer pipes
(Kim and Haas, 2000; Pynn et al., 1999; Sinha and Fieguth, 2006; Tung et al., 2002; Yu et al., 2007).
1.1 Related Work
(Jahanshahi et al., 2013) for crack detection and quantification. The constructed features are fed as input to ANN or SVM classifiers in order to discriminate crack from non-crack patterns. Regarding the 3D modelling of high fidelity surfaces, (Stent et al., 2013) reconstruct the lining of a tunnel based on the prior knowledge of tunnel geometry. This model is then updated by new images in order to detect changes and defects. In principle, 3D modelling is rapidly becoming a mainstream and mature technology, but its effectiveness usually demands multi-view imaging and/or constrained environments. Successfully modelling infrastructure for inspection can include stereo imaging and projected patterns and terrestrial laser scanners (Yoon et al., 2009). Unfortunately, not much have been done on among proposed techniques are still missing. The holistic approach of this paper exploits the state of the art techniques of pattern recognition and stereo-matching, in order to build accurate 3D crack models. The innovation lies in the hybrid approach for the CNN detector initialization, and the use of the modified census transformation for stereo matching along with a binary fusion of two state-of-the-art optimization schemes. The described approach manages to deal with images of harsh radiometry, along with severe radiometric differences in the stereo pair. The effectiveness of this workflow is evaluated on a real dataset gathered in highway and railway tunnels.
The rest of the sections are as follows: the overall methodology (i.e. defect detection and 3D modelling) for inspecting civil infrastructures is analysed in Section 2; Section 3 describes the evaluation scheme and proves the effectiveness of the scheme; Section 4 concludes this work with some remarks and future work.
2. THE PROPOSED METHODOLOGY
The inspection scheme in this paper involves a three step approach: (a) data acquisition/ training set creation, (b) CNN initialization and crack identification, and (c) full crack description via 3D modelling, exploiting stereo vision techniques. length and small width, and on the other, to be “not straight” lines. Furthermore, pixels that belong to cracks are expected to be darker than their neighbouring pixels that do not belong to cracks. In other words, shape properties describe the ratio length to width for the detected edges, while intensity properties describe the spatial relationship of cracks to their surroundings. Thus, based on cracks characteristics, the crack detection problem can be addressed through two different approaches; i) through approaches that are based on image processing techniques and ii) through approaches that are based on machine learning techniques.
2.1 Defects in Dataset and Processing Challenges
Tunnel inspection is a tedious task and even when robots are employed, optical information comes with difficulties, occlusions (e.g. bugs, webs, and graffiti) and noise (e.g. dust, steam). Different defects exist and are of structural interest;
deformations, cracks, surface disintegration, and other defects are widely known and commonly appear.
Defects that appear on the tunnel lining can actually be of no interest; discrete, parallel cracks that look like tearing of the surface are caused by shrinkage while the concrete is still fresh, alkali-silica reaction within the concrete. Structural failure cracking may look like many other types of cracking; however, in slabs they are often associated with subsequent elevation changes, where one side of the crack is be lower than the other.
Disintegration of the surface is generally caused by three types of distress: (a) dusting, due to carbonation of the surface by unventilated heaters or by applying water during finishing, (b) ravelling or spalling at joints, when pieces of concrete from the joint edges are dislodged and, (c) breaking of pieces from the surface of the concrete, generally caused by delamination and blistering. At this point, we understand the defect identification problem: it is extremely difficult to extract features suitable for the accurate description of such a large number of defect alternatives, simultaneously.
2.2 Unsupervised Image Annotation
Image processing techniques exploit cracks’ characteristics, regarding pixels intensity and their spatial relations, through the utilization of morphological operations, kernel filtering and simple shape analysis based on the size of detected areas and their “sphericity”. The utilization of image processing techniques can be though as an unsupervised crack detection approach. It requires no annotated data, while at the same time and all image processing operations can be parallelized in order to achieve better than real time performance (25fps). However, a crack detection system that is based on image processing presents low generalization ability due to the fact that applied operations are fine tuned for a specific dataset. The developed crack detection system is based exclusively on image processing techniques. Concretely, our approach is based on the following five steps: (i) line enhancing; (ii) noise removal; (iii) straight lines removal; (iv) shape filtering and (v) morphological reconstruction.
Line enhancing exploits intensity characteristics of cracks. The intensity of pixels that are darker than the average intensity of their neighbours is set to zero. The number of neighbours of a pixel p located at (x,y) position on image plane is defined by the size of a square window centred at the same position. Although that line enhancement can emphasize region that may contain a crack, it produces “salt and pepper” noise. For this reason, line enhancement is followed by a noise removal step that exploits a median filter. Furthermore, during the noise removal step, the image is converted to binary by thresholding any detected group
Shape filtering using appropriate image moments is another crucial step towards crack detection. Cracks is expected to have the form of curves. Thus, by locating the minimum enclosing circles of connected components we are able to exclude candidate cracks, whose shape is not like a curve. Finally, we perform a classical morphological operation called “opening by reconstruction”. Opening by reconstruction starts from a set of starting points (seeds) and then grown in flood-fill fashion ton include complete connected components, while retraining the contours of the objects of interest.
2.3 The CNN Detector
The detection of defects can be seen as a two-class image segmentation problem; defects class and non-defects class. Such a task requires the description of pixels by a set of highly discriminative features that fuse visual and spatial information. However, the features extraction is depended on the problem at hand. Such drawback can be eliminated following the deep learning paradigm. At first image patches are created over RGB
Concretely, in order to classify a pixel p(x,y), located at (x,y) point on image plane, we use a square patch of size × centred at pixel p. If we denote as the class label of the pixel at location (x,y) and as the patch centred at pixel p, then, we can form a dataset = , , for = 1, … , and = 1, … , . These matrices are fed as input into the CNN. Then, the CNN hierarchically builds complex, high-level features that encode visual and spatial characteristics of pixel p. The output of the CNN is sequentially connected with the MLP. Therefore, obtained features are used as input by the MLP classifier, which is responsible for detecting defects.
2.4 3D Reconstruction
Once a crack, which is critical from the structural integrity point of view, is detected, 3D information is extracted for its position and orientation in world space. For this, two stereo-cameras are exploited in a twofold manner: the real-time 3D extrapolation of a cracks silhouette and orientation, and the offline full 3D reconstruction of a high fidelity model of the wider area of a crack. At the beginning of the inspection process the stereo cameras have to be calibrated based on a Plexiglas chessboard with a red central square (Prokos et al., 2009), which allows to calibrate with a chessboard pattern without visible edges, as in the discussed case since the system cameras are calibrated from 1.5m and 3 m with the same chessboard plane, thus it can be only partially visible. The subsequent stereo-matching and 3D reconstruction processes are executed on the rectified epipolar images.
In this contribution, the disparity map is estimated from a fusion of two methods: semi-global matching (SGM) and local cross-based matching (LCBM). Moreover, the matching cost is selected to be robust against the harsh radiometric characteristics of images of artificially lighted infrastructures. In section 3.1 the specific characteristics of the tunnel dataset are presented. The matching cost is computed on the modified census transformation TMC (Stentoumis et al., 2015). The binary transformation TMC of a pixel p is defined as
which describes the concatenation of the two transformed vectors corresponding to the x and y directions of the gradient onto which the census ci is computed (Zabih and Woodfill, 1994),
The matching cost C between a pixel p(x,y) of the reference image (ref) and its corresponding pixel p(x-d,y) in the matching image (mat) is the Hamming distance, which is the number of
As already stated, the cost function is optimized through the fusion of SGM and LCBM estimated disparity maps. Whenever the estimated disparities d* of the two methods differ, the disparity value is rejected, thus a validity map V is constructed,
SGM
LCBM
SGM LCBM
1, , ,
2 C * 1 2 C * C * 1subpx C * 1 C * 1 /
d = d + d
d + d + d (6)
The described matching strategy meets the requirements of speed and computational efficiency for a real-time inspection, while concurrently serves the requested accuracy and level of detail.
3. EXPERIMENTAL SETUP
The crack detection algorithms were developed on a conventional laptop with i7 CPU, 8GB RAM, using both OpenCV and Theano (Bastien et al., 2012) libraries, in Python. The 3D modelling algorithms were developed in Matlab environment on the same computer. The time needed for an inspection cycle is appro-ximate 45sec for the image processing, 1 min for the CNN annotation and 0.5sec for the real time 3D extraction.
3.1 Dataset Description and Analysis
All the images presented here originate from Egnatia motorway Metsovo tunnel in Northern Greece and the experimental tunnels of VSH premises in Sargans, Switzerland. The motorway tunnels are 3.5km long twin tunnels and have a diameter of 10m. In a parallel distance of 20m north to this bore, runs the ventilation tunnel of 3m diameter. The main tunnel suffered a significant deformation due to water inflow. Image data were captured at this part of the tunnel, using a hand held DSLR camera. In Figures 1 & 2 some indicative tunnel images from the acquired dataset can be seen. Regions depicting defects, for each of the captured images, were manually annotated, by experts (i.e. about 100 images). As already mentioned in Section 2.1, images acquired in tunnels share unique characteristics, which make image processing, machine learning and stereo-matching extremely demanding tasks. Low or uneven lighting causes, in some cases, blurred images due to low shutter speed. On the other hand, strong flash lights and the artificial tunnel lighting, which is usually on the ceiling and the rear, can conceal the hairline (below 1mm) defects., whereas the different texture in images due to different materials and colorization can raise more complications for recognition and reconstruction algorithms.
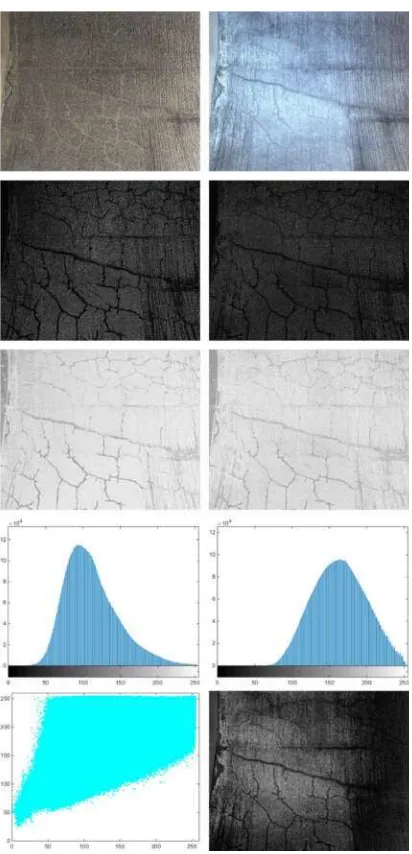
During the inspection procedure in operating tunnels, users cannot control the reflection of the lights and the combined effect of vehicle lights, recording imaging system light and tunnel lights. The work of (Stentoumis et al., 2015) has also presented similar data. Figure 1 presents some indicative radiometric changes in the image set, which can be found on the tunnel dataset images, but also refer to images collected in artificial illuminated industrial environments. Such severe changes can be caused by changes in the orientation of the lighting source, either from the robotic vehicle or arm, and the existence of periodic lights in the operating tunnels. Moreover, the variable size of the tunnels can change the amount of lighting that reflects from the vehicle to the construction lining.
Finally, the automatic radiometric calibration of the cameras results in different configuration parameters even for cameras that are side-by-side, as in the stereo-rig used in this work. The choice of automatic radiometric calibration was made during our first experimental evaluation, because of the changing lighting conditions in the operating tunnel, which prevent as from fixing the aperture, the exposure time and the gamma correction of the image sensors. Another important and really disturbing aspect for the quality of matching and crack detection is the presence of water drops on the surface of the tunnels. These drops were in an
extensive amount, as one can observe in the images and appear as salt-and-pepper noise. Hence, a basic assumption of image matching which is that the depicted surfaces are Lambertian had been violated. The presence of water drops, not only creates an anaglyph on the tunnel surface, which is observed as noise in the reconstructed surfaces and partially hides the cracks, but also the anisotropic reflectance of the light creates local, not modelled radiometric differences to the left and the right image of the stereo pair. In Table 1 the statistics of the indicative image in Figure 1 are presented. These statistics have been calculated in order to thoroughly study the differences among images of the same stereo pair, as this poses a special difficulty for matching.
Figure 1. Radiometric changes on the dataset images. First row: two potential instances of the same image. Second
row: the standard deviation of each image’s pixels is displayed in a neighbourhood of 5 pixels. Third row: the local entropy of the two image instances is displayed. The
fourth row includes the two histograms. Last row: the function of the two images intensities is presented, only to
Moreover, the radiometric differences described from these statistics were studied in order to help us determine global values for the parameters of the algorithms.
Setting 1 Setting 2
Mean 111.68 163.58
Standard deviation 35.70 35.34
Entropy 7.11 7.17
Contrast 0.7256 0.3372
Correlation 0.7255 0.8706
Homogeneity 0.7835 0.8503
Table 1: Image analysis for an indicative image taken under different radiometric settings.
3.2 Image Processing
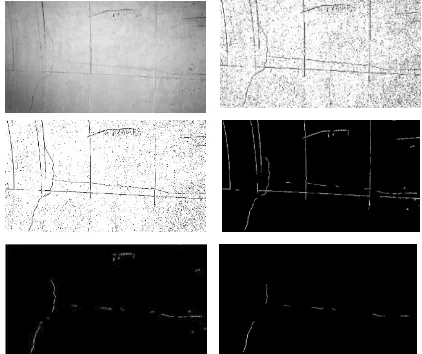
The crack detection is based solely on the CNN. However, in order to facilitate the data set creation, we employ, image processing techniques. Such an approach does not require annotated data. Yet, it has low generalization ability and it has to be fine-tuned for a specific dataset; there are many parameters in the operators. The data set creation approach needs only a few images, which are easily obtained (usually at first few meters, after the tunnels entrance). If there is photographic material, for the specific infrastructure, from previous examinations, few pictures will be selected at random. After the image gathering is complete, the image annotation process is performed. Line enhancement is performed on 13×13 windows by thresholding the 0.99% of the mean intensity value. Then, areas spanning less than 500 pixels are considered noise and, thus, excluded. The straight line removal, based on Hough transform, parameters, i.e. distance and angle resolution, were set to 5 pixels and 0 radians respectively. Finally, areas of defects should span at least 30% of the minimum enclosing circle. An indicative result of the annotated images can be found in Figure 2. initial image and the enhanced lines binary version; second row: noise removal and area filtering; last row: removal of
the straight lines and final estimated annotations.
3.3 CNN Annotations
The input of the CNN are patches of dimensions 9×9, in order to take into consideration the closest 24 neighbours of each pixel. By increasing the value of s, the number of neighbours that are taken into consideration is increased and thus the computational
cost of classification is increased, also. Also, setting the parameter to a value larger than 9, resulted in no further performance's improvement. On the contrary, increasing the value of over 13, deteriorates classification accuracy. The first layer of the proposed CNN is a convolutional layer with = 15 trainable filters of dimensions 5 × 5. Due to the fact that we do not employ a max pooling layer, the output of the first convolutional layer is fed directly to the second convolutional layer (30 kernels of size 3×3). Then, the third layer (45 kernels
3.4 Performance Metrics
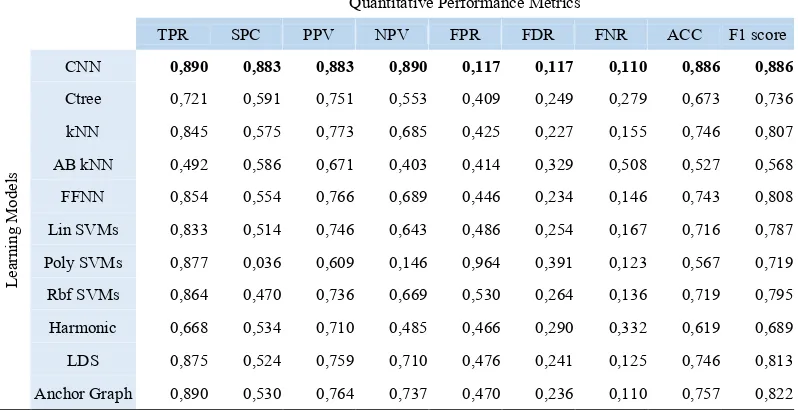
In this classification problem we have two possible classes; cracks or non-cracks, named positive (P) and negative (N) class, respectively. Given the outputs, the confusion table is formed, which is a 2 × 2 matrix that reports the number of false positives (FP), false negatives (FN), true positives (TP), and true negatives (TN). From these values various performance metrics regarding the defect detection performance are calculated (Table 2). Metrics of special interest are: Sensitivity (proportional to TP) and miss rate (proportional to FN), which are both strongly connected to crack detection. The proposed method have been compared against other techniques like classification trees (cTrees), k-nearest neighborhood (kNN), kNN using adaboost (AB kNN), feed forward neural networks (FNN), Support Vector Machines (SVMs) using different kernels (linear, polynomial, RBFs), harmonic separation schemes, low density separation (LDS) and anchor graphs. For all objective criteria, our CNN outperforms the compared ones.
3.5 3D Reconstruction
Figure 4. A detail of the left image of a stereo-pair and the
corresponding disparity map.
disparity map needs to be improved, in order to reduce noise in smooth surfaces, but also ensure that cracks and areas of discontinuities are not flattened. The exploitation of more stereo-pairs in the setup ensures better reconstruction, by minimizing occlusions and filtering erroneous matches. Models reconstructed by five stereo-pairs can be seen in Figure 5. The comparison of reconstructed point clouds from different stereo-pairs of the same scene through the ICP algorithm, has led to 1.7mm deviation, thus about 3 pixels of the original images.
4. CONCLUSIONS AND FUTURE WORK
The exploitation of computer vision algorithms and procedures in real-life needs is an intriguing task; especially in industrial environments, where the specifications and cost-benefit relations are strict, huge effort is needed in order to make a computer vision workflow actually applicable. The artificial lighting in close spaces, as in tunnel infrastructures form very particular conditions under which the images are grabbed; hence many recognition and modelling approaches cannot estimate trustworthy results. Detecting cracks is a demanding procedure, as among typical difficulties in recognition tasks, the lack of large amounts of data for such specific use cases is a further obstruction.
Figure 5. High fidelity 3D models of detected cracks.
The deep learning scheme presented here successfully addresses this problem. On the other hand, state-of-the-art matching methods that estimate accurate disparities in indoor or outdoor scenarios highly fail in scenarios as the one presented here. In this work, the potentials of a combined aggregation strategy (i.e. SGM and adaptive local matching) and a dedicated matching function for images with radiometric changes was exploited. A further improvement would be to train an algorithm to choose, or combine, results from several matching algorithms (Spyropoulos and Mordohai, 2015).
ACKNOWLEDGEMENTS
The research leading to these results has received funding from the EC FP7 project ROBO-SPECT (Contract N.611145). Authors wish to thank all partners within the ROBO-SPECT consortium.
REFERENCES
Abdel-Qader, I., Abudayyeh, O., Kelly, M.E., 2003. Analysis of edge-detection techniques for crack identification in bridges. J. Comput. Civ. Eng., 17, pp. 255–263.
Bastien, F., Lamblin, P., Pascanu, R., Bergstra, J., Goodfellow, I., Bergeron, A., Bouchard, N., Warde-Farley, D., Bengio, Y., 2012. Theano: new features and speed improvements.
German, S., Brilakis, I., DesRoches, R., 2012. Rapid entropy-based detection and properties measurement of concrete spalling with machine vision for post-earthquake safety assessments. Adv. Eng. Informatics, EG-ICE 2011 + SI: Modern Concurrent Engineering, 26, pp. 846–858.
Halfawy, M.R., Hengmeechai, J., 2014. Automated defect detection in sewer closed circuit television images using histograms of oriented gradients and support vector machine. Autom. Constr. 38, pp. 1–13.
Hirschmüller, H., 2008. Stereo processing by semiglobal matching and mutual information. IEEE Trans. Pattern Anal. Mach. Intell., 30, pp. 328–341.
Jahanshahi, M.R., Masri, S.F., Padgett, C.W., Sukhatme, G.S., 2013. An innovative methodology for detection and quantification of cracks through incorporation of depth perception. Mach. Vis. Appl., 24, pp. 227–241.
Kawamura, K., Miyamoto, A., 2003. Condition state evaluation of existing reinforced concrete bridges using neuro-fuzzy hybrid system. Comput. Struct., 81, pp. 1931–1940.
Kim, Y.-S., Haas, C.T., 2000. A model for automation of infrastructure maintenance using representational forms. Autom. Constr., 10, pp. 57–68.
Kiryati, N., Eldar, Y., Bruckstein, A.M., 1991. A probabilistic Hough transform. Pattern Recognit., 24, pp. 303–316.
Koch, C., Brilakis, I., 2011. Pothole detection in asphalt pavement images. Adv. Eng. Informatics, Special Section: Engineering informatics in port operations and logistics, 25, pp. 507–515.
Koch, C., Paal, S., Rashidi, A., Zhu, Z., König, M., Brilakis, I., 2014. Achievements and Challenges in Machine Vision-Based Inspection of Large Concrete Structures. Adv. Struct. Eng., 17, pp. 303–318.
Liu, Z., Suandi, S.A., Ohashi, T., Ejima, T., 2002. Tunnel crack detection and classification system based on image processing, in: Electronic Imaging 2002. International Society for Optics and Photonics, pp. 145–152.
Makantasis, K., Protopapadakis, E., Doulamis, A.D., Doulamis, N.D., Loupos, C., 2015. Deep Convolutional Neural Networks for Efficient Vision Based Tunnel Inspection. In: IEEE International Conference on Intelligent Computer Communication and Processing, Cluj-Napoca, Romania. Nashat, S., Abdullah, A., Abdullah, M.Z., 2014. Machine vision for crack inspection of biscuits featuring pyramid detection scheme. J. Food Eng., 120, pp. 233–247.
Prokos, A., Karras, G., Grammatikopoulos, L., 2009. Design and evaluation of a photogrammetric 3d surface scanner, in: XXII CIPA Symposium on Digital Documentation, Interpretation & Presentation of Cultural Heritage. Kyoto, pp. 1–6.
Protopapadakis, E., Doulamis, N., 2015. Image Based Approaches for Tunnels’ Defects Recognition Via Robotic Inspectors. In: 11th International Symposium on Visual Computing.
Quantitative Performance Metrics
TPR SPC PPV NPV FPR FDR FNR ACC F1 score
Le
ar
ni
ng M
od
el
s
CNN 0,890 0,883 0,883 0,890 0,117 0,117 0,110 0,886 0,886 Ctree 0,721 0,591 0,751 0,553 0,409 0,249 0,279 0,673 0,736 kNN 0,845 0,575 0,773 0,685 0,425 0,227 0,155 0,746 0,807 AB kNN 0,492 0,586 0,671 0,403 0,414 0,329 0,508 0,527 0,568 FFNN 0,854 0,554 0,766 0,689 0,446 0,234 0,146 0,743 0,808 Lin SVMs 0,833 0,514 0,746 0,643 0,486 0,254 0,167 0,716 0,787 Poly SVMs 0,877 0,036 0,609 0,146 0,964 0,391 0,123 0,567 0,719 Rbf SVMs 0,864 0,470 0,736 0,669 0,530 0,264 0,136 0,719 0,795 Harmonic 0,668 0,534 0,710 0,485 0,466 0,290 0,332 0,619 0,689 LDS 0,875 0,524 0,759 0,710 0,476 0,241 0,125 0,746 0,813 Anchor Graph 0,890 0,530 0,764 0,737 0,470 0,236 0,110 0,757 0,822
Pynn, J., Wright, A., Lodge, R., 1999. Automatic identification of cracks in road surfaces. In: Image Processing and Its Applications, 465(2), pp. 671–675.
Sinha, S.K., Fieguth, P.W., 2006. Automated detection of cracks in buried concrete pipe images. Autom. Constr., 15, pp. 58–72. Son, H., Kim, C., Kim, C., 2012. Automated Color Model–Based Concrete Detection in Construction-Site Images by Using Machine Learning Algorithms. J. Comput. Civ. Eng., 26, pp. 421–433.
Spyropoulos, A., Mordohai, P., 2015. Ensemble classifier for combining stereo matching algorithms. In: IEEE International Conference on 3D Vision, pp. 73–81.
Stent, S., Gherardi, R., Bjοrn Stenger, Soga, K., Cipolla, R., 2013. An image-based system for change detection on tunnel linings, in: IAPR International Conference on Machine Vision Applications.
Stent, S., Gherardi, R., Stenger, B., Cipolla, R., 2015. Detecting change for multi-view, long-term surface inspection. In: British Machine Vision Conference, pp. 1–12.
Stentoumis, C., Grammatikopoulos, L., Kalisperakis, I., Karras, G., 2014. On accurate dense stereo-matching using a local adaptive multi-cost approach. ISPRS J. Photogramm. Remote Sens., 91, pp. 29–49.
Stentoumis, C., Karras, G., Amditis, A., 2015. Census-based cost on gradients for matching under illumination differences, in: IEEE International Conference on 3D Vision. Lyon, pp. 224– 231.
Tung, P.-C., Hwang, Y.-R., Wu, M.-C., 2002. The development of a mobile manipulator imaging system for bridge crack inspection. Autom. Constr. 11, pp. 717–729.
Yoon, J.-S., Sagong, M., Lee, J.S., Lee, K., 2009. Feature extraction of a concrete tunnel liner from 3D laser scanning data. NDT E Int., 42, pp. 97–105.
Yu, S.-N., Jang, J.-H., Han, C.-S., 2007. Auto inspection system using a mobile robot for detecting concrete cracks in a tunnel. Autom. Constr. 16, pp. 255–261.
Zabih, R., Woodfill, J., 1994. Non-parametric local transforms for computing visual correspondence, in: European Conference in Computer Vision. IEEE, Stockholm, Sweden, pp. 151–158. Zhang, K., Lu, J., Lafruit, G., 2009. Cross-based local stereo matching using orthogonal integral images. IEEE Trans. Circuits Syst. Video Technol., 19, pp. 1073–1079.
Zhang, W., Zhang, Z., Qi, D., Liu, Y., 2014. Automatic crack detection and classification method for subway tunnel safety monitoring. Sensors (Basel)., 14, pp. 19307–28.