MULTI-TEMPORAL AND MULTI-SENSOR IMAGE MATCHING BASED ON LOCAL
FREQUENCY INFORMATION
Xiaochun Liu a, *, Qifeng Yu a, Xiaohu Zhang a, Yang Shang a, Xianwei Zhu a, Zhihui Lei a
a Aeronautical and Astronautical Science and Technology
,
National University of Defense Technology
,
Changsha
,
Hunan
,
China
[email protected];
[email protected];
[email protected];
jmgc108@vip,163.com;
; [email protected]
Commission III
KEY WORDS: Image Matching; Local Average Phase; Local Weighted Amplitude; Local Best-Matching Point; Similarity Measurement; Local Frequency Information;
ABSTRACT:
Image Matching is often one of the first tasks in many Photogrammetry and Remote Sensing applications. This paper presents an efficient approach to automated multi-temporal and multi-sensor image matching based on local frequency information. Two new independent image representations, Local Average Phase (LAP) and Local Weighted Amplitude (LWA), are presented to emphasize the common scene information, while suppressing the non-common illumination and sensor-dependent information. In order to get the two representations, local frequency information is firstly obtained from Log-Gabor wavelet transformation, which is similar to that of the human visual system; then the outputs of odd and even symmetric filters are used to construct the LAP and LWA. The LAP and LWA emphasize on the phase and amplitude information respectively. As these two representations are both derivative-free and threshold-free, they are robust to noise and can keep as much of the image details as possible. A new Compositional Similarity Measure (CSM) is also presented to combine the LAP and LWA with the same weight for measuring the similarity of multi-temporal and multi-sensor images. The CSM can make the LAP and LWA compensate for each other and can make full use of the amplitude and phase of local frequency information. In many image matching applications, the template is usually selected without consideration of its matching robustness and accuracy. In order to overcome this problem, a local best matching point detection is presented to detect the best matching template. In the detection method, we employ self-similarity analysis to identify the template with the highest matching robustness and accuracy. Experimental results using some real images and simulation images demonstrate that the presented approach is effective for matching image pairs with significant scene and illumination changes and that it has advantages over other state-of-the-art approaches, which include: the Local Frequency Response Vectors (LFRV), Phase Congruence (PC), and Four Directional-Derivative-Energy Image (FDDEI), especially when there is a low signal-to-noise ratio (SNR). As few assumptions are made, our proposed method can foreseeably be used in a wide variety of image-matching applications.
* Corresponding author. This is useful to know for communication with the appropriate person in cases with more than one author.
1. INTRODUCTION
Multi-temporal and multi-sensor image matching is an inevitable problem arising in a variety of applications, such as multisource data fusion, change analysis, image mosaic, vision navigation, and object recognition. Because the reference image and the searching image differ in relation to time or the type of sensor, the relationship between the intensity values of the corresponding pixels is usually complex and unknown. For instance, the contrasts of the images may differ, or the scenes may change dramatically over time. In other words, the two images are not globally correlated. Therefore, multi-temporal and multi-sensor image matching presents a challenging problem. Note that we assume that the matching image pairs have already been registered, hence geometric distortion is not discussed in this paper.
The current automatic matching techniques generally fall into two categories: feature-based methods and area-based methods. Feature-based methods, which are by far the most popular, utilize extracted features, with the most widely used features including regions, lines or curves, and points [1-3]. If features
normalized-correlation, (ii) sum of squared brightness differences, and (iii) mutual information [8].
The image representations commonly used for area-based methods are some gradient operators which include: Canny, Sobel, Prewitt, Kirsch, Laplacian of Gaussian, and Susan etc.. Using these spatial derivative operators, one can emphasize the edges, corners, and blobs that represent some illumination invariant component of images. However, these gradient representations are usually sensitive to noise. Therefore, the gradient representations are not able to handle some noisy multi-sensor and multi-temporal images efficiently. Representation based on local frequency information was introduced in [9]. Working in the frequency domain, local phase and amplitude information over many different scales and orientations were used to construct a dimensionless measure of similarity that has high localization. However, due to the un-weighted local frequency, the algorithm was unable to clearly emphasize common information, such as edges and corners. Therefore, the performance of our evaluation experiment is unsatisfactory. As phase congruence is condition-independent and invariant to illumination changes, it was employed to represent images in [10]. However, when calculating phase congruence with the denominator representing the sum of the amplitude in the Log-Gabor expansion spaces, a division operator is inevitably involved. As the value of the denominator is usually small in the texture-less regions, the method presented in [10] is quite sensitive to noise in the texture-less regions, as shown in Figure 2. This paper addresses these difficulties by using local frequency information obtained from Log-Gabor wavelets over many scales and orientations. A compositional similarity measurement and a local best matching point detection are also presented to make the presented image matching approach more robust and accuracy.
2. LOCAL AVERAGE PHASE AND LOCAL
WEIGHTED AMPLITUDE
2.1 Local Average Phase
In this working, the wavelet transformation is used to obtain the frequency information which is local to a point in the signals. To preserve phase information, the nonorthogonal wavelets in the symmetric/anti-symmetric quadrature pairs are adopted. Rather than using Gabor filters, we prefer to use Log-Gabor functions, because Log-Gabor filters allow arbitrarily large bandwidth filters to be constructed, while maintaining a zero
DC component in the even-symmetric filter. (A zero DC value cannot be maintained in Gabor functions for bandwidths over one octave [11].) On the linear frequency scale, the Log-Gabor function has a transfer function of the form:
2 shape ratio filters, the term
0 even-symmetric (cosine) and odd-symmetric (sine) wavelets, respectively, and es r,( ),x os r, ( )x denote the even-symmetric and response vectors, with one vector for each scale and orientation of the filter. These response vectors form the basis of our localized representation of the signal. An estimate of F(x) can be formed by summing the even filter convolutions. Similarly, H(x) can be estimated from the odd filter convolutions.
,
The average phase is given by
operator is not introduced, which makes our new image representation more robust to noise, even in the texture-less image region.
2.2 Local Weighted Amplitude
In this work, we extend the phase congruence to LWA, which is more suitable for multi-temporal and multi-sensor image representation. The equation of LWA (
A
w) is expressed as the summation of orientations r and scales s:,
( ) ( ) ( ) ( )
w s r r
r s
A x =
∑ ∑
W x A x∆φ x −T (6)where denotes that the enclosed quantity is not permitted to be negative;
A
s r, represents the amplitude at scales
and orientationr
; andTcompensates for the influence of noise and is estimated empirically. ∆φr( )x is a sensitive phase deviationof the
rth
orientation and is defined as:(
,)
(
,)
using dot and cross products between the filter output response vectors to calculate the cosine and sine of(
φ
s r,( )
x
−
φ
r( )
x
)
. The unit vector representing the direction of the weighted mean phase angle,φ
r( )
x
, is given byUsing dot and cross products one can obtain:
(
)
(
)
Clearly, a point of frequency amplitude is only significant if it occurs over a wide range of frequencies. Thus, as a measure of feature significance, frequency amplitude should be weighted by some measure of the spread of the frequencies present. A phase significance weighting function can then be constructed by applying a sigmoid function to the filter response spread below which the frequency amplitude values become penalized, and
γ
is a gain factor that controls the sharpness of the cut-off. Eq.6 – Eq.10 give us the quantities needed to calculate this version of the LWA without any division operator.The LAP and LWA are both used to extract the common components of multi-temporal and multi-sensor images, such as edges, contours, and blobs. Note that the two image representations do not involve any thresholding and, therefore, preserve all the image details. This is in contrast to commonly used representations (e.g., edge maps, contours, point features), which eliminate most of the detailed variations within the local image regions.
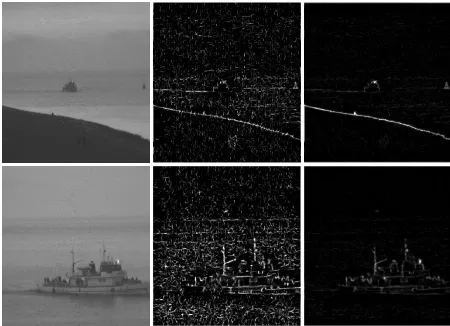
Figure 2. The results of PC and LWA. From left to right: the raw image; the PC map; and the LWA map. Note that the LWA map is much more robust and stable than the PC map, especially in texture-less image regions such as the sky, sea, and ground.
3. THE COMPOSITIONAL SIMILARITY
MEASUREMENT
(
)
( )As the LAP represents the phase of local frequency vectors, it is an image contrast invariant variation. Therefore, for efficiency, we present an Extended Mean Absolute Difference (EMAD) as the similarity measure rather than ZNCC. If we define fp and gp as the LAP pair, the definition of EMAD is given by:
(
)
Max as the maximum value of ZNCC matrix and
EMAD
Max as the maximum value of EMAD matrix respectively,
then the newly presented CSM can be expressed as follows:
( , ) 1 ( , )
A very small positive constant
ε
is added to the denominator in case of a small MaxZNCCand/orMaxEMAD. From Equ.13, we can see the value range of EMAD and ZNCC are both normalized, therefore, they have the same value range. The maximum value of the ZNCC component, ( , ) 1 with equal weight, and make full use of them.4. LOCAL BEST MATCHING POINT DETECTION
In this work, the goal of local best matching point detection is texture within the template obviously changes, and then we can know this template is unique, and is also suitable for image matching. Therefore, the local best matching point can be detected using the self-similarity measurement. We first need to evaluate the suitability measurement of each point surrounding the target point and then choose the point with the highest suitability measurement as the local best feature point. The detailed algorithm proceeds as follows:
(1) Pick a point from the region centered on the target point, and then calculate the suitability of the selected point. The definition of suitability can be expressed as follows:
First, as shown in Figure 3, pick another eight points which are centered on the selected point, and equally spaced on a circle of radius, r; Second, if we define the template centered on the selected point as the centre template, and the template centered on the other eight points as the neighboring templates, we can choose the centre template as the reference template, and calculate its self-similarity measurement with neighboring templates. In this work, we use ZNCC as the self-similarity measurement. If we define ZNCCN as the self-similarity measurement of the neighboring template, then the suitability measurement of the template, S, can be defined as:
1 ( N)
S= −Max ZNCC (14)
where Max ZNCC( N) is the maximum self-similarity value ofZNCCN.
(2) Successively pick a point from the region, which are centered on the target point with a circle of radius, R, as shown in Figure 3. Similar to step 1, get the suitability measurement for all these selected points.
(3) Find the point with the highest suitability measurement, and identify this point as the local best matching point.
(4) Conduct the image matching using the template centered on the local best matching point. After matching, based on the geometric transformation between the reference image and the searching image, calculate the corresponding point of the target point.
Figure 3. Local Best Matching Point Detection
5. EXPERIMENTS
5.1 Experiments Using Real Images
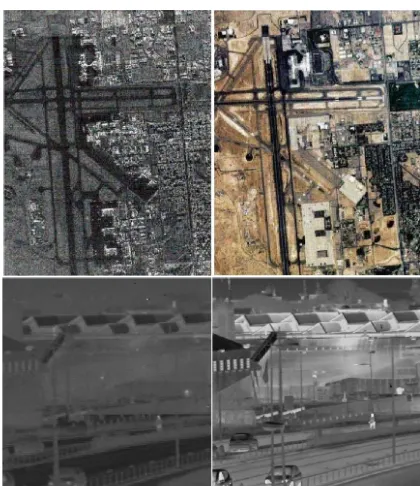
We evaluate the performance of the proposed method using some real images, which include: a pair of infrared and visible images and a pair of SAR and visible images. We compare the matching results obtained from the proposed algorithm with those from three existing state-of-the-art methods based on Local Frequency Response Vectors (LFRV) [9], Phase Congruence (PC) [10], and Four Directional-Derivative-Energy Image (FDDEI) [12]. As shown in Figure 4, many target points are first selected from the reference image (left), and the interval of the target points is 20 pixels. The four different image matching approaches then conduct on the searching images (right) to search the corresponding points. The size of the template is 101(pixel)×101(pixel), and the size of the
searching region is 201(pixel)×201(pixel). If the distance from
a matching result to its corresponding truth-value is less than 1.5 pixels, we identify this matching result as correct. The Correct Rate obtained from four different methods are shown in Figure 5.
The experiments using real images show that our new method is effective for matching multi-sensor and multi-temporal images which cannot be effectively handled by the traditional methods. From Figure 5, we can see the average accuracy rate of our new method is much higher than other methods. Moreover, when matching the SAR and Visible images pair, the performances of the three traditional methods reduce dramatically. However, our new method is still able to robustly handle the image pair.
Figure 4. The raw image pair of SAR & Visible and Infrared& Visible light
Figure 5. Correct Rate obtained from four different methods
5.2 Experiments Using Simulation Images
In order to evaluate the performance of our presented method comprehensively, we also do many experiments using simulation images. The simulation images are made as follows: add Gaussian white noise to the raw image. The Gaussian noise is generated by imnoise function of Matlab. The mean of Gaussian is given a same value of 0 for all simulation images, and the values of the variance are ascending from 0.1 to 3.5. Without loss of generality, SNR is employed to describe the degree of noise. The definition of SNR goes as follows:
(
)
(
)
2
1 1 10
2
1 1
( , ) 10 log
( , ) ( , ) M N
i j M N
i j
v i j SNR
u i j v i j = =
= =
= ×
−
∑∑
∑∑
(15)
Where M, N is defined as the height and width of image respectively, v i j( , ) is the gray value of pixel without noise, and
u i j
( , )
is the gray value of pixel with noise. If we define the value of noise isn i j
( , )
, then we can get the equation:( , )
( , )
( , )
u i j
=
v i j
+
n i j
(16)Figure 6. The images with different SNRs. The values of SNRs are 5.1728 and -0.0007 from left to right.
The images with different SNRs are shown in Figure 6. The experiments using simulation images are similar to experiments using real images. We choose the image without Gaussian noise as the reference image, and the image with Gaussian noise is used as the searching images. After Image Matching experiments, we can get many different correct rates corresponding to different SNRs, as shown in Figure7.
Figure 7. Correct Rate obtained from four different methods with different SNRs
6. CONCLUSION
This paper presents a new matching approach for multi-temporal and multi-sensor images. We propose the LAP and LWA to represent the image. The new representations, which are based on Log-Gabor wavelet transformation, are derivative-free and threshold-derivative-free. Therefore, the new representations are robust to noise, and can extract the common components of image pairs without loss of image detail. The CSM is then presented to combine the information from the LAP and LWA (independent of each other) with the same weight. Using this compositional scheme, we are able to make full use of the LAP and LWA to improve the robustness and accuracy of the image matching. A local best matching point detection method based on self-similarity analysis is presented to choose the template with the most distinct feature in the region centered on the target point. Compared with the traditional matching methods based on local frequency response vectors, phase congruence, and four directional-derivative-energy images, our method has significant advantage. From the experiments using real images and simulation images, we have demonstrated that the presented method can obtain more robust and accuracy matching results even in the case of very low SNR and for the very noisy SAR and visible images. Because few assumptions are made, our proposed method can foreseeably be used in a wide variety of image-matching applications.
References:
[1] Lindeberg, T., 1998, Feature detection with automatic scale selection. In: International Journal of Computer Vision 30(2), pp. 79–116.
[2] D. G. Lowe., 2004, Distinctive image features from scale-invariant key points. In: International Journal of Computer Vision. 60, pp. 91–110.
[3] Harris, C., and Stephens, M., 1988 A combined corner and edge detector. In: Proceedings of the Alvey Vision Conference, pp. 147–151.
[4]Ke, Y., and Sukthankar, R., 2004 PCA-SIFT: A more distinctive representation for local image descriptors. In: CVPR (2), pp. 506–513.
[5] Lowe, D.G., 1999, Object recognition from local scale-invariant features. In: Proceedings of International Conference on Computer Vision, pp. 1150–1157.
[6] Fernàndez, X., 1997, Template matching of binary targets in gray scale images: a nonparametric approach. In: Pattern Recognition, 30(7), pp. 1175–82.
[7] Khosravi, M, and Schafer R.W., 1996, Template matching based on a grayscale hit-or-miss transform. In: IEEE Transactions on Image Processing, 5(6), pp. 1960–6.
[8] Viola, P. and Wells, W. III., 1995, Alignment by maximization of mutual information. In: Proceedings of the International Conference on Computer Vision, pp. 16–23. [9]Kovesi, P., 1995, Image correlation from local frequency information. In: Proceedings of the Australian Pattern Recognition Society Conference, Brisbane, pp. 336–341.
[10]Liu, Z. and Laganiere, R., 2007 Phase congruence measurement for image similarity assessment, In: Pattern Recognition Letters, 28 (1), pp. 166–172.