DIGITAL ARCHIVING OF PEOPLE FLOW BY RECYCLING LARGE-SCALE SOCIAL
SURVEY DATA OF DEVELOPING CITIES
Yoshihide Sekimoto a, *, Atsuto Watanabe a, Toshikazu Nakamura a, Teerayut Horanont b a
Center for Spatial Information Science, the University of Tokyo, Japan
- (sekimoto, atsuto, ki_ki_gu)@csis.u-tokyo.ac.jp
b
Institute of Industrial Science, the University of Tokyo, Japan - [email protected]
Commission VI, WG VI/4
KEY WORDS: Reconstruction of people flow, Social survey data, Large-scale spatio-temporal analysis
ABSTRACT:
Data on people flow has become increasingly important in the field of business, including the areas of marketing and public services. Although mobile phones enable a person's position to be located to a certain degree, it is a challenge to acquire sufficient data from people with mobile phones. In order to grasp people flow in its entirety, it is important to establish a practical method of reconstructing people flow from various kinds of existing fragmentary spatio-temporal data such as social survey data. For example, despite typical Person Trip Survey Data collected by the public sector showing the fragmentary spatio-temporal positions accessed, the data are attractive given the sufficiently large sample size to estimate the entire flow of people. In this study, we apply our proposed basic method to Japan International Cooperation Agency (JICA) PT data pertaining to developing cities around the world, and we propose some correction methods to resolve the difficulties in applying it to many cities and stably to infrastructure data.
* Corresponding author.
1. INTRODUCTION
Recently, the monitoring of dynamic changes in people flow has become necessary in order to mitigate secondary disasters following earthquakes, fires, or other major events, as well as to relieve congestion at nodes in terminal stations. For example, more than 12,000 people were killed while trying to escape from the tsunami of the Great East Japan Disaster on March 11, 2011. Moreover, about 4 million people daily ride trains from the Shinjuku Station in Tokyo, the most crowded station in the world. For public facility managers to design safe and comfortable spaces as well as appropriate urban transport policies, it is necessary that they grasp comprehensively the people flow. In the commercial fields of outdoor advertising, price systems, which support effective advertising, depend on each location's traffic volume.
Previous work has been done on population distribution data. For example, the National Center for Geographic Information Analysis (NCGIA) produced the Gridded Population of the World (GPW) in 1995, as the first raster global dataset of population [1]. A second version (GPW2) was produced in 2000 by the Center for International Earth Science Information Network (CIESIN) at Columbia University and used a higher resolution1. Data are gridded on the basis of original census units, at the highest spatial resolution for which they are available by country; two methods are used, the latter of which involves a smoothing method that assumes grids closer to units with high density are higher. Similar information is provided by LandScan, developed by the Oak Ridge National Laboratory (ORNL). LandScan models are tailored to match the data conditions and geographical nature of each individual country and region, and at approximately 1km resolution (30"×30") they provide the finest resolution of global population distribution currently available [2]. Whereas GPW provides nighttime
population, LandScan represents ambient population, meaning the average over 24 hours.
However, according to recent developments in sensing technology, the following examples are ways to measure people flow more dynamically from various dimensions. Especially, mobile phone sensing can be widely applied for taking the above measurement, and some research exists [3-5]. However, such research cannot be regarded as providing infrastructure data that can give an overview of the mass flow by integrating various acquired data mentioned in the previous paragraph. This is true in terms of comprehensive qualities including spatial/temporal accuracy, acquisition/process costs, and value to the user as a service. For example, our group had pointed out the necessity of three aspects of people flow data sets including "sufficiently large scale," "temporal completeness," and "realistic spatial accuracy" [6]. Moreover, mobile phone data for everyone is not usually available, compared with social survey data acquired for public benefits such as transportation or disaster prevention planning.
Hence, our group had proposed a data process for the reconstruction of the spatio-temporal positions of large numbers of people using existing person trip survey (hereinafter referred to as PTS) data, conducted by various transportation planning agencies or commissions consisting of several Japanese cities [6-7]. Some results are summarized on the "People Flow Project" web site. However, some interpolations and corrections will be necessary when applying our proposed core method [6] to various social survey data globally, because each city's zones and network data vary in size.
In this study, we apply the proposed process to Japan International Cooperation Agency (JICA) PTS data pertaining to developing cities around the world, and we resolve the difficulties in preparing infrastructure data such as road network data. Section 2 gives an outline of our proposed method and JICA-PTS data, and a problem statement of our existing method.
Section 3 describes the proposed interpolation and correction methods and gives each result. Section 4 provides a comparison of some cases combining each method, and Section 5 concludes.
2. PRELIMINARIES
2.1 Existing method
Until now, our general method has been that of [6] and the method used for actual applications to five metropolitan urban areas in Japan has been that of [7]. We have performed spatio-temporal reconstruction based on fragmentary spatio-spatio-temporal location information such as person trip surveys to reproduce the spatio-temporal positions of a large number of people at high-resolution time intervals such as every minute. Although a detailed description has been provided by [6], the reconstruction process can be summarized in three steps. First, place information must be converted to latitude and longitude (hereinafter referred to as lat/lon) through an address matching process. Second, each route must be selected according to each origin and destination (hereinafter OD) position of the sub-trip information on the basis of road and railway topology. Third, the spatio-temporal position needs to be interpolated, according to the form of the people flow data set, on the basis of detailed road and railway geometry.
We have two key points about infrastructure data, which strongly support the feasibility of this reconstruction process. One is to use railway timetables as the topology in the process of route selection. Choosing railway routes is also inevitable in order to reconstruct the total people flow, which is not limited to vehicle flow. As for railway timetables, we use the time data between any two stations throughout Japan, available at relatively low cost from an API provided by Val Laboratory Co., Ltd. . The other is to interpolate along detailed network geometry data. As for road and railway networks, we use DRM (Digital Road Map) data , including 4.67 million road network links throughout Japan, provided by Sumitomo Electric System Solutions Co., Ltd. Although these infrastructure data are advanced but limited in Japan, similar data are more widely available in other countries. For example, Open Street Map (OSM) can be used for road network data. Railway timetables may be used depending on the form they take in each country. As for reconstruction accuracy, according to [6], correlation coefficients are high compared with population data from National Census data based on aggregated mesh levels (e.g., a third-level mesh of about 1 kilometer square) at the same time slice.
2.2 JICA-PTS data
The proposed process mentioned in the previous section can be applied to JICA-PTS data. Between 1966 and 2004, JICA has conducted PT surveys in 52 cities [8]; data from the 15 most recently surveyed cities is publicly accessible if the objective of using the data is for public benefit. Parameters such as population, survey year, number of people/trips, and proportions of the various modes of transportation for each city are listed in Table 1. In these surveys, 1-6% of the population was sampled; each person makes an average of 2-3 trips. The ratios of the various modes of transportation vary, and they reflect the transportation policy of each city. For example, 2-wheelers are extensively used in Hanoi; hence, the promotion of public transportation is highly anticipated.
Such fragmentary JICA-PTS data, as well as Japanese domestic data, should be linked with spatio-temporal positions in order to use it as people flow data for various fields.
2.3 Problem statement
When we apply our core method proposed by [6] to various PTS data gathered in various cities by JICA, some other correction and interpolation methods will be needed because of the properties of social survey data. We mention some problems in this section.
First, in questionnaire-based statistics, the time in data tends to be biased toward round numbers such as 7:00 and 7:30. Fig. 2 shows the distribution of departure times of Hanoi city, and almost all departure times for each trip are either X:00 or X:30. This results in moving many people simultaneously, and does not show a continuous transition. Recently, Kernel Density Estimation was applied in many cases for smoothing (e.g. [9][10] in the field of GIS), and we apply this method to temporal smoothing in the next chapter.
Second, we have to know the quality of the road network data when we process a route search and spatio-temporal interpolation using network topology and geometry.OSM, a collaborative project that creates and provides free geographic data such as street maps for public access (sometimes called volunteer geographic information: VGI [11]), was launched because most maps have legal or technical usage restrictions that deter people from using them for creative, productive, and other purposes. OSM has been developed in many cities and has 45 million links (ways) and 600 million nodes as of April 2010. In our study, we use OSM to obtain road network data because the data from major cities around the world are highly developed, and free software for handling OSM has already been provided. For example, in this study we use pgRouting software for route choice.
However, OSM may have insufficient road network topology, because OSM has been developed by many people. Fig.3 illustrates an OSM network cluster and many black isolated links when we extract OSM raw data. That is why some topology corrections are made by creating node-link structures in the next chapter.
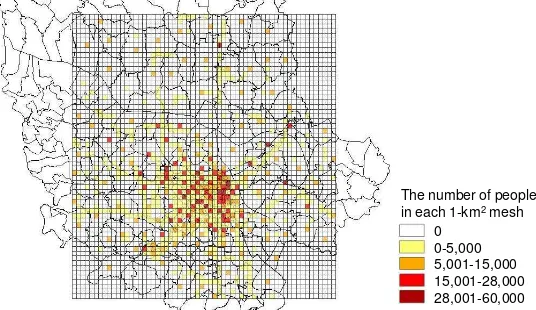
Third, population distribution tends to be reconstructed inhomogeneously and sparsely when there is a wide survey zone[12]. Figure 1 shows the population distribution at 9 a.m. of Hanoi city; the PTS zones of the suburban area except for the central part are quite wide, which results in the central part being biased near the geocoded points. These should be improved using an area interpolation method.
The number of people in each 1-km2mesh
0 0-5,000 5,001-15,000 15,001-28,000 28,001-60,000
Figure 1. Problem of simple geocoding to the centroid of PTS zone.
3. APPROACH
3.1 Our concept
This section explains our concept for resolving some problems mentioned in Section. 2.3. Figure 3 illustrates the total relationship between some correction methods (gray colored part) proposed in this paper and our existing basic method proposed before in [6]. First, we apply spatial smoothing in the geocoding step, although we geocoded each PTS data to the central point coordinate of the PTS zone, which resulted in the sparse distribution shown in Figure 1. Second, we conducted temporal smoothing of the departure time of each PTS trip data, in order to mitigate excessive concentration at one starting time for each trip. Third, we correct road network connectivity, mainly for route choice along network topology and for spatio-temporal interpolation along network geometry. We can acquire a robust PFLOW data set for improving reconstruction accuracy if the qualities of the PTS data in various cities are unstable. We explain temporal smoothing in 3.2, network correction in 3.3, and spatial smoothing in 3.4, because these processes are basically independent.
PTS master data
Geocoding of PTS data (to coordinate of PTS
zone central point)
Spatio-temporal interpolation (along network geometry)
Routing (along network topology)
Temporal smoothing of departure time (of each PTS trip data)
Spatial smoothing in geocoding (to detail level)
Road network data
Network correction for connectivity
Modified road network data
PFLOW data set
Figure 2. Flow of our spatio-temporal correction.
3.2 Temporal smoothing of departure time
In this section, we explain the concept of temporal smoothing. The PTS temporal data comprises round values such as 8:00 and 8:30 because data are manually recorded in the survey sheet. Therefore, we apply Kernel Density Estimation (KDE) in order to smooth the departure time of each trip in the PTS data. There are many researches about KDE such as [13]; one of the most important issues is the selection of kernel functions (such as Epanechnikov, Gaussian, and rectangular functions) and methods for calculating bandwidth (such as the plug-in method, cross-validation method, and Silverman heuristics). In this study, the Gaussian function and Silverman heuristics, most commonly used, are adopted as the kernel function and calculation method, respectively, on the basis of the smoothness of the smoothing result.
Therefore, the bandwidth selectors above presume that true density is either unimodal or multimodal. Further, the bandwidth selectors that presume the true density is multimodal estimate true density either from data themselves or some discretized density estimation.
In addition, there are other methods for selecting bandwidth in existing studies. For example, a subjective choice plots out curves and chooses an estimate that is the most in accordance with the density. The test graph method minimizes the
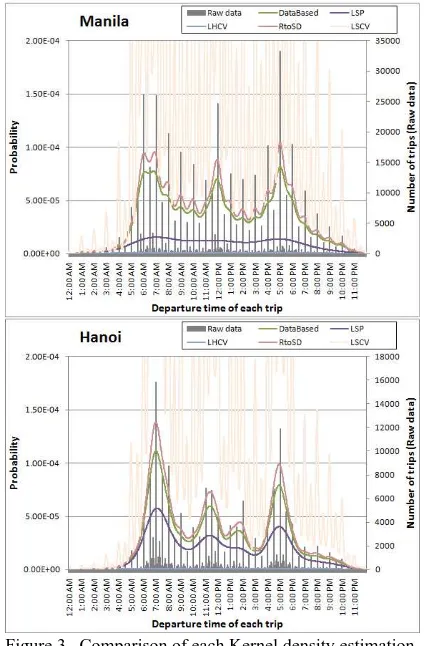
maximum of the error between estimated and true density. These methods were introduced by Silverman [13]. But, there are as yet no approaches to calculate and optimize the bandwidth. Much more detail of our study about application to temporal smoothing of departure time is described in [14]. As for result from [14] Figure 3 shows the result of time smoothing the PT data for four cities (Manila and Hanoi) by comparing the probability density function of the departure time before and after smoothing. Improvement of the biased time can be observed for each city.
Figure 3. Comparison of each Kernel density estimation.
3.3 Network data correction in OSM data
As for OSM data, insufficient topology structure is roughly divided into two types, that is, (a) insufficient nodes and (b) disconnected nodes (Figure 4). In this study, we automatically generate a node where two links cross in the case of type (a) and we connect networks when an isolated network is within some threshold value of another network in the case of type (b). Moreover, we use 5m as a threshold value in the case of type (b), because the number of nodes are almost the same by generation in the case of a 5m/10m threshold value, whereas a disconnected point at about 10m can be seen in the real world. The results of the OSM correction before/after connection in three cities are listed in Table. 1. The table lists the number of nodes, links, groups, links of the largest group, and occupation rate of the largest one before/after connection. The city with the largest number of nodes and links in Manila. However, the increasing rate of nodes in each city is almost 15%, and the rate of links is also approximately 230-270%. As for the largest group, a drastic improvement in connectivity can be seen. Although the occupation rates of the largest group in each city are only 1-5% before connection, the rates after connection are more than 90%.
Next, we check the improvement of route choice based on the improved connectivity mentioned above, comparing the success rate of route search from origin to destination in all OD combinations in each city. In Manila, the success rate was very high even before connection. However, in Hanoi and Jakarta, much improvement was seen as the success rate grew to about 90%.
As well as the success rate, we also investigate the bypass rate, as a specific result of route choice, showing the rate when there is a straight route between origin and destination. Figure 5 means that high bypass rates more than 2.0 show a high occurrence probability in Hanoi and Jakarta before connection. But bypass rates are improved to within a value of 2.0.
Nodes to be
(
a
) Insufficient nodes
(
b
) Disconnected nodes
Figure 4. Topological generation from each OSM data.
3.4 Spatial smoothing in geocoding
Finally, in this section, we explain spatial smoothing in geocoding. If we have house distribution data or some commercial office distribution data, we may achieve more detail smoothing. But considering global and common data properties, it would be more promising to use global data. That is why we use MODIS data as global land use data. MODIS has 19 kinds of land use such as water, forests, savannas, croplands, and urban in each 1km mesh. Figure 6 is an example
of the MODIS data of Hanoi city, and illustrates that many areas are covered by cropland.
Next, we set weight values according to land use in order to do spatial smoothing of people in each PTS zone. Our weights according to each land use, and shows a high value for urban areas and zero value for water, snow, and ice areas. Geocoded positions of people in each PTS zone are prorated on the basis of this weight. Although weight tuning seems to be an interesting topic, it is outside the scope of this research. Figure 7 shows the result of spatially smoothed population distribution reflecting MODIS land use in Hanoi and its non-biased distribution compared with Figure 1. Moreover, its reconstructed accuracy should be validated; the correlation efficient between PFLOW data and LandScan data of each
Figure 6. Example of MODIS data in Hanoi.
City Before connection After connection
No. of
Table 1. Analysis of OSM in each city.
Oc
1 1.31.61.92.22.52.83.13.43.7 4 4.34.6 5 5.35.8
Bypass rate
Figure 5. Comparison of bypass rate before/after connection in OSM of three cities.
Figure 7. Spatially smoothed population distribution reflecting MODIS land use in Hanoi.
0 10000 20000 30000 40000 50000 60000
0 10000 20000 30000 40000 50000 60000
N
u
m
b
e
r
o
f
p
e
o
p
le
in
e
a
ch
m
e
sh
f
ro
m
P
F
LO
W
d
a
ta
Number of people in each mesh from LandScan The number of meshes: 1,751
R=0.73
Figure 8. Correlation between PFLOW data and Land Scan data of each mesh.
4. COMBINATION OF EACH INTERPOLATION METHOD
In the previous chapter, we proposed and showed each result of the three methods for improvement. In this chapter, we evaluate reconstruction accuracy combining each method and show a reconstructed image.
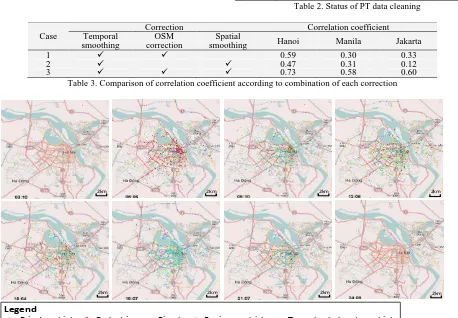
Table. 2 lists the number of people whose origin and destination zone are known and the number of people who succeed in finding route based on OSM as a status of PTS data cleaning. The comparison of the correlation coefficient according to the combination of corrections is shown in Table. 3. Case 3, in which all three corrections are conducted, illustrates the best value in all cities. Moreover, Case 1 shows better value than Case 2. It means that OSM correction is essential but insufficient, and spatial smoothing is required to be certain accuracy. It also has no meaning in applying spatial smoothing without OSM correction. But in Jakarta, reconstruction accuracy is not absolutely high and there remains room for improvement.
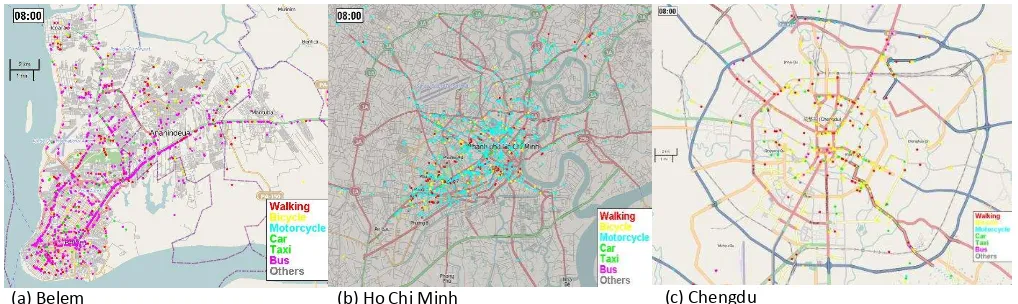
After spatio-temporal interpolation, we reconstruct the people flow in all the cities; the results are shown in Figures. 9 and 10. Figure 9 shows the spatial distribution of people every three hours in Hanoi. The aqua dots representing two-wheeled motor vehicles are notable at commuting time, because the share rate of a two-wheeled motor vehicle is about 70% in Hanoi. Figure 10 shows the distribution at a particular time in some cities. These images enable us to realize the characteristics of each city intuitively.
City
Number of people whose origin and destination
zone are known
Number of people who succeed in finding route
based on OSM Hanoi 63,341 (99.4%) 49,905 (78.3%) Manila 80,824 (97.8%) 67,879 (82.1%) Jakarta 27,974 (99.7%) 23,530 (83.8%)
Table 2. Status of PT data cleaning
Case
Correction Correlation coefficient
Temporal smoothing
OSM correction
Spatial
smoothing Hanoi Manila Jakarta
1 0.59 0.30 0.33
2 0.47 0.31 0.12
3 0.73 0.58 0.60
Table 3. Comparison of correlation coefficient according to combination of each correction
2km 2km 2km 2km
2km 2km 2km 2km
Legend
: Private vehicle : Pedestrian : Bicycle : Business vehicle : Two-wheeled motor vehicle
Figure 9. Transition images taken every three hours in Hanoi.
(a) Belem (b) Ho Chi Minh (c) Chengdu
Figure 10. Spatial distribution of people at 8 a.m. in three cities: (a) Belem, (b) Ho Chi Minh, (c) Chengdu
5. CONCLUSION
In this study, we propose some correction methods for our basic method of reconstruction of people flow, in order to apply it to global social survey data using JICA-PT data. First, temporal smoothing of departure times is conducted by Kernel Density Estimation, which is widely applied in many fields. Specifically, the Least-squares-Poisson selector provides appropriate smoothed results for biased social survey data. Second, road network correction is also effective for improving route choice. Since the automatic topology generation function has been implemented in the OSM community, this kind of correction will be a default process in the OSM database. Third, spatial smoothing is conducted using MODIS land use data. This spatial smoothing along the surface is effective for larger zones, because existing geocoding is at the center point of survey zones and is too centralized.
Finally, we compare reconstruction accuracy combining each correction method. Especially, spatial smoothing has the greater impact and is essential, more so than temporal smoothing and route correction. Moreover, on the basis of these correction methods, we generate continuous spatio-temporal people flow data sets every one minute in some cities and visualize these as an animation. The reconstructed people flow data can potentially be used as infrastructure data in various fields. In the future, we anticipate using real-time tracking via integration with mobile phone data.
Acknowledgements
This work was partially funded by a Grant-in-Aid for Young Scientists (A) by the Ministry of Education, Culture, Sports, Science and Technology in Japan. PT data were lent by JICA in Japan.
References
[1] F. Pozzi, C. Small, G. Yetman, Modeling the distribution of human population with nighttime satellite imagery and gridded population of the world, Earth Observation Magazine 12(1), 2003.
[2] B. Bhaduri, E. Bright, P. Coleman, M. Urban, LandScan USA: A high-resolution geospatial and temporal modeling approach for population distribution and dynamics, GeoJournal 69, 2007, pp.103-117.
[3] M. Gonzalez, C. Hidalgo, A. Barabasi, Understanding individual human mobility patterns, Nature, 453, 2008, pp.779-782.
[4] C. Ratti, R. M. Pulselli, W. Sarah, F. Dennis, Mobile landscapes: Using location data from cell phones for urban analysis, Environment and Planning B: Planning and Design 33(5), 2006, pp.727-748.
[5] J. Reades, F. Calabrese, A. Sevtsuk, C. Ratti, Cellular census: Explorations in urban data collection, IEEE Pervasive Computing 6(3), 2007, pp.30-38.
[6] Y. Sekimoto, R. Shibasaki, H. Kanasugi, T. Usui, Y. Shimazaki, PFLOW: Reconstruction of people flow by recycling large-scale fragmentary social survey data, IEEE Pervasive Computing 10(4), 2011, pp.27-35.
[7] T. Usui, Y. Sekimoto, H. Kanasugi, R. Shibasaki, A comparison of person-trip data for five metropolitan areas and performance of spatio-temporal interpolation, Journal of Infrastructure Planning Review (JSCE) (in Japanese), 27(3), 2010, pp.569-577.
[8] A. Nakamura, T. Hyodo, N. Yamamura, K. Konya, Introduction of JICA urban transportation development survey database, Traffic Engineering (in Japanese) 39, 2004, pp.39-43. [9] S. Xun, Selection of bandwidth type and adjustment side in kerneldensity estimation over inhomogeneous backgrounds, International Journal of Geographical Information Science 24(5), 2010, pp.643-660.
[10] A. Okabe, T. Satoh, K. Sugihara, A kernel density estimation method for networks, its computational method and a GIS‐based tool, International Journal of Geographical Information Science 23(1), 2009, pp.7-32.
[11] M. F. Goodchild, Citizens as sensors: The world of volunteered geography, GeoJournal 69 (4), 2007, pp.211-221. [12] N. Ono, Y. Sekimoto, A. Watanabe, T. Horanont, R. Shibasaki, Analysis of temporal changes in population distribution for distribution of developing cities using social survey data, in: Proc. of Asian Conference of Remote Sensing, 32, 2011.
[13] B.W. Silverman, Density estimation for statistics and data Analysis, Chapman & Hall/CRC, 1986.
[14] H. Shimazaki, S. Shinomoto, Kernel bandwidth optimization in spike rate estimation, Journal of Computational Neuroscience, 29, 2010, pp.171-182.
[15] M. Rudemo, Empirical choice of histograms and kernel density estimators. Scandinavian Journal of Statistics 9(2), 1982, 65-78.
[16] A. W. Bowman, An alternative method of cross-validation for the smoothing of density estimates, Biometrika, 71(2), 1984, pp.353-360.