INSAR OF AQUATIC BODIES
Parviz Tarikhi, Microwave Remote Sensing Research Core, Mahdasht Satellite Receiving Station, Alborz Space Center, ISA, Karaj, Iran [email protected]
Commission VII, WG VII/2: SAR Interferometry
KEYWORDS: Space, Monitoring, SAR, Change Detection, Estimation, Dynamic, Oceanography, Sustainable
ABSTRACT:
Radar remote sensing is a new earth observation technology with promising results and future. InSAR is a sophisticated radar remote sensing technique for combining synthetic aperture radar (SAR) single look complex images to form interferogram and utilizing its phase contribution to land topography, surface movement and target velocity. In recent years considerable applications of Interferometric SAR technique have been developed. It is an established technique for precise assessment of land surface movements, and generating high quality digital elevation models (DEM) from space-borne and airborne data. InSAR is able to produce DEMs with the precision of a couple of ten meters whereas its movement map results have sub-centimeter precision. The technique has many applications in the context of earth sciences such as topographic mapping, environmental modelling, rainfall-runoff studies, landslide hazard zonation, and seismic source modelling.
Nevertheless new developments are taking place in the application of InSAR for aquatic bodies. We have observed that using SAR Interferometry technique for aquatic bodies with the maximum temporal baseline of 16 seconds for image pairs shows considerable results enabling us to determine the direction of sea surface motion in a large area, estimate the sea surface fluctuations in the direction of sensor line-of-the-sight, detect wave pattern and the sea surface disturbance and whether the water motion is bulk and smooth or otherwise. This paper presents our experience and achievements on this new topic through discussing the facts and conditions for the use of InSAR technique. The method has been examined for Haiti, Dominican Republic, Western Chile and Western Turkey coast areas and inland lakes however ground truth data is needed for final verification. This technique scheduled to be applied in some other sites for which the proper data is available.
1. INTRODUCTION
Radar remote sensing is accounted for as a new earth observation technology with promising results and future. Its potentials and capacities as a strong complementary tool along with other remote sensing techniques are undeniable. In course of the years of explorations and examining the new radar technologies, their unique possibilities to comply the needs and answering the questions that the classic optical and thermal remote sensing techniques have been unable or difficult to tackle has grown the expectation that radar technologies can play a key role in bridging the gaps in this connection.
Nowadays, radar remote sensing in general and the Synthetic Aperture Radar (SAR) technique in particular increasingly show their values and potentials. Radar is a useful tool for land and planetary surface mapping. (Thompson, et al., 2001) It is a good mean for obtaining a general idea of the geological setting of the area before proceeding for field work. Time, incidence angle, resolution and coverage area all play important role at the outcome. (Colwell, 1983)
SAR interferometry (InSAR), Differential InSAR (DInSAR) and recently emerging Persistent Scatterer (PS) InSAR are the new techniques in radar remote sensing. (Tarikhi, 2010a) By using InSAR technique very precise digital elevation models (DEM) can be produced which privilege is high precision in comparison to the traditional methods.
InSAR is a sophisticated processing of radar data for combining synthetic aperture radar (SAR) single look complex (SLC) images to form interferogram and utilizing its phase contribution to generate DEM, surface deformation and movement maps and target velocity. The interferogram contains phase difference of two images to which the imaging geometry, topography, surface displacement, atmospheric change and noise are the contributing factors.
Considerable applications of InSAR have been developed, while one of its applications is high-quality DEM generation from space-borne and airspace-borne data with the precision of a couple of ten meters while its movement map results have ordinarily sub-centimeter precision over time spans of days to years. (Henderson, et al. 1998)
Satellite-based InSAR began in the 1980s using Seasat data, although the technique expanded in the 1990s after the launch of ERS-1 (1991), JERS-1 (1992), Radarsat-1 and ERS-2 (1995). They provided the stable well-defined orbits and short baselines necessary for InSAR. The 11-day NASA STS-99 mission in February 2000 used two SAR antennas with 60-m separation to collect data for the Shuttle Radar Topography Mission (SRTM). As a successor to ERS, in 2002 ESA launched the Advanced SAR (ASAR) aboard Envisat. Majority of InSAR systems has utilized the C-band sensors, but recent missions like ALOS PALSAR and TerraSAR-X are using L- and X-band. ERS and Radarsat as well as Envisat use the frequency of 5.375GHz for instance. Numerous InSAR processing packages including IMAGINE-InSAR, EarthView-InSAR, ROI-PAC, DORIS, SAR-e2, Gamma, SARscape, Pulsar, IDIOT and DIAPASON are used commonly.
2. INSAR AND DEM GENERATION METHODS
SAR Interferometry is a technique to detect subtle topographic changes enabling to detect minute variations. Its accuracy is paramount. A number of DEM generation techniques with different accuracies for various means are used. DEMs can be generated through different methods which are classified in three groups that are DEM generation by (i) geodesic measurements, (ii) photogrammetry and (iii) remote sensing. (Tarikhi, 2009)
DEM generation by remote sensing is made in few ways, including stereo-pairs, laser scanning (LIDAR) and InSAR. There are three types of InSAR technique that is single-pass, double-pass and three-pass. In double-pass InSAR, a single SAR instrument passes
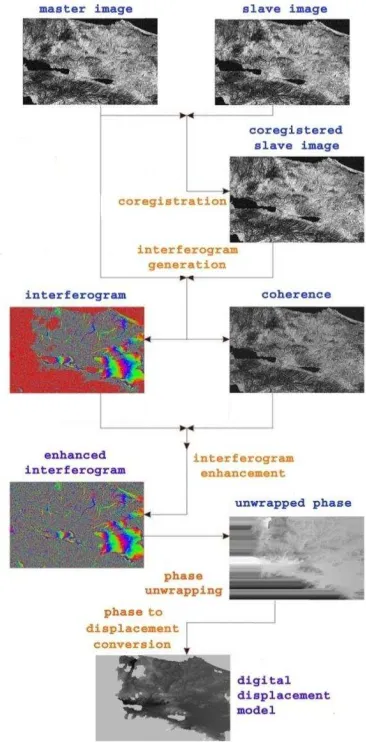
over the same area two times while through the differences between these observations, height can be extracted. In three-pass interferometry (or DInSAR) the obtained interferogram of a double-pass InSAR for the commonly tandem image pairs is subtracted from the third image with wider temporal baseline respective to the two other images (Figure 1).
Figure 1: DInSAR Method flowchart (image source: Author)
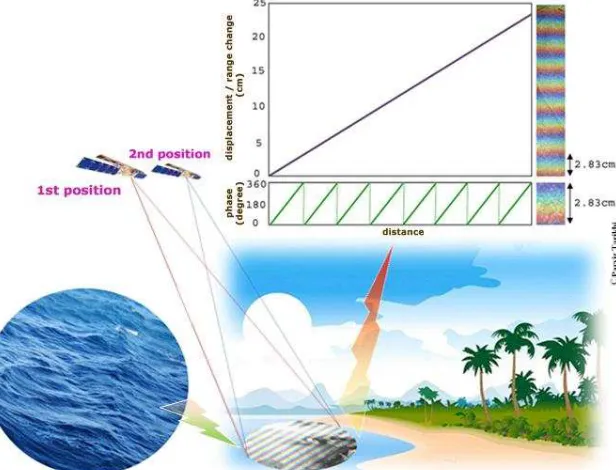
In single-pass InSAR, space-craft has two SAR instrument aboard which acquire data for the same area from different view angles at the same time. With single-pass, the third dimension can be extracted and the phase difference between the first and second radar imaging instruments give the height value of the point of interest using mathematical method. (Henderson, et al. 1998) SRTM (Shuttle Radar Topography Mission) used the single-pass interferometry technique in C- and X-band. Earth’s height model generated by InSAR-SRTM with 90-m horizontal resolution is available while the DEM with 4-to-4.5-m relative accuracy is also available for restricted areas around the globe. (Tarikhi, 2009) When using InSAR technique the resulted interferogram expresses surface deformation in the form of color changes which represents the whole range of the phase from 0 to 2 in a full color cycle. The slight deformation of the surface causes the change of color accordingly; therefore, the steep deformation of the surface corresponds to the steep change of color. In an interferogram moving from red to violet in the pattern indicates that the surface
has moved closer to the satellite (uplift). Change of color bands in the reverse order, indicates that the surface has moved farther to the satellite. Each cycle of colors represents a change in the ground height in the direction of platform that depends on satellite geometry. For instance one cycle in the interferogram generated by the SAR sensors of the Envisat, ERS and Radarsat which use the C-band wavelength of 5.66cm corresponds to the half of the wavelength that is 2.83cm.
Figure 2: Concept of ascending and descending orbits
In practice SAR satellite observes obliquely downward (off nadir) and not directly below (nadir). Therefore, when it is in ascending orbit (northward) the satellite observes from west and in descending orbit (southward) the satellite observes from east (Figure 2). In case of the westward movement of the surface, if satellite observes in ascending orbit (northward), the surface moves near to the satellite. Contrarily, if satellite observes in descending orbit (southward), the ground moves far from the satellite. That is why the ascending and descending SAR images of the same area looks different.
3. COMPARISON; WHY INSAR IS PREFERRED
InSAR ability to generate topographic and displacement maps has been proven in wide range of applications such as earthquakes, mining, landslide, volcanoes. Although other facilities like GPS, total stations, laser altimeters are also used, comparison between InSAR and these tools reveals its reliability. Laser altimeters can generate high resolution DEM and low resolution displacement maps in contrary to InSAR with the spatial resolution of 25m. However, most laser altimeters record narrow swaths. Therefore, for constructing a DEM by laser altimetry, more overlapping images are required. Displacement map precision obtained by terrestrial surveying using GPS and total stations is similar or better than InSAR. GPS generally provides better estimation of horizontal displacement and with permanent benchmarks slow deformations is monitored for years without being concerned about surface de-correlation. The most important advantage of InSAR over GPS and total stations are wide continuous coverage with no or less need for fieldwork. Therefore, wide and continuous coverage, high precision, cost effectiveness and feasibility of recording data in all weather conditions are its main privileges. However, it is important to note that the displacement estimated by InSAR is in the line-of-the-sight direction and to decompose this vector to parallel and normal components the terrestrial data or extra interferograms with different imaging geometry are required. Data availability and atmospheric effects limit using InSAR, however processing of its data is challenging. For each selected
image pair, several processing steps have to be performed. One of the current challenges is to bring the techniques to a level where DEM generation can be performed on an operational basis. Multi pass interferometry is affected by the atmospheric effects. Spatial and temporal changes due to the 20% of relative humidity produce an error of 10 cm in deformation. Moreover, for the image pairs with inappropriate baseline the error introduced to the topographic maps is almost 100 m.
Distinction between SAR imaging and the optical systems are more profound than the ability of SAR to operate in conditions that would cause optical instruments to fail. There are basic differences in the physical principles dominating the two approaches. Optical sensors record the intensity of radiation beamed from the sun and reflected from the features. The intensity of the detected light characterizes each element of the resulting image or pixel. SAR antenna illuminates its target with coherent radiation. Since the crests and troughs of the emitted electromagnetic wave follow a regular sinusoidal pattern, both the intensity and the phase of returned waves can be measured.
InSAR has some similarities to stereo-optical imaging in that two images of the common area, viewed from different angles, are appropriately combined to extract the topographic information. The main difference between interferometry and stereo imaging is the way to obtain topography from stereo-optical images. Distance information is inherent in SAR data that enables the automatic generation of topography through interferometry. In other words DEMs can be generated by SAR interferometry with greater automation and less errors than optical techniques. Moreover, using DInSAR surface deformations can be measured accurately. (Tarikhi, 2009)
4. USING INSAR TECHNIQUE FOR AQUATIC BODIES; A NEW APPLICATION
InSAR techniques are developing rapidly and increasingly. Its civil applications include oceanography (ocean waves, ocean currents, wind, circulation, bathymetry), hydrology, (Kanevsky, 2009) glaciology, seismology, volcanology, land subsidence and uplift studies, change detection, coastal zones monitoring, forestry, cartography, geology, soil science, agriculture, environmental and hazard monitoring, and archaeology, (Henderson, et al. 1998) while its non-civilian applications are reconnaissance, surveillance and targeting, treaty verification and nonproliferation, navigation and guidance, foliage and ground penetration, moving target detection, and target detection and recognition. The domain and extent of the applications of this technique is still rapidly developing and expanding. In course of the years since 1994, studies and verifications by the Microwave Remote Sensing Group that is currently based at the Alborz Space Center (former Mahdasht Satellite Receiving Station) of Iran’s space agency has been carried out continuously on developing the applications of InSAR technique leading to good and valuable achievements. The studies include verifying and investigation of the variety of phenomena namely Izmit quake of August 1999, Bam quake of December 2003, L’Aquila quake of April 2009, Haiti earthquake of January 2010 and Chile earthquake of February 2010.
4.1 Data and Methodology
In continuation of the exploratory work of using Synthetic Aperture Radar Interferometry (InSAR) technique on aquatic bodies in different locations of the above-mentioned study sites the one-and-half-a-year project C1P.8242 under the ESA (European Space Agency) affiliated European Space Research Institute (ESRIN) was started in February 2011 by the Microwave Remote
Sensing Group at the Mahdasht Satellite Receiving Station. ESRIN has secured the needed data for the project. The background of this study and exploratory work goes far back to October 2010 when the author observed that using SAR Interferometry technique for aquatic bodies with the temporal baseline of maximum 16 seconds for image pairs could show considerable results enabling us to estimate the stagger speed of water bodies in coastal areas, the direction of sea surface motion in larger extent, the change in the height of the sea surface in the satellite sensor’s look direction and consequently the sea surface height change trend, wave pattern and the sea surface disturbance and whether the water motion is bulk and smooth or otherwise. Figure 3 illustrates the idea and geometry of the coverage of two successive SLC images. (Kanevsky, 2009)
4.1.1 Study Areas and data used: The method has been examined for three different global areas in tropical zone, southern and northern hemisphere. In the tropical zone we have studied 47 Envisat SLC SAR images of Haiti, Dominican Republic, North Atlantic Ocean, Golfe de la Gonave, Caribbean Sea and Lago Enriquillo acquired in 2010. For southern hemisphere 37 Envisat SLC SAR images of Western Chile and South Pacific Ocean acquired in 2010 have been examined. In the northern hemisphere 1860 Envisat SLC SAR images of Western Turkey including Black and Mediterranean Seas coast areas and inland lakes acquired in 2002-2010 have been studied, however empirical field checkups is still necessary and the job will also be continued for examining other sites around the world for which the relevant data is available. For this application of SAR Interferometry the title of Liqui-InSAR is proposed that refers to the use of SAR interferometry technique for liquid bodies in general that is distinguishable from the SAR Interferometry of solid bodies for which the expression of Solid-InSAR is proposed and that deals with the non-fluid features like soil, sand, vegetation, rocks, snow and other cryo-spheric phenomena.
4.1.2 Methodology: Common image processing and combination techniques used in SAR Interferometry as depicted in Figure 1 was applied benefiting the IMAGINE-InSAR and IDIOT to examine and assess the applicability of the technique for the aquatic bodies. Successful use of SAR Interferometry technique for aquatic bodies requires comparison of the SLC image pairs with very short temporal baselines. For Envisat SLCI data the temporal baseline should be ranging between 8 and 16 seconds. It is because of the technology that is used by synthetic aperture radar system. Normally the image acquisition period for each SLCI is 16 seconds. During this period of time the SAR system transmits a microwave beam in the form of a pulse towards the target and then records the reflections bounced back. Sending pulses and recording the corresponding reflections is repeated regularly but because of the rotation of Earth and satellite movement on a predefined and definite orbit the successive forwarded pulses hit different locations on the land surface which are situated on the strip that is satellite’s track on the land surface in the direction of satellite movement. In practice there is a time overlap between two successive imaging processes that leads to the overlap of the scenes imaged successively. This overlap normally differs between 15 to 60 percent for ERS and Envisat SAR data. This short time baseline is useful for ideally generating DEMs when it is shorter than 10 seconds, and that the parallel component of the virtual baseline decreases, since the parallel baseline component plays key role in generating the interferograms. It is actually a way for producing accurate DEMs benefiting three-pass SAR Interferometry. However it is not as precise as the procedure used
by NASA’s Shuttle Radar Topography Mission (SRTM) which
obtained elevation data on a near-global scale to generate the most complete high-resolution digital topographic database of Earth using a specially modified radar system that flew onboard the Space Shuttle Endeavour during an 11-day mission in February 2000.
Figure 3: Coverage area of two successive SLC images
4.2 How the Technique Works
Using InSAR technique for the aquatic bodies in coastal areas and inland lakes looks promising when it is applied for the image pairs with temporal baselines shorter than 16 seconds. It is easily explained by the basic theory of the interferometry of optical surfaces using the interference of light which, under specific conditions, can produce visual patterns disclosing surface "topography" down to a fraction of a wavelength. Although it is a general discussion, it fits the case of the surface of aquatic bodies that in some sense act as the optical media. In general, the interferometer is an optical device combining two wave-fronts - one reference, perfect, and the other produced by the test surface - in order to produce the interference pattern making test surface visible quite well below the sub-wavelength size level. The simplest and traditional interferometer consists of two surfaces positioned at a slight angle one to another (Figure
4).
Figure 4: Interference pattern formation for straight surfaces (image source: http://www.telescope-optics.net/testing_optical_quality.htm#prevent)
As light passes through the two pieces of glass that is a transparent medium (refraction is negligible at actual angles for principal rays/wave-front), at every section where the gap increases by about 1/2 wave, waves tend to interfere destructively, forming dark lines, so
called interference fringes. Consequently the shape of lines depends directly on the surface shape. If both surfaces are flat, then the interference lines are straight (Figure 4). If one or both surfaces are curved, the dark lines of destructive light interference will be of circular form (Figure 5) provided the surface possesses rotational symmetry. Surface irregularities will cause deviation of the interference lines from straight, curved or circular line form and can be measured to a small fraction of a wavelength.
Since conic aberrations cause different form of wave-front deformations, they also show distinctly different interferometric patterns (and since wave-front deformation relative to a reference sphere varies with focus point within the aberrated focus zone, interferogram patterns will also be different for best focus in comparison to other focus points for each particular aberration). The fringe spacing in a single-pass interferometer corresponds to
λ/2 differential on the surface, or λ on the wave-front; in a
double-pass interferometer fringe spacing corresponds to half as large surface/wave-front differential. The same explanation applies for the moving surface layers of aquatic bodies that practically act as the optical/transparent surfaces when beamed by radar waves. (Sacek, 2006)
Figure 5: Interference pattern formation for curved surfaces (image source: http://www.telescope-optics.net/testing_optical_quality.htm#prevent)
5. RESULTS
In Figure 6 a diagram of the application of Liqui-InSAR technique is given. Two samples of the results for the Western Haiti and Western Turkey coastal zones are given below (Figure 7, Figure 8 and Figure 9) however the comprehensive collection of the products
Figure 6: Diagram clarifying Liqui-InSAR technique
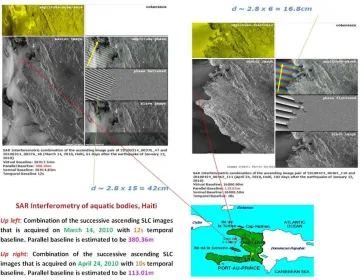
Figure 7: Liqui-InSAR for Western Haiti coastal zone
obtained by the use of Liqui-InSAR technique that provides a clear insight on the topic is accessible to those who are interested in the subject and submit their request to the author at the contact address provided in this paper.
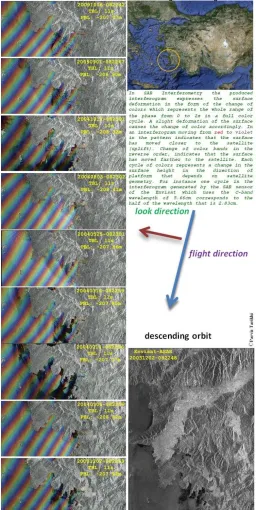
Figure 7 shows how the sea surface behaves differently in the evening of March 14 and April 2010. The uplift of the sea surface on March 14 is 2.5 times bigger than the uplift for April 24. The speed of the movement is also assessable by counting the number of fringes and multiplying it to the half of the wavelength value. Although it is an instantaneous estimation, it reflects the sea surface attitude which could be useful for coastal zones synoptic monitoring and management. In Figure 8 the images produced using InSAR technique give an estimation of the sea surface attitude in South Western Haiti on January 19, 2010. The shape of the sea surface deformation is considerable. The deviation from straight lines suggests an uplift of the sea water eastward. (Tarikhi, 2010b)In Figure 9 the interferometric products of the combination of 18 SLC images of the coastal zone in South Western Turkey are compared. The sea surface attitude and the shape of the surface instantaneous deformation and its speed differs from one pair to other but the direction of the sea surface movement seems to be the same for all pairs in different times in monthly and yearly basis. It is noteworthy that using Liqui-InSAR for short baselines as we examined, almost for the majority of the image pairs for whichthe interferometric combination is successful, when the order of master and slave images are changed respectively, the results looks a bit different. It could be because of the fact that the incidence of specific phenomena could lead to the variety of phenomena that we might not be able to detect or cover them. When we move to past, then some phenomena’s effect may be disregarded that could probably lead to the different result with what we experienced normally. In other words the slave image contains the information about the phenomena that might be initiated from or the sequence of the phenomena which information contained in the master image. However, the reciprocal case does not necessarily apply in general. The reason could in addition to what explained above be
due to the procedure that is used for co-registration of the master and slave images. For co-registration the applied software searches the points in the slave image that have correlation with the corresponding points on the master image. When we change the sequence then the selection process could not be necessarily the same as what carried out in the earlier case.
Figure 8: Liqui-InSAR for South-Western Haiti coastal zone
Figure 9: Liqui-InSAR for Western Turkey coastal zones
6. CONCLUSION AND SUGGESTIONS
The results achieved by combining the available SAR image pairs of the areas that are acquired successively with maximum temporal baseline of 16 seconds looks interesting and considerable for the aquatic bodies. Although it is usually assumed that the application of SAR Interferometry technique is not worthy for water bodies, the results suggests different idea. Instantaneous movement of aquatic bodies is synoptically recognizable using this technique with sub-centimeter accuracy. It is potentially useful for both the oceanographic and Earth observation studies.
The parallel baseline component plays key role in producing interferograms. The direction of sea water movement as well as rate of displacement can be estimated using this technique.
Knowing the direction of the motion of sea water surface and its long term trends could be useful for coastal zone management and the interaction of sea water and coastal areas. There could be other potential benefits that need to be further investigated and studied. By increasing the coverage area of the successive SAR images access to the information about the behavior of the sea water movement in larger extent would be possible. A suggestion
could be the use of a system similar to NASA’s STS-99 mission
that used two SAR antennas with 60-m separation to collect data for the Shuttle Radar Topography Mission (SRTM), however the imaging procedure by two antennas can be carried out with a small delay ranging between 8 and 15 seconds. The idea needs to be examined and tested for various cases and different locations. The wavelength used by radar antenna could also play a key role. Making the similar experiments, which has been carried out by C-band SAR systems, for SAR systems that work in other C-bands particularly L- and X-bands is expected to show new and considerable results.
Using single-pass InSAR, the data for same area from different view angles can be acquired. The temporal and perpendicular baselines are then tend to zero and as a result the parallel baseline component remains only that would make precise assessments of the aquatic body displacement and its direction of motion possible.
SAR satellites are still few in number, which is the main limitation in the stream of imagery, and the requirements for collection of repeat images that can be used to generate interferograms are stringent. As a result, useful image pairs, even in large archives of imagery, are not common. The successful application of InSAR requires seamless cooperation among several agencies. Further development of this promising technique depends on expanding and strengthening interagency and international coordination in the acquisition of SAR data, including the launching of additional L-band or multiband SAR satellites.
References
Colwell, Robert N., 1983. Manual of Remote Sensing, Vol. I (2nd ed.). American Society of Photogrammetry, (Chapter 10), pp. 429-475.
Henderson, Floyd M., Lewis, Anthony J., 1998. Principles and Applications of Imaging Radar, (3rd Ed.). John Wiley & Sons, Inc., (Chapter 6), pp. 359-380.
Kanevsky, Mikhail., 2009. Radar Imaging of the Ocean Waves, (1st ed.). Oxford, UK: Elsevier B.V., (Chapter 7).
Sacek, Vladimir, 2006. Notes on AMATEUR TELESCOPE OPTICS, http://www.telescope-optics.net/index.htm (12 December 2011).
Tarikhi, Parviz, 2009. DEMs from InSAR, Position Magazine, Issue 43, October & November 2009, pp. 39-42.
Tarikhi, Parviz, 2010a. InSAR: a new generation, Position Magazine, Issue 50, Dec. 2010 & Jan. 2011, pp.42-46.
Tarikhi, Parviz, 2010b. Using InSAR Technique for Water Bodies, http://parviztarikhi.wordpress.com/features-2/using-insar-technique-for-water-bodies/ (10 December 2011)
Thompson, A. Richard, Moran, James M., Swenson, George W., 2001, Interferometry and Synthesis in Radio Astronomy (2nd ed.), Wiley-VCH Verlag GmbH
Acknowledgement
All of the SLC images for this study were provided by the European Space Research Institute (ESRIN) of the European Space Agency (ESA) to both of which kind appreciations are extended.