www.elsevier.nlrlocateraqua-online
Microsatellite-associated heterosis in
hatchery-propagated stocks of the shrimp Penaeus
stylirostris
Nicolas Bierne
a,b,), Ivan Beuzart
a, Vincent Vonau
a,
Franc
¸
ois Bonhomme
b, Edouard Bedier
a, AQUACOP
a´
a
Laboratoire d’Aquaculture Tropicale, IFREMER, Centre Oceanologique du Pacifique BP 7004, Tara´ Õao,
Tahiti, French Polynesia
b
Laboratoire Genome, Populations, Interactions, CNRS UPR 9060, Uni´ Õersite Montpellier II, F-34095´
Montpellier, France
Accepted 4 October 1999
Abstract
Correlation between DNA microsatellite heterozygosity and growth rate was investigated in two hatchery-propagated stocks of the shrimp Penaeus stylirostris, which had been genetically isolated from wild founders for 17 generations, and from each other for five more generations. Presumed demographic history of these populations suggested that they were maintained at small effective population sizes, and this was confirmed by significant changes in allelic frequencies
Ž .
between the two stocks. Despite a small sample size ns60 and a small number of loci screened, a significant positive correlation was detected between microsatellite tri-locus
heterozy-Ž . Ž .
gosity and growth rate in one of the two stocks rs0.3, Ps0.02 . In the other stock ns48 , the positive correlation was not significant, but the combined test of single locus heterozygote
Ž .
advantage over the three loci was significant Ps0.005 .
Use of DNA microsatellite markers, whose selectively neutral status is generally accepted, allowed us to reject the hypothesis of direct overdominance at marker loci as an explanation for an association of growth rate with heterozygosity. The average depression associated with one locus in our case is above or equivalent to the amount observed for a 10% increase of inbreeding in other species. These results suggest that heterozygosity at neutral marker loci is sufficiently well correlated with individual inbreeding coefficients to reveal a significant residual inbreeding load
)Corresponding author. Laboratoire Genome, Populations, Interactions, Station Mediterraneenne de l’En-´ ´ ´
vironnement Littoral, 1 Quai de la Daurade, 34200 Sete, France. Tel.:` q33-4-67-46-33-88; fax:q 33-4-67-46-33-99.
Ž .
E-mail address: [email protected] N. Bierne .
0044-8486r00r$ - see front matterq2000 Elsevier Science B.V. All rights reserved.
Ž .
for growth rate in Tahitian P. stylirostris stocks. Inbreeding during hatchery propagation was, thus, insufficient to purge the ancestral load. q2000 Elsevier Science B.V. All rights reserved.
Keywords: Microsatellites; Inbreeding depression; Marker-associated heterosis; Heterozygosity; Penaeus stylirostris
1. Introduction
Although the world penaeid shrimp culture industry still relies largely on wild
Ž .
broodstock Pullin et al., 1998 , an industry completely based on hatchery-propagated stocks has been developed in several places, such as the French Pacific overseas
Ž .
territories French Polynesia and New Caledonia . The achievement of control of
Ž .
maturation and spawning by IFREMER in the late 1970s AQUACOP, 1979 led to the development of closed populations imported for commercial production. Since an
Ž .
infectious hypodermal and hematopoietic necrosis virus IHHNV resistant strain of
Ž .
Penaeus stylirostris SPR 43 strain, Weppe et al., 1992 was obtained in 1989, it has
become the main cultivated strain in these territories. The last importation of P.
stylirostris wild founders was from South America in 1980. Thus, a study of the genetic
Ž .
variability after more than 15 years 22 generations of culture was considered essential. Founder effect and genetic drift decrease the ancestral genetic variability of small populations, variability which is supposed to be essential for the initiation of
domestica-Ž .
tion Sunden and Davis, 1991 . However, an increase in inbreeding giving rise to inbreeding depression may lead to poorer performance and even to population extinc-tion. A slow increase of inbreeding, though, could purge the genetic load, as
experimen-Ž .
tally demonstrated in Drosophila melanogaster by Latter et al. 1995 , without losing considerable useful genetic variability, when favorable alleles are already at high frequency in wild populations.
Genetic marker-assisted study of penaeid species has been hampered by extremely
Ž
low levels of allozyme variation Mulley and Latter, 1980; Hedgecock et al., 1982;
.
Laubier et al., 1984; Sbordoni et al., 1987 . The development of new highly variable
Ž
DNA markers makes it possible to overcome this difficulty Bagshaw and Buckholt,
.
1994; Garcia et al., 1994; Wolfus et al., 1997 . Microsatellites appear to be appropriate markers to observe residual variability in long-cultured stocks such as those in Tahiti.
Ž
Correlations between allozyme multilocus heterozygosity MLH, number of
heterozy-.
gous loci per individual and fitness-related traits such as growth, viability or physio-logical parameters have been under study for decades. Positive correlations have been
Ž .
reported for various organisms, especially marine bivalves Zouros, 1987 , salmonid
Ž . Ž . Ž
fishes Leary et al., 1984 , and pine trees Bush et al., 1987 see Mitton and Grant,
.
Ž .
Population genetic models have been developed review in David, 1998 explaining
Ž .i the gene heterozygosity–fitness correlation Turelli and Ginzburg, 1983; Smouse,Ž
. Ž .
1986; Mitton, 1993; Deng and Fu, 1998 , and ii neutral marker heterozygosity–fitness
Ž .
correlation due to association with selected genes deleterious or overdominant in small
Ž .
populations Ohta, 1971, 1973; Ohta and Kimura, 1970, 1971; Zouros, 1993 or in
Ž
populations with partial inbreeding Ohta and Cockerham, 1974; Strobeck, 1979;
.
Charlesworth, 1991; Zouros, 1993 . Nevertheless, as the neutral status of allozymes is questionable, the debate was at first concentrated on the comparison of two hypotheses: the ‘‘direct overdominance’’ hypothesis that treats allozymes as the causative agent of
Ž
the correlation, versus the ‘‘associative overdominance’’ hypothesis Ohta, 1971; Zouros
.
et al., 1980 where neutral markers are indicators of genetic conditions responsible for
Ž .
the correlation. More recently, David et al. 1995 proposed a further partition of the ‘‘associative overdominance’’ hypothesis into the ‘‘local effect’’ hypothesis where markers reflect variation at fitness loci localized in their chromosomal vicinity, and the ‘‘general effect’’ hypothesis where homozygosity at marker loci correlates with overall
Ž .
genomic homozygosity in partly inbred populations also see David, 1998 . However, bottlenecks enhance linkage disequilibrium as well as inbreeding, and the partition of associative overdominance into local and general effects is presently not well understood
ŽZouros, 1993 ..
The development of a new class of genetic marker loci exhibiting variation in non-coding DNA sequences, and which are most unlikely to be anything other than selectively neutral, allows a new approach to this problem, as only ‘‘associative
Ž
overdominance’’ can apply in this case Zouros and Pogson, 1994; Bierne et al., 1998;
. Ž .
Pogson and Fevolden, 1998 . Pogson and Zouros 1994 found in the scallop
Pla-copecten magellanicus, a MLH-growth correlation with seven allozyme loci, while a set
Ž .
of eight nuclear DNA loci restriction fragment-length polymorphisms, RFLPs failed to produce a significant correlation. A second test of the associative overdominance
Ž .
hypothesis using DNA markers was published by Pogson and Fevolden 1998 , showing a positive correlation between growth rate and RFLP marker heterozygosity at 10 loci within a single population of Atlantic cod, Gadus morhua.
Use of the three microsatellite loci recently developed in the shrimp P. stylirostris
ŽVonau et al., 1999 , and a heterologous locus from P.. Õannamei Garcia et al., 1996 ,Ž .
allowed us to study the MLHrgrowth correlation at presumably neutral genetic markers, within closed populations that had been maintained at small effective sizes for 22 or 24 generations. We explore the possibility of using marker-associated heterosis to evaluate,
Ž .
with Ohta’s 1971, 1973 formula, the residual inbreeding load in such inbred popula-tions with unknown pedigrees.
2. Materials and methods
2.1. History of the populations studied
The last import of P. stylirostris wild founders from Mexico to two IFREMER
Ž . Ž .
Ž .
industry developed more quickly in New Caledonia, SASV used more breeders Nf100
Ž .
at each reproduction than the COP experimental hatchery Nf20 . However, it cannot be ruled out that these populations went through stronger genetic bottlenecks than these optimistic values might suggest. In 1988, the COP stock became extinct, and was reinitiated following the import of a part of the SASV production at the post-larvae stage. Since 1989, no transfer of breeders has been made between the two hatcheries. A genetic improvement program began at the COP facilities in 1992. We used one stock
Ž
from this program, where the number of breeders selected was 24 16 males and eight
.
females at each generation. This led to an effective population number Nes Ž4 N Nm f. Žr NmqNf.s21.33, where Nm is the number of males and N the number off
Ž .
females. In Tahiti, a second hatchery Ecloserie Polyvalente Territoriale, EPT was constructed in the late 1980s. This hatchery depended on the COP breeders until 1993, when it started to use its own breeders only. The presumed demographic histories of the COP and EPT populations are summarized in Fig. 1.
2.2. Sampling
A first sampling of 30 individuals from the EPT population was made without
Ž . Ž .
phenotypic characterization EPT-g0 in late 1996 Vonau et al., 1999 . A second sampling, including sex determination and weighing of 48 individuals, was done two
Ž .
generations later, in late 1997 EPT-g . Two further samplings, each of 30 individuals,2
Ž
were made at two different times in early 1997 in the same COP population t : mean1
.
weights26.8 g, t : mean weight2 s43.1 g . Each individual was sexed, weighed, and sampled for hemolymph. The hemolymph was diluted in an anticoagulant, Alsever
Ž
solution pH 7 30 mM trisodium citrate, 115 mM glucose, 338 mM NaCl, 10 mM
.
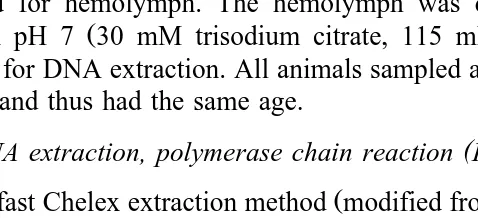
EDTA for DNA extraction. All animals sampled at the same time belonged to the same cohort, and thus had the same age.
( )
2.3. DNA extraction, polymerase chain reaction PCR procedures and electrophoresis
Ž .
The fast Chelex extraction method modified from Singer-Sam et al., 1989 was used.
Ž .
Hemolymph samples corresponding to one million cells were centrifuged at 6000=g
Fig. 1. Presumed demographic and inbreeding histories of the COP and EPT hatchery-propagated P. stylirostris stocks.DF is the expected inbreeding increment per generation, N is the population size, and f is the expected mean inbreeding coefficient of the stock when sampled. Estimated Fst values between pairs of populations and their significance level, are specified:U
P-0.05,UU
P-0.01,UUU
Ž
for 2 min. The supernatant was saved and 500ml of 5% chelating resin Chelex, Biorad,
. Ž .
Richmond, VA, USA and 5ml of proteinase K 10 mgrml were added to each sample tube. The mixtures were shaken and heated for 4 h in an incubator at 558C, then vortexed, heated again at 1008C for 15 min, vortexed a second time and centrifuged at 10,000=g for 2 min. The supernatant was stored at y208C until it was used as template for PCR.
Ž
Three P. stylirostris microsatellite loci, namely Pstyli.05 tandem repeat:
dinucleo-. Ž
tide, GenBank accession number: AF097487 , Pstyli.19 tandem repeat: mono and
. Ž
dinucleotide, GenBank accession number: AF097488 and Pstyli.09 tandem repeat:
. Ž
dinucleotide, GenBank accession number: AF097489 full details are given in Vonau et
.
al., 1999 and a heterologous locus from P. Õannamei, called Vanna.02, were used. Vanna.02 primers were designed from the published sequence of a microsatellite ŽGarcia et al., 1996 in two flanking open reading frames which are thought to be highly.
conserved across taxa: Primer 1s5X-GGATAACACTGATTAGATATCACGG-3X and Primer 2s5X-TAAATGTACACGAGATGCACC-3X. This marker was screened only in the EPT samples.
All other heterologous microsatellite loci which were tried, from P. monodon
ŽBrooker et al. in press and P. japonicus Moore et al., 1999 , and for which primers. Ž .
were designed a priori in non-coding sequence, failed to amplify. This is in accordance
Ž . Ž
with the results of Moore et al. 1999 , and with two mtDNA analyses Palumbi and
.
Benzie, 1991; Baldwin et al., 1998 which revealed that morphological similarity in penaeids masks very large genetic differences.
A PCR mixture of 12ml, containing 0.5mM of each primer, 2 mM MgCl , 0.2 mM2
Ž
of each dNTP and 0.25 unit of red Goldstar DNA polymerase Eurogentec, Liege,
`
.Belgium , was added to 3ml of DNA solution during the first 2 min–948C denaturing
Ž . Ž
stage of the PCR program Hot Start . Thirty PCR cycles 30 s at 948C, 1 min at the
.
optimum hybridization temperature, 1 min at 728C were run in a PTC 100
pro-Ž .
grammable thermal controller MJ Research, Waltham, MA, USA . PCR products were
Ž
electrophoresed through 6% polyacrylamide gels acrylamide: bisacrylamide, 29:1, 7 M
.
urea using 0.5 X Tris-Borate-EDTA buffer. The gels then were silver-stained according
Ž .
to Bassam et al. 1991 .
2.4. Genetic diÕersity analyses
Ž .
Allele frequencies, observed and unbiased expected heterozygosities Nei, 1978 , and
Ž . Ž . Ž
Weir and Cockerham 1984 estimation of Wright’s 1951 F-statistics F , whichis
Ž .
measures within-population departures from Hardy–Weinberg equilibrium HWE , and
.
F , which quantifies genetic differentiation between pairs of populations were com-st
Ž .
puted using the GENETIX3.3 software Belkhir et al., 1996–1999 . Departure of F andis Fst from zero was tested using the permutation approach provided by this software. Where more than one test was performed, the probability threshold level was adjusted according to the Bonferroni procedure.
2.5. Variance of allelic frequencies
Estimates of variance of allele frequencies were made according to the theory of
Ž .
Ž .
variance of allelic frequencies, Fc Nei and Tajima, 1981 , were computed for each pair of samples and compared to expectations under the presumed demographic parameters.
Ž .
When applicable the same population at two different times , per-generation effective population sizes, N , also were estimated.e
2.6. Linkage disequilibrium
Ž . 2
Weir’s 1979 two-locus correlation coefficient, R , was estimated using Black and
Ž .
Krafsur 1986 method and its departure from zero was tested using a permutation approach provided by the procedure LINKDIS in Genetix. The expected correlation corresponding to the effective sizes estimated for the various presumed demographic histories and the assumption of no physical linkage between loci were calculated using
Ž .
where c is the recombination rate between the two loci here, we assumed they were
. Ž
unlinked and used 0.5 , n is the sample size, and N is the effective population size wee
have taken the harmonic mean of the presumed real population sizes over the 22 or 24
.
generations . The last term in the equation is a correction for monogamy. The haploid
Ž .
chromosome number in P. stylirostris is 46 Nakaura et al., 1988 , so the probability of a physical linkage between a pair out of three microsatellites picked up at random is small.
2.7. MLHrgrowth correlation
Ž
Since no difference in weight was detected between males and females Fs0.22,
dfs29, Ps0.64 for COP-t ; F1 s2.13, dfs29, Ps0.155 for COP-t ; F2 s0.17;
.
dfs47; Ps0.68 for EPT-g , the data for sexes were pooled. To facilitate compar-2
isons among samples and to obtain a normally distributed variable, individual weight was log -transformed and expressed in standard deviation units from the sample meane
Žstandardized deviates . The locus-specific effects of heterozygosity on growth were.
expressed as:
dsMSH etyMSHom
Ž .
2MSH etand MSHom being the mean standardized growth in heterozygotes and
homozy-Ž .
gotes, respectively Gaffney, 1990; Bierne et al., 1998 . A homozygote depression for growth was calculated using the formula:
WHo m
ds1y
Ž .
3WHet
simple ANOVA. For locus Vanna.02 in the EPT population, only one individual appeared heterozygous, but it was the largest of all individuals in the sample. The standardized deviate of this individual was two-tailed tested against the normal distribu-tion. For the COP population, a test of homogeneity of variance between the two
Ž
samples, t and t , was performed. As the homogeneity was rejected F1 2 s0.39; dfs29;
.
Ps0.006 , data were not pooled, but unilateral P-values for the different tests were
Ž
combined sample by sample according to Fisher’s procedure Sokal and Rohlf, 1996, pp.
.
794–797 . P-values also were combined locus by locus.
Standardized deviates were plotted on MLH and the relationship between the two parameters was expressed as the product-moment correlation r. The significance of r
Ž .
was tested by a t-test Sokal and Rohlf, 1996, pp. 574–575 . To combine the two
Ž .
samples in the COP population, the average r after z-transformation was computed
Ž
after homogeneity among the two correlation coefficients was tested Sokal and Rohlf,
.
1996, pp. 581–582 .
3. Results
3.1. Genetic diÕersity
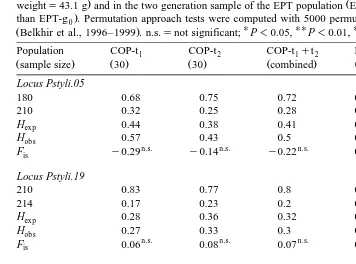
Allele frequencies, observed and expected heterozygosities and estimated Fis values are presented in Table 1. Heterogeneity of allele frequencies, as well as that of genotypic frequencies between the two COP samples was always rejected and allowed us to pool
Ž
the data results on genotypic frequencies; Pstyli.05: Ghs0.344, Ps0.56; Pstyli.19: Ghs0.014, Ps0.9; Pstyli.09: Ghs0.91, Ps0.34; overall test: x2s7.69, dfs6,
.
Ps0.26 . The number of alleles was two for locus Pstyli.05, except in the EPT-g0 sample which was monomorphic. It was also two for locus Pstyli.19 in each population, and four for locus Pstyli.09. The data for locus Vanna.02 in the EPT-g population are2
not presented in Table 1, as only one individual of the 48 analyzed was heterozygous, all
Ž .
other individuals being homozygous allele frequencies: 400s0.99, 398s0.01 . As shown by F tests, no significant departure from HWE was observed in the COPis
population after Bonferroni adjustment, and F for the pooled data was not significantis
ŽFiss0.03, n.s. ..
On the other hand, the EPT-g0 population exhibited significant heterozygote
defi-Ž . Ž
ciency at loci Pstyli.05 Fiss0.79, P-0.001 and Pstyli.09 Fiss0.24, 0.01-P
-. Ž .
0.05 , and an overall significant heterozygote deficiency Fiss0.37, P-0.001 . This
Ž
trend was confirmed in the EPT-g2 population at the Pstyli.09 locus Fiss0.4,
.
P-0.01 . Such heterozygote deficiencies could be explained by typing artifacts such as null alleles, population substructuring or preferential reproduction between relatives. Other hypotheses such as homogamy, genetic imprinting or selection against
hetero-Ž .
Segre-Table 1
Allele frequencies, observed and expected heterozygosity, and F at three microsatellite loci in two temporalis Ž
samples of the same generation of the P. stylirostris COP population t : mean weights26.8 g, t : mean1 2
. Ž
weights43.1 g and in the two generation sample of the EPT population EPT-g is two generations younger2 .
than EPT-g . Permutation approach tests were computed with 5000 permutations with the Genetix software0
Ž . U UU UUU
Fis y0.29 y0.14 y0.22 0.79
Locus Pstyli.19
220 0.28 0.35 0.315 0.24 0.24
222 0.45 0.38 0.415 0.17 0.17
Hexp 0.66 0.68 0.66 0.68 0.72
gation of non-amplifying alleles could be a possible explanation of these heterozygote
Ž .
deficiencies, as it is suspected at least for locus Pstyli.09 see next section .
3.2. Suspicion of a PCR artifact at the Pstyli.09 locus
Ž
Two reverse primers were designed for locus Pstyli.09. One of them sequence:
X X
.
5 GTAATTATTATCGAACACCCGG-3 failed to amplify allele 210 and was rejected,
Ž .
and the other was published Vonau et al., 1999 . The COP population was analyzed with both reverse primers and the genotypes were deduced from the two data sets. Of the 60 individuals analyzed, scoring of two false homozygotes in sample-t and three in1
sample-t , were corrected by result of a second amplification with one or the other2
reverse primer. Segregation of null alleles is, therefore, suspected, and could explain in part the heterozygote deficiency observed in sample-t2 of the COP population. It
Ž .
exhibited a highly significant deficit Fiss0.43, P-0.01 due to three false
homozy-Ž .
We can calculate the frequency of a null allele explaining Fiss0.4 in the EPT-g2
population: pof0.2. For a sample of 48 individuals, the expected number of null homozygotes is only 48 po2f2, which is consistent with the result that none were observed. If null alleles effectively segregate in the population, this could also explain the inability to detect heterotic effects at this locus in this population.
3.3. Drift analyses
Estimates of allele-frequency variance, F , expected F under presumed demographicc c parameters and the resulting estimate of EPT effective population size, N , are presentede in Table 2. Over the two generations of drift between EPT-g0 and EPT-g , N was2 e
Ž w x.
estimated to be 13.6 95% CIs 2,81 , whereas it was expected to be 100 knowing the presumed management of progenitors in this hatchery. Despite the large variance in the
N estimation, due in part to the small number of loci used, this estimate is consistente
with an effective population size being smaller than the census size. This is roughly confirmed by the larger variance of allelic frequencies between EPT-g2 and COP than
Ž
would be expected for 12 generations at Nes37.5 harmonic mean of the census
.
population size over the generations . On the other hand, variance of allelic frequencies between EPT-g and COP is in accordance with the presumed demographic histories of0
the respective stocks.
3.4. Linkage disequilibrium
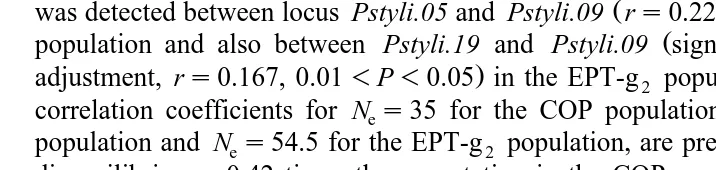
Two-locus correlation coefficients are presented Table 3. No significant linkage disequilibrium was detected in the COP population. A significant linkage disequilibrium
Ž .
was detected between locus Pstyli.05 and Pstyli.09 rs0.223, P-0.01 in the EPT-g0
Ž
population and also between Pstyli.19 and Pstyli.09 significant without Bonferroni
.
adjustment, rs0.167, 0.01-P-0.05 in the EPT-g2 population. Expected two-locus correlation coefficients for Nes35 for the COP population, Nes52 for the EPT-g0 population and Nes54.5 for the EPT-g2 population, are presented in Table 3. Linkage disequilibria are 0.42 times the expectation in the COP population and 0.88 times the
Table 2
Variance of allelic frequencies, F , between pairs of populations, expected F from the presumed demographicc c
histories and estimation of EPT effective population size, Ne
EPT-g –EPT-g0 2 COP–EPT-g0 COP–EPT-g2
Pstyli.05 0.4 0.035 0.56
Pstyli.19 0.05 0.266 0.484
Pstyli.09 0.017 0.174 0.203
Ž . w x w x w x
Fc 95% CI 0.1 0.04,0.61 0.165 0.06,0.96 0.33 0.12,1.9
a b c
Expected Fc 0.038 0.175 0.178
Ž . w x
Ne 95% CI 13.6 2,81 – –
a
Expected F with Nc es100 over two generations.
b
Expected F with Nc es33.3 over 10 generations.
c
Table 3
Correlations of gene frequencies. Correlation coefficients, R, and permutation approach tests were computed
Ž . U UU UUU
with the Genetix software Belkhir et al., 1996–1999 . P-0.05, P-0.01, P-0.001
Pair COP-t1qt2 EPT-g0 EPT-g2
Pstyli.05 – Pstyli.19 0.073 0.162 –
UU
Pstyli.05 – Pstyli.09 0.096 0.223 –
U
Pstyli.19 – Pstyli.09 0.097 0.111 0.167
Mean 0.088 0.165 0.167
Expected R with Nes52.
c
Expected R with Nes54.5.
expectation in the EPT population. Using Nes13.6, linkage is less than half that
Ž
expected in the EPT population when Nes13.6, Rs0.32 with ns29 and Rs0.3
.
with ns48 . Because linkage disequilibrium appears lower than that expected, it does not support a smaller effective population size than the census number.
3.5. Heterozygosity–growth correlation
The single-locus growth differentials among heterozygotes and homozygotes, and the corresponding tests are presented in Table 4. Combining the two samples, the COP population exhibited significant d at the single test level for two loci, Pstyli.05 and
Pstyli.09, out of three and the combined probability over the three loci was significant ŽPs0.014 . In the EPT population, only differences in growth among genotypes at.
locus Pstyli.19 was significant at the single test level, but the combined probability over
Ž .
the three loci was highly significant Ps0.005 .
Table 4
Growth comparison between single-locus heterozygotes and homozygotes. d is the mean standardized growth in heterozygotes minus the mean standardized growth in homozygotes.d is the homozygote depression for growth measured as percentage of heterozygotes mean weight. n.s.snot significant;UP-0.05,UUP-0.01,
UUU
P-0.001
COP-t1 COP-t2 COP-t1qt2 EPT-g2
U n.s. n.s.
Pstyli.05 ds0.52 ds0.60 ds0.56 –
Ž .
ds8"7% ds6"5% ds7.5%
U n.s. n.s. n.s.
Pstyli.19 ds0.16 dsy0.04 ds0.06 ds0.65
Ž .
ds2"6.5% dsy0.6"5% ds0.7% ds29"16%
U n.s. U n.s.
Pstyli.09 ds0.86 ds0.05 ds0.46 dsy0.22
Ž .
Mean ds0.51 ds0.2 ds0.36 ds0.72
Žds7%. Žds2%. Žds4.6%. Žds25%. a
Ž .
Fig. 2. P. stylirostris standardized deviates of weight 95% CI , as a function of microsatellite multilocus
Ž .
heterozygosity MLH, number of heterozygous loci per individual , for the two samples of the COP population and for the EPT-g2 population. Linear tendency curves are plotted, and r values are product–moment correlations. Number of individuals per MLH class are indicated in brackets.
Despite a limited sample size, a significant correlation between MLH and the deviate
Ž .
for growth rs0.39; Ps0.034; Fig. 2 was detected in the first sample of the COP
Ž .
population, but not in the second sample rs0.19; Ps0.3; Fig. 2 , as was suggested in the single locus analysis. Homogeneity between the two correlations was not rejected
Žtss0.8, Ps0.21 , and the average correlation was significant r. Ž s0.3; Ps0.02 . In.
the EPT population, a positive correlation was observed, but it was not statistically
Ž .
significant rs0.2; Ps0.17; Fig. 2 .
4. Discussion
Although some correlation between heterozygosity at selectively neutral markers and
Ž
.
Ohta and Kimura, 1970, 1971 , experimental tests of this prediction mainly have been restricted to allozyme data, for which the neutral status is unclear. Microsatellites showed variability despite population bottlenecks and random genetic drift which arose in Tahitian closed populations. This allowed the use of selectively neutral markers in populations maintained at census population sizes between 20 and 100, the effective population size being likely less, for as long as 22 or 24 generations.
Despite a small sample size and a small number of loci, a significant correlation was detected between microsatellite tri-locus heterozygosity and growth rate in the P.
Ž .
stylirostris COP population rs0.3, Ps0.02 . The combined test of single locus heterozygote advantage over the three loci was significant as well. In the EPT popula-tion, the positive correlation was not significant, but the combined test of single locus heterozygote advantage was significant.
4.1. Drift analyses: heterozygosity,Õariance of allelic frequencies and linkage disequi-librium
We have no data on the genetic variability at microsatellite loci in wild populations of
P. stylirostris, so we will use here the information already published on other penaeid
Ž .
species Table 5 . High microsatellite variability has been observed in wild penaeid
Ž
populations, with 4–84 alleles and with heterozygosities exceeding 60% usually around
.
90% . Knowing population history, we can calculate the expected heterozygosity for a highly polymorphic microsatellite locus with H0s90% and for a less polymorphic one
Ž .
with H0s60%. The expected mean identity-by-descent IBD coefficient, f, under presumed demographic parameters is:
t
fs1y
Ž
1y1 2Ne.
,Ž .
4where N is the harmonic mean population size and t is the number of generations sincee
Ž .
foundation Fig. 1 . Then, the expected heterozygosity is:
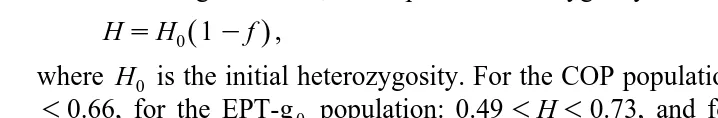
HsH 10
Ž
yf ,.
Ž .
5where H is the initial heterozygosity. For the COP population, this produces: 0.440 -H
-0.66, for the EPT-g0 population: 0.49-H-0.73, and for the EPT-g2 population: 0.48-H-0.72, which roughly fit the observed values. However, analysis of
heterozy-Ž
gosity is not very powerful to evaluate the effect of genetic drift Hedgecock and Sly,
.
1990 , and we will further analyze variance of allele frequencies and linkage disequilib-rium.
Table 5
Microsatellite characteristics in wild penaeid shrimp populations
Species No. of loci No. of alleles Heterozygosity References
P.Õannamei 1 22 0.95 Wolfus et al., 1997
P. monodon 2 14–28 0.83–0.95 Tassanakajon et al., 1998
P. monodon 3 35–84 0.92–0.96 Brooker et al., in press
In the EPT population, the use of temporal variance of allelic frequencies led to a
Ž w x.
smaller estimate of Ne Nes13.6, 95% CIs 2,81 than the presumed census popula-tion size. This trend was qualitatively reinforced by the bigger variance of allelic frequencies between the EPT-g2 and COP stocks than expected under presumed demographic parameters. The effective population size is expected to be smaller than the real size in finite populations under directional selection, as demonstrated by Santiago
Ž .
and Caballero 1998 , or if variance of reproductive success is large for reasons other
Ž . Ž
than genetic ones Frankham, 1996 , as is often the case in marine organisms
Hedge-.
cock, 1994 .
A trend toward smaller effective population size than expected was not supported by linkage disequilibrium analysis, as linkage disequilibrium was always smaller than expected. An explanation may be provided by heterotic effects. If multi-homozygotes are selected against, the linkage disequilibrium will be reduced, because data on double-heterozygotes are useless for calculating gametic disequilibria on genotypic data.
Ž .
Despite the presumed population size of the EPT population Nf100 being five
Ž .
times bigger than the COP one Nf20 , the variance of microsatellite allelic frequen-cies as well as linkage disequilibrium support an equivalent or even smaller effective population size in the EPT-g2 population than in the COP population.
4.2. Heterozygote adÕantage and inbreeding load
Considering the simplest case, where phenotypic value is linearly correlated with inbreeding:
WsWoybf
Ž .
6in which W is the mean phenotypic value of the population, W is the mean phenotypico value in an outbred population, f is the average IBD coefficient, and b is the inbreeding load. If the population is partitioned into heterozygotes and homozygotes at the marker locus, this gives:
WHetyWHomsb
Ž
fHomyfHet.
Ž .
7where WHet and WHom are the mean phenotypic values of heterozygotes and homozy-gotes respectively, and, fHet and fHom are the mean IBD coefficients of heterozygotes and homozygotes, respectively. Marker-associated heterosis is observed when fHom)
fHet. In other words, when local effects are neglected, associative overdominance is observed when inbreeding depression occurred and when heterozygosity is negatively correlated with the IBD coefficient; note that this correlation depends, among other things, on the variance of IBD coefficient within the population. The magnitude of the associative overdominance will depend on the balance between these two forces.
Ž .
Ohta 1973 demonstrated that, if the inbreeding load of a chromosome segment with a length of recombination fraction C is bc, then d, the magnitude of overdominance at a neutral marker located on a different chromosome, is dsbcr2 N C. This relationshipe
Ž
genes localized on its chromosome, but not by more than a factor of 2 if hs)0.1 Ohta,
. Ž .
1973 , where h is the over dominance coefficient and s is the selective disadvantage of
Ž
homozygotes at selected genes. As the haploid chromosome number is 46 Nakaura et
.
al., 1988 in P. stylirostris, most of the genome is unlinked to any particular marker.
Ž .
Therefore, we will ignore this factor and estimate that bf2 N Ce d. Moore et al. 1999 estimated the genome size of P. japonicus to be ;2300 cM. We will assume the same size for P. stylirostris. We found a mean homozygote disadvantage of ds0.046 for
Ž .
growth in the COP population and of ds0.1 without locus Vanna.02 or ds0.25
Žwith locus Vanna.02 in the EPT population. Assuming that 10. -Ne-35 in the COP population, then 0.46-b-1.6; and assuming 13-Ne-60 in the EPT population, then
Ž . Ž .
1.3-b-6 without Vanna.02 or 3.25-b-15 with Vanna.02 .
To explain the observed magnitude of associative overdominance, which is actually
Ž
expected to be quite small even in our small populations on the average, fHomyfHet
.
should be small in Eq. 7 , a high inbreeding depression for growth is needed. The small number of loci used lead to a large variance among estimations, but, even the lower
Ž . Ž .
range appears quite high b)0.46 . Falconer and Mckay 1996, p. 248 present some
Ž
examples of inbreeding depression where the decrease measured as percentage of
.
non-inbred mean of mean body weight per 10% increase of IBD coefficient is never higher than 5%, which is the average amount associated with one locus in our case. On the other hand, our results are in accordance with huge genetic loads described in other
Ž .
marine organisms such as bivalves Bierne et al., 1998 . They have been interpreted as a consequence of the high fecundity of these organisms, which supported such a load, and are a necessary condition for the ‘‘general effect’’ hypothesis of heterozygosity–fitness
Ž .
relationship in natural populations David, 1998; David et al., 1995 .
Ž .
The effect of selected genes physically linked to marker loci local effect cannot be ruled out. However, it would take an incredibly high number of such genes to explain the finding that such a small number of randomly picked microsatellites would have some in their vicinity.
5. Conclusion
Acknowledgements
The authors are very indebted to P. Borsa and P. David for detailed discussions and criticisms while working on this paper, to H. McCombie and F. Volckaert for their comments on the manuscript, and to two anonymous referees for their constructive remarks. The first author also expresses special thanks to E. Bernard and L. Philip de Laborie for their help during hemolymph collection.
References
AQUACOP, 1979. Penaeid reared broodstock: closing the life cycle of P. monodon, P. stylirostris and P.
Õannamei. Proc. World Maricult. Soc. 10, 445–452.
Bagshaw, J.C., Buckhold, M.A., 1994. Application of DNA marker technologies to shrimp aquaculture. Presented at the World Aquaculture Society Meeting, 11–12 January, New Orleans, LA.
Baldwin, J.D., Bass, A.L., Bowen, B.W., Clark, W.H., 1998. Molecular phylogeny and biogeography of the
Ž .
marine shrimp Penaeus. Mol. Phylogenet. Evol. 10 3 , 399–407.
Bassam, B.J., Caetano-Anolles, G., Gresshof, P.M., 1991. Fast and sensitive silver staining of DNA in polyacrylamide gels. Anal. Biochem. 196, 80–83.
Belkhir, K., Borsa, P., Goudet, J., Chikhi, L., Bonhomme, F., 1996–1999. GENETIX, Logiciel sous Windowsepour la genetique des populations, Version 3.3, Logiciel pour la genetique des populations.´ ´ ´ ´ Laboratoire Genome et Populations Universite de Montpellier II, Montpellier, France. http:rrwww.univ-´ ´ montp2.frrgenome-poprgenetix.htm.
Bierne, N., Launey, S., Naciri-Graven, Y., Bonhomme, F., 1998. Early effect of inbreeding as revealed by microsatellite analyses on Ostrea edulis larvae. Genetics 148, 1893–1906.
Black, W., Krafsur, E., 1986. Genestat. Theor. Appl. Genet. 70, 471–496.
Britten, H.B., 1996. Meta-analyses of the association between multilocus heterozygosity and fitness. Evolution 50, 2158–2164.
Brooker, A.L., Benzie, J.A.H., Blair, D., Versini, J.J., in press. Population structure of the giant tiger prawn, Penaeus monodon, in Australian waters using microsatellite markers. Mar. Biol.
Bush, R.M., Smouse, P.E., Ledig, F.T., 1987. The fitness consequences of multiple locus heterozygosity: the
Ž .
relationship between heterozygosity and growth rate in pitch pine Pinus rigida Mill. . Evolution 41, 787–798.
Charlesworth, D., 1991. The apparent selection on neutral marker loci in partially inbreeding populations. Genet. Res. 57, 159–175.
David, P., 1998. Heterozygosity–fitness correlations: new perspectives on old problems. Heredity 80, 531–537.
David, P., Delay, B., Berthou, P., Jarne, P., 1995. Alternative models for allozyme-associated heterosis in the marine bivalve Spisula oÕalis. Genetics 139, 1719–1726.
Deng, H.W., Fu, Y.X., 1998. Conditions for positive and negative correlations between fitness and heterozy-gosity in equilibrium populations. Genetics 148, 1333–1340.
Falconer, D.S., Mckay, T.F.C., 1996. Introduction to Quantitative Genetics. 4th edn. Longman Group, Harlow, Essex, England.
Frankham, R., 1996. Relationship of genetic variation to population size in wildlife. Conserv. Biol. 10, 1500–1508.
Gaffney, P.M., 1990. Enzyme heterozygosity, growth rate and viability in Mytilus edulis: another look.
Ž .
Evolution 44 1 , 204–210.
Ž .
Garcia, D.K., Dhar, A.K., Alcivar-Warren, A.A., 1996. Molecular analysis of a RAPD marker B20 reveals presence of two microsatellites and differential mRNA expression in PenaeusÕannamei. Mol. Mar. Biol.
Garcia, D.K., Faggart, M.A., Rhoades, L., Alcivar-Warren, A.A., 1994. Genetic diversity of cultured Penaeus
Ž .
Õannamei shrimp using three molecular genetic techniques. Mol. Mar. Biol. Biotechnol. 3 5 , 270–280.
Hare, M.P., Karl, S.A., Avise, J.C., 1996. Anonymous nuclear DNA markers in the American oyster and their implications for the heterozygote deficiency phenomenon in marine bivalves. Mol. Biol. Evol. 13, 334–345.
Hedgecock, D., 1994. Does variance in reproductive success limit effective population sizes of marine
Ž .
organisms? In: Beaumont, A.R. Ed. , Genetics and Evolution of Aquatic Organisms. Chapman & Hall, London, pp. 122–134.
Ž .
Hedgecock, D., Nelson, K., Tracey, M.L., 1982. Genetics. In: Abele, L.G. Ed. , The Biology of Crustacea 2 Academic Press, New York, pp. 283–403.
Hedgecock, D., Sly, F., 1990. Genetic drift and effective population sizes of hatchery-propagated stocks of the Pacific oyster, Crassostrea gigas. Aquaculture 88, 21–38.
Latter, B.D.H., Mulley, J.C., Reid, D., Pascoe, L., 1995. Reduced genetic load revealed by slow inbreeding in Drosophila melanogaster. Genetics 139, 287–297.
Laubier, A., Pasteur, N., Moriyasu, M., 1984. Estimation du polymorphisme enzymatique d’une population de
Ž .
Penaeus japonicus maintenue en elevage depuis quatre generations. Oceanologia Acta 7 4 , 451–456.´ ´ ´ Leary, R.F., Allendorf, F.W., Knudsen, K.L., 1984. Superior developmental stability of heterozygotes at
enzyme loci in salmonid fishes. Am. Nat. 124, 540–551.
Mitton, J.B., 1993. Theory and data pertinent to the relationship between heterozygosity and fitness. In:
Ž .
Thornhill, N.W. Ed. , The Natural History of Inbreeding and Outbreeding — Theoritical and Empirical Perspectives. University of Chicago Press, Chicago, pp. 17–41.
Mitton, J.B., Grant, M.C., 1984. Associations among protein heterozygosity, growth rate, and developmental homeostasis. Annu. Rev. Ecol. Syst. 15, 479–499.
Moore, S.S., Whan, V., Davis, G.P., Byrne, K., Hetzel, D.J.S., Preston, N., 1999. The development and application of genetic markers for Kuruma prawns Penaeus japonicus. Aquaculture 173, 19–32. Mulley, J.C., Latter, B.D.H., 1980. Genetic variation and evolutionary relationships within a group of thirteen
Ž .
species of Penaeid prawns. Evolution 34 5 , 904–916.
Nakaura, H.K., Machii, A., Wada, K.T., Awaji, M., Townsley, S.J., 1988. A check list of decapod
Ž .
chromosomes Crustacea . Bull. Natl. Res. Inst. Aquacult. 13, 1–9.
Nei, M., 1978. Estimation of average heterozygosity and genetic distance from a small number of individuals. Genetics 89, 583–590.
Nei, M., Tajima, F., 1981. Genetic drift and estimation of effective population size. Genetics 98, 625–640. Ohta, T., 1971. Associative overdominance caused by linked detrimental mutations. Genet. Res. 18, 277–286. Ohta, T., 1973. Effect of linkage on behavior of mutant genes in finite populations. Theor. Popul. Biol. 4,
145–162.
Ohta, T., Cockerham, C.C., 1974. Detrimental genes with partial selfing and effects on a neutral locus. Genet. Res. 23, 191–200.
Ohta, T., Kimura, M., 1970. Development of associative overdominance through linkage disequilibrium in finite populations. Genet. Res. 16, 165–177.
Ohta, T., Kimura, M., 1971. Behavior of neutral mutants influenced by associated overdominant loci in finite populations. Genetics 69, 247–260.
Palumbi, S.R., Benzie, J., 1991. Large mitochondrial DNA differences between morphologically similar Penaeid shrimp. Mol. Mar. Biol. Biotechnol. 1, 27–34.
Pogson, G.H., Fevolden, S.E., 1998. DNA heterozygosity and growth rate in the Atlantic cod Gadus morhua
Ž .L . Evolution 52 3 , 915–920.Ž .
Pogson, G.H., Zouros, E., 1994. Allozyme and RFLP heterozygosities as correlates of growth rate in the scallop Placopecten magellanicus: a test of the associative overdominance hypothesis. Genetics 137, 221–231.
Ž
Pullin, R.S.V., Wiliams, M.J., Preston, N., 1998. Domestication of crustaceans. Asian Fisheries Science, in
.
press .
Santiago, E., Caballero, A., 1998. Effective size and polymorphism of linked neutral loci in populations under directional selection. Genetics 149, 2105–2117.
Sbordoni, V., La Rosa, G., Mattoccia, M., Cobolli-Sbordoni, M., De Matthaeis, E., 1987. Genetic changes in
Ž .
Ž .
Tiews, K. Ed. , Selection, Hybridization and Genetic Engineering in Aquaculture. Heenemann Verlag, Berlin, Germany, pp. 143–155.
Singer-Sam, J., Tanguay, R.L., Riggs, A.D., 1989. Use of chelex to improve the PCR signal from a small
Ž .
number of cells . Amplifications: a forum for PCR users 3 , 11, September11.
Smouse, P.E., 1986. The fitness consequences of multiple-locus heterozygosity under the multiplicative overdominance and inbreeding depression models. Evolution 40, 946–957.
Sokal, R.R., Rohlf, F.J., 1996. Biometry. 3rd edn. Freeman, New York.
Strobeck, C., 1979. Partial selfing and linkage: the effect of a heterotic locus on a neutral locus. Genetics 92, 305–315.
Sunden, S.L.F., Davis, S.K., 1991. Evaluation of genetic variation in a domestic population of Penaeus
Ž .
Õannamei Boone : a comparison with three natural populations. Aquaculture 97, 131–142.
Tassanakajon, A., Tiptawonnukul, A., Supungul, P., Rimphanitchayakit, V., Cook, D., Jarayabhand, P., Klinbunga, S., Boonsaeng, V., 1998. Isolation and characterization of microsatellite markers in the black tiger prawn Penaeus monodon. Mol. Mar. Biol. Biotechnol. 7, 55–61.
Turelli, M., Ginzburg, L.R., 1983. Should individual fitness increase with heterozygosity?. Genetics 104, 191–209.
Vonau, V., Ohresser, M., Bierne, N., Delsert, C., Beuzart, I., Bedier, E., Bonhomme, F., 1999. Three polymorphic microsatellites in the shrimp Penaeus stylirostris. Anim. Genet. 30, 234–235.
Waples, R.S., 1989. A generalized approach for estimating effective population size from temporal changes in allele frequency. Genetics 121, 379–391.
Weir, B.S., 1979. Inferences about linkage disequilibrium. Biometrics 35, 235–254.
Weir, B.S., Cockerham, C.C., 1984. Estimating F-statistics for the analysis of population structure. Evolution 38, 1358–1370.
Weir, B.S., Hill, W.G., 1980. Effect of mating structure on variation in linkage disequilibrium. Genetics 95, 477–488.
Weppe, M., Bonami, J.R., Lightner, D.V., AQUACOP, 1992. Demonstracion de las altas cualidades de la cepa
Ž .
de P. stylirostris AQUACOP SPR43 resistente al virus IHHN. In: Memorias I Congreso Ecuatoriano de Acuicultura, CENAIM, Guyaquil, Ecuador. pp. 229–232.
Wolfus, G.M., Garcia, D.K., Alcivar-Warren, A., 1997. Application of the microsatellite technique for analysing genetic diversity in shrimp breeding programs. Aquaculture 152, 35–47.
Wright, S., 1951. The genetical structure of populations. Annals of Eugenics 15, 323–354.
Zouros, E., 1987. On the relation between heterozygosity and heterosis: an evaluation of the evidence from marine mollusks. Isozymes 15, 255–270.
Zouros, E., 1993. Associative overdominance: evaluating the effects of inbreeding and linkage desequilibrium. Genetica 89, 35–46.
Ž .
Zouros, E., Pogson, G.H., 1994. Heterozygosity, heterosis and adaptation. In: Beaumont, A.R. Ed. , Genetics and Evolution of Aquatic Organisms. Chapman & Hall, London, pp. 135–146.