EFFICACY OF STAMPS TECHNIQUE FOR MONITORING SURFACE DEFORMATION
IN L’AQUILA, ITALY
Ashutosh Tiwaria*, Ramji Dwivedib, Avadh Bihari Narayanb, Onkar Dikshita, Ajai Kumar Singhb
a
Department of Civil Engineering, IIT Kanpur, Kanpur-208016, UP ([email protected], [email protected]) b
Geographic Information System (GIS) Cell, MNNIT Allahabad, Allahabad-211004, UP ((ramjid, aksingh)@mnnit.ac.in, [email protected])
Commission VIII, WG VIII/1
KEY WORDS: SAR interferometry, DInSAR, Persistent Scatterers, StaMPS, surface deformation.
ABSTRACT
This research work investigates the efficacy of the Stanford Method for Persistent Scatterer Interferometry (StaMPS) in measuring the surface deformation over the L’Aquila region, Italy just before an event of earthquake of magnitude Mw 6.3 by using seven descending Envisat C-Band ASAR images. The results show that the StaMPS technique successfully extracted sufficient number of Persistent Scatterers (PS) to derive a one dimensional (1D) time series displacement map which shows the deformation rates up to 59 mm/year in the satellite Line of Sight (LOS) direction and 50.8 mm/year in the direction opposite to the satellite LOS. Further, several deformation gradients are also observed from this map which indicate the occurrence of multiple crustal movement mechanism. Another dataset of 14 ASAR images is processed covering a time period before and after the earthquake in the study area to validate the results obtained by the previous dataset. We observed that the generated displacement map follows the deformation characteristics of the earlier displacement map in terms of magnitude and surface movement. We conclude that the generated displacement maps validate the presence of a normal fault mechanism with a tectonic process stretching in a NW-SE direction as predicted by earlier research studies.
*Corresponding author ( [email protected] )
1. INTRODUCTION
SAR interferometry (InSAR) is a technique for measuring surface deformation by generating phase difference images known as interferograms using two or more images of the same area acquired at slightly different look angles. These interferograms are then used to estimate the surface deformation using the relationship between phase, slant range, satellite position and acquisition time. The DInSAR technique is used to produce a time series displacement map by generating differential interferograms from which the topographical error is removed. However, a large part of the generated interferograms produced by both the methods is affected by decorrelation due to which accurate measurement is not possible.
In order to correctly estimate the deformation, Ferretti et al. (2001) introduced the PS-InSAR method based on the concept of amplitude stability to select a set of pixels which are dominated by a single scatterer known as PS. The developed approach picked the pixels with a low amplitude dispersion index (0.12) which is the ratio of the standard deviation and mean of the amplitude of the respective pixel. One of the key limitations of this approach lies in the fact that for areas where there are only a few scatterers dominated by a single scatterer, the method fails to detect sufficient number of pixels to detect the deformation. Besides this, there is a threshold on the value of temporal and spatial baseline beyond which there is complete decorrelation and measurement cannot be made. The approach succeeded in detecting good number of PSs in areas where man made features are present but failed to detect sufficient number of pixels in nonurban areas, where the signal to noise ratio goes below a certain threshold and thus, violating the relationship
between amplitude dispersion and phase stability. The phase history of the selected pixels is used to model the temporal deformation.
The StaMPS method (Hooper et al. 2004; Hooper et al. 2007) uses the spatial correlation of the phase of the pixels in a series of interferograms to detect a set of phase stable pixels considered as PS. An initial filtering is done on the basis of amplitude dispersion which is kept high so that more number of phase stable pixels can be detected. The selected pixels are tested for phase stability and the pixels finally selected as PS are used to estimate the deformation, the method is elaborated in more detail in later sections. The method is able to characterize the temporal model of deformation, rather than using an assumed model, which eliminates the need of an a priori temporal model. The approach is successful in finding PS pixels in both urban and nonurban areas, which makes it applicable in areas covered by forests and vegetation as well, as it is able to find low amplitude phase stable pixels in those areas, making it more preferable than other PS-InSAR software known as DePSI, which is successful in detecting deformation in urban areas but not able to detect deformation in nonurban areas (Sousa, 2010).
In this study, we apply the StaMPS based PS-InSAR technique to measure the surface deformation in the L’Aquila region Italy, and investigate its efficacy in predicting a geological hazard with the help of displacement time series of PSs. We also validate the prediction by applying the technique to an extended dataset containing images covering the pre seismic as well as post seismic period. The subsequent sections will cover the mathematical background related to the StaMPS approach, its
application to the study area, the results obtained along with discussions and conclusions.
2. STUDY AREA AND SATELLITE DATASETS
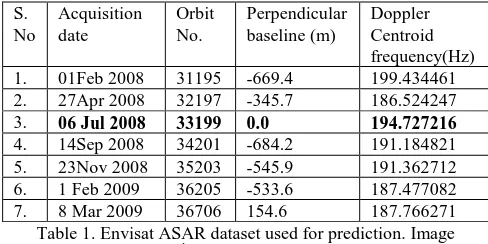
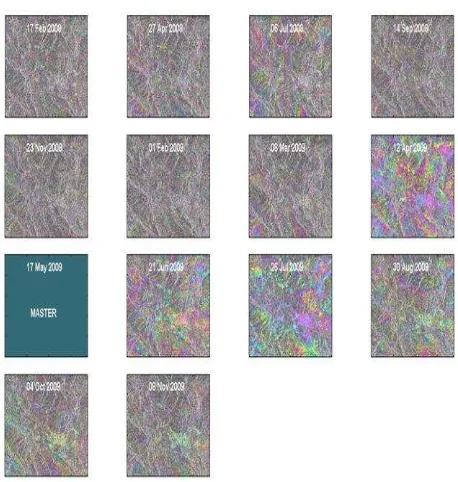
The L’Aquila region, which is the capital of Abruzzo in central Italy is our study area. Initially, seven Envisat ASAR SLC images of track 79 and descending pass of duration (Feb 2008 -Feb 2009) are used in producing differential interferograms from which a time series of displacement is estimated, details on which can be seen in Table 1. Further, in order to give an overall representation of deformation, another dataset of 14 descending ENVISAT C-Band ASAR images of track 79 of duration (Feb 2008 - Nov 2010) is processed. The region includes the epicenter of an earthquake of magnitude Mw 6.3, which occurred on 6th April 2009. ASAR image of 17th May 2009 is chosen as the master image based on minimizing the temporal, Doppler and perpendicular baseline (Hooper, 2007). The dataset is presented in Table 2 along with the critical perpendicular baseline length with respect to the master image.
Apart from this, an SRTM Digital Elevation Model (DEM) of 90 m resolution is used for removing the topographical content from the interferograms.The DORIS precise orbits for the year 2008, 2009 and 2010 are used to remove orbital bias.
S. Table 1. Envisat ASAR dataset used for prediction. Image
acquired on 6th July 2008 is the master image.
S. Table 2. Envisat ASAR dataset used for validation. Image
acquired on 17th May 2009 is the master image.
3. THE STAMPS METHOD
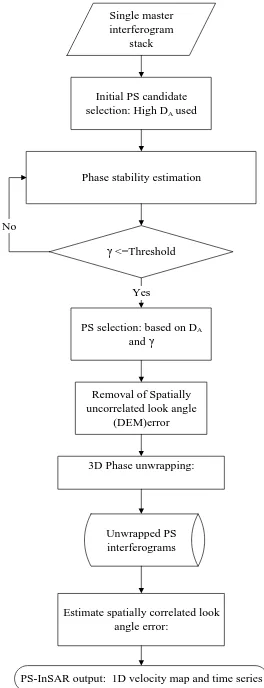
The StaMPS method developed by Hooper et al. (2007) comprises of four steps, namely interferogram generation, phase stability estimation, PS selection and displacement estimation.
The interferogram generation produces a set of differential interferograms formed using a single master image, the master image selected on the basis of minimization of the sum decorrelation of all the interferograms. Each slave image is co-registered with the master image and is resampled to the grid of the master image, after which the complex multiplication of the master image with the complex conjugate of the slave image results in a set of interferograms. The interferograms generated in this step are topographically corrected using an external DEM and are converted into differential interferograms, which act as an input for the next step, i.e. phase stability estimation, which differentiates this method from the previous PS-InSAR methods (Ferreti et al. 2000; Crossetto et al. 2003; Lyons and Sandwell, 2003). This step is initiated with an amplitude based filtering to select a set of amplitude stable pixels known as initial PS candidates using a threshold criteria on the amplitude dispersion index DA(e.g. 0.4). The selected pixels are tested for
phase stability. The phase of a pixel in an interferogram is
denotes the phase change due to the pixel motion in the direction of flight, denotes the phase due to look angle error and
, , N x i
represents the noise term introduced by the scattering effects and ‘w’ is the wrapping operator(Hooper et al., 2007) which shows that the phase value given here is wrapped to modulo 2π and it has to be unwrapped to obtain the original phase value. The pixels which satisfy the convergence of a measure γx are considered as PS pixels in the PS selectionstep, as shown in the following equation:
N denotes the number of interferograms,
,
pixel in the ithinterferogram. The pixels chosen as PSs are used
in displacement estimation. The phase of the selected PS pixels is wrapped to modulo 2π, as the microwave pulses are sinusoidal in nature, which repeat their pattern after a period of 2π, and hence an integer number of cycles of 2π need to be added to the wrapped phase values to obtain the true phase value. The removal of master orbital error, atmospheric phase content and phase residuals due to satellite orbit inaccuracies are also estimated in the displacement estimation step, as our interest is in finding the value of
, , def x i
, which will give the deformation magnitude. The PS processing results in a 1D line of sight (LOS) map showing a time series displacement of each of the detected PS pixel. The PS processing steps are shown in Figure 1.
4. RESULTS
In this section, the results of the PS-InSAR processing in the L’Aquila region, Italy are presented. Using seven C-Band ASAR SLC images, six interferograms were formed as shown in Figure 2. Using the DA and γx value of 0.4 and 0.005
respectively, 26628 PS pixels were finally detected. The PS displacement plot shown in Figure 3 shows a times series (TS) surface displacement in the range -50.8 to 59 mm per year, in which positive sign and negative sign shows displacement towards and away from the satellite LOS respectively. The X and Y axes shows longitude and latitude respectively. The movement with negative sign is an indication of the surface affected by subsidence or activities similar to it. The displacement plot shows time series deformation with respect to the first differential interferogram shown in Figure 2. PS density in few areas is slightly low because of the presence of a majority of pixels having distributed scattering properties.
Several deformation gradients are clearly seen in the study area, which indicate the occurrence of multiple tectonic activities in the region. We observe that most of the western region with respect to the earthquake epicenter shows displacement towards the satellite LOS and the eastern region shows displacement opposite to the satellite LOS. The regions where high deformation gradients are seen include the Lucoli region, which is below the L’Aquila city, 82 kilometers north east of Rome, the Reiti city in the Lazio region and a national park near the L’Aquila region. We also notice that the region containing the earthquake epicenter and its surroundings shows deformation of the order of 3-4 cm indicating the existence of a deformation zone near the earthquake epicenter and emphasizes the possibility of a major tectonic activity in the study region in recent time. The method has proved to be efficient in detecting slow movements of the order of 5 cm which we can be seen in Hooper et al. (2007), Sousa et al. (2010), Liu et al. (2010), which further emphasizes the reliability of our results.
The StaMPS method is able to determine 1D LOS displacement with a minimum of four interferograms, but the accuracy is improved by using more number of images (Hooper, 2007). Hence, in order to test the accuracy of the results and to validate the prediction, we used a dataset of 14 Envisat SLC images covering the time period before and after the earthquake. Using 14 SLC images, 13 interferograms were formed as shown in Figure 4. Using 13 interferograms, the number of detected PS pixels was 21103. The PS displacement plot shown in Figure 5 shows a maximum displacement in the range -63.6 to 50.4 mm/year with warm and cold colors showing displacement away and towards the satellite LOS respectively. The areas which appear in moderate color (light green) specify the regions where very less amount of deformation has occurred over the time for which the time series deformation is being estimated. We noticed that the PS displacement plot gives an indication of a fault mechanism in the area containing and surrounding the earthquake epicenter. We clearly noticed that the areas identified as deformation zones by using images before the earthquake (Figure 3) show deformation in the TS plot obtained by processing images before and after the earthquake (Figure 5) as well. The displacement plot obtained by using 14 SLC images gives a representation of the deformation pattern in the study area as we find that the north-west and south-east regions with respect to the earthquake epicenter exhibit a displacement of nearly equal magnitude in opposite directions which commensurate the normal fault mechanism.
We observe that the prediction of an event observed in the study area by applying the StaMPS method to dataset of seven SLC image acquired before the earthquake follows the deformation
pattern in terms of the displacement magnitude and the occurrence of surface movements in the region as shown by the displacement plot of 14 SLC images acquired before and after the earthquake.
We noticed that the generated TS displacement map validates the presence of a normal fault mechanism with a tectonic process stretching in a NW-SE direction as predicted by earlier research studies. Further, we also conclude that the results obtained from StaMPS method proved to be a valuable input in understanding the terrain movement and predicting the occurrence of tectonic event.
PS-InSAR output: 1D velocity map and time series Unwrapped PS
Figure1. StaMPS based PS-InSAR processing flowchart
5. CONCLUSION
We find that the StaMPS based PS-InSAR technique succeeded in extracting sufficient number of PS pixels in the study area, which proves the efficacy of the approach in measuring a time series surface deformation activity. Furthermore, we see the occurrence of multiple crustal movement mechanisms in the study area, which predicts the possibility of a tectonic event. The prediction is validated by producing TS displacement map using images acquired before and after the occurrence of the earthquake in the study area. In future, we would like to measure the surface deformation in the study area and other regions using the StaMPS based Small Baselines Subset (SBAS) approach and compare the results using the PS-InSAR and the SBAS method.
ACKNOWLEDGEMENTS
The authors are thankful to the European Space Agency (ESA) for providing a set of Envisat ASAR SLC scenes, JPL for SRTM DEM and TU Delft for Precise DORIS orbits. We thank the StaMPS community for providing useful suggestions on the PS processing and result interpretation.
Figure 2. Unwrapped Interferograms for the L’Aquila earthquake using seven images.
Figure 3. 1D TS displacement plot showing the PS pixel displacement in mm per year. The star shows the
earthquake epicentre location.
REFERENCES
Figure 4. Unwrapped interferograms obtained by using images before and after the earthquake.
Figure 5. 1D TS displacement map using images acquired before and after the earthquake. The star shows the earthquake
epicentre location.
REFERENCES
Crosetto, M., Crippa, B., and Biescas, E., 2005. Early detection and in-depth analysis of deformation phenomena by radar interferometry. Engineering Geology 79(1–2), 81–91.
Ferretti, A., Prati, C., and Rocca F., 2000. Nonlinear subsidence rate estimation using Permanent Scatterers in differential SAR, IEEE Trans. GARS Vol. 38, pp. 2202 – 2212, September 2000.
Hooper, A., Zebker, H., Segall, P., and Kampes., B.,2004. A new method for measuring deformation on volcanoes and other natural terrains using InSAR persistent Scatterers, Geophysical Research Letters, Vol. 31.
Hooper, A., Segall, P., and Zebker, H., 2007. Persistent Scatterer InSAR for Crustal Deformation Analysis, with Application to Volcan Alcedo, Galapagos, Journal of Geophysical Research, Vol. xxx, xxxx,
Lyons, S., and Sandwell, D., 2003. Fault creep along the southern San Andreas from interferometric synthetic aperture radar, permanent scatterers, and stacking, Journal of Geophysical Research, 108(B1), 2047-2070.
Liu, H.H., Chen, J.P., Zhao, H.L.,Fan, J.H., and Guo, X.F., 2010. A Study of Deformation Monitoring Using StaMPS Technique, Progress In Electromagnetics Research Symposium Proceedings, Xi'an, China, March 22-26.
Sousa, J.J., Ruiz, A.M., Hanssen, R.F., Bastos, L., Gil, A.J., Zaldivar, J.G., and Galdeano, C.S.D., 2010. PS InSAR processing methodologies in the detection of field surface deformation—Study of the Granada basin (Central Betic Cordilleras, Southern Spain), Journal of Geodynamics, 49, 181–189.