RICE-PLANDTED AREA EXTRACTION BY TIME SERIES ANALYSIS OF ENVISAT
ASAR WS DATA USING A PHENOLOGY-BASED CLASSIFICATION APPROACH: A
CASE STUDY FOR RED RIVER DELTA, VIETNAM
D. Nguyen a,b, *, W. Wagner a , V. Naeimi a, S.Caoa a
Department of Geodesy and Geoinformation, Vienna University of Technology, Austria – [email protected] , [email protected], [email protected], [email protected]
b Department of Photogrametry and Remote Sensing, Hanoi University of Mining and Geology, Vietnam – [email protected]
KEY WORDS: Rice phenology, Time series, ENVISAR ASAR WS, SAR, Red River delta, Classification
ABSTRACT:
Recent studies have shown the potential of Synthetic Aperture Radars (SAR) for mapping of rice fields and some other vegetation types. For rice field classification, conventional classification techniques have been mostly used including manual threshold-based and supervised classification approaches. The challenge of the threshold-based approach is to find acceptable thresholds to be used for each individual SAR scene. Furthermore, the influence of local incidence angle on backscatter hinders using a single threshold for the entire scene. Similarly, the supervised classification approach requires different training samples for different output classes. In case of rice crop, supervised classification using temporal data requires different training datasets to perform classification procedure which might lead to inconsistent mapping results. In this study we present an automatic method to identify rice crop areas by extracting phonological parameters after performing an empirical regression-based normalization of the backscatter to a reference incidence angle. The method is evaluated in the Red River Delta (RRD), Vietnam using the time series of ENVISAT Advanced SAR (ASAR) Wide Swath (WS) mode data. The results of rice mapping algorithm compared to the reference data indicate the Completeness (User accuracy), Correctness (Producer accuracy) and Quality (Overall accuracies) of 88.8%, 92.5 % and 83.9 % respectively. The total area of the classified rice fields corresponds to the total rice cultivation areas given by the official statistics in Vietnam (R² 0.96). The results indicates that applying a phenology-based classification approach using backscatter time series in optimal incidence angle normalization can achieve high classification accuracies. In addition, the method is not only useful for large scale early mapping of rice fields in the Red River Delta using the current and future C-band Sentinal-1A&B backscatter data but also might be applied for other rice cultivation areas.
* Corresponding author.
1. INTRODUCTION
“RICE is life, for most people living in Asia”(Gnanamanickam, 2009). Rice has shaped the cultures, diets and economies of millions of people. Rice is the primary main food supply for more than half of the world’s population (N.V.Nguyen, n.d.), providing livelihood and employment for the most of rural populations (Khush, 2005). In many countries of East and Southeast Asia, rice plays a very significant role in society, the agrarian system and livelihoods of a majority of farmers, being a leading user of land and water resources, and featuring heavily in local cultures and traditions (Gnanamanickam, 2009). In the East and Southeast Asia, Vietnam is known as one of the most important rice producers and exporters. It is also the second biggest rice exporters country (after Thailand) (FAO, 2012).
RRD is known as the second most important rice producers and exporters in Vietnam (after Lower Mekong River delta) with the sown areas of 1.139 million hectares for the year 2012 (Statistical Yearbook of Vietnam 2013). The area is the country’s most densely populated region: 20.439 million inhabitants are crowded onto slightly more than 15.000 km2, 13.881 million of those live in rural areas and only 6.558 million of those inhabitants live in cities. More than 8.100 million people are working in agricultural activities (Statistical Yearbook of Vietnam 2013). Rapid population growth, along with intensive rice cultivation, has caused
degradation of land in many parts of this region, consequently influencing rice yields and land productivity. An effective rice crop mapping method in the RRD is essential to provide policymakers with accurate information on rice-growing areas so that they can devise better economic development plans, as well as ensure security of the food supply for the region.
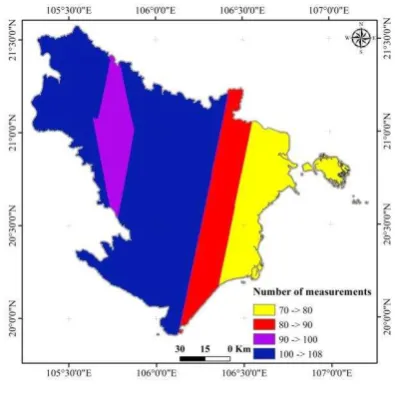
measurement per location we proposed a method that combining SAR images from different tracks and different year into a single assimilationof year (Figure 1); however, this leads to a difference in local incidence angle and potentially reduces the accuracy of classification results. This study, we performed local incidence angle normalization by using empirical, regression based approaches to the data to minimize impacts on the mapping results prior to analysis. For classification task, we proposed an automatic approach identifying double cropped-rice used the phonological information of cropped-rice crops that we called temporal crop parameters identify, such as, the relative minimum and relative maximum backscatter values, their difference, minimum and maximum increment values between two subsequent acquisitions.
Figure 1. Time series data combination strategy
The aim of this paper is to present a novel method of time series ENVISAT ASAR WS mode data analysis as well as develop a phenology-based classification approach for mapping rice-cropping systems in in the RRD, Vietnam using Gaussian filter algorithm and phenological information of rice crop phenology. The main objects of this study are as follows: (1) local incidence angle normalization by using empirical, regression based approaches, (2) time series data combining and filtering, and (3) a phenology based method to derive rice cropping systematic in RRD. Section 2 describes the test site and rice crop phenology. Section 3 describes the data used in the study. The mapping method is developed in Section 4. Section 5 presents the mapping results and validation. Conclusion and discussion are presented in Section 6.
2. STUDY AREA & RICE CROP PHENOLOGY
2.1 Study area
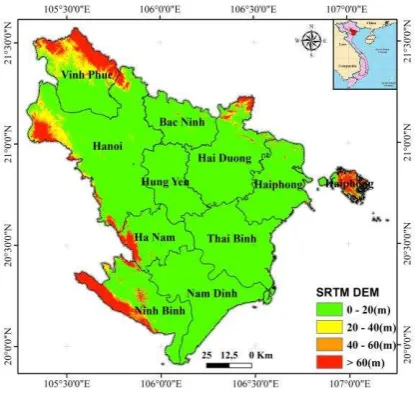
Study area locates in the northern part of Vietnam (Lat. 19.5– 21.5N, Long. 105.3– 107.1E), western coastal zone of the Gulf of Tonkin, includes 10 provinces and covers approximately 15,000 km2. RRD is the second largest rice-producing area of the country and one of the five largest rivers on the of East Asia coast, almost flat plain with most of the land below 20 m (Figure 2).
Figure 2. Map of 10 provinces in the RRD & topography from SRTM
Cultivated rice is primarily activity and is considered as the major source of income for most of rural households in this study area. Farmers typically grow three crops per year, double-cropped + winter crop (such as maize, soybean, or sweet potato). Spring or early rice (ER) from February/March to Jun/July, summer or late rice (LR) from Jun/July to September, and a winter crop from October to February/March (because it is often affected by heavy rainfall or storms) (Denning & Vo, 1995; Devienne, 2006). Two major zones could be distinguished in the delta, depending on whether there was tidal action or not. Generally, throughout the delta, the highland rice fields supported one rice cycle during the rainy season, the lowland rice fields one dry season cycle, and the midlands all supported one rainy season cycle and if they could be irrigated during the dry season via manual scooping or by the ebb and flow of the tide, a second rice cycle. These seasons form three main types of rice crop: single-cropped rice, double-cropped rice and double-cropped rice + main crop. Depending on the location and irrigation conditions, the double-cropped rice has two types: long-duration varieties and short-duration varieties (Devienne, 2006).
2.2 Rice crop phenology
radar backscatter intensity also begins levelling off. Finally, in the fallow period, when the rice fields are almost bare or flooded, hence radar backscatter responses from rice fields are very low again (Figure 3).
Figure 3. Double-cropped rice + winter main crop pattern plot based on 5 years ENVISAT ASAR WS backscatter data combination (rice plant image from the International Rice
Research Institute (IRRI)-Rice Knowledge Bank)
3. DATA COLLECTION AND PREPROCESSING
3.1 Satellite Data
3.1.1 ENVISAT ASAR Wide swath mode data
This paper uses data acquired by the Wide Swath mode of the ASAR on board of the European Environmental Satellite ENVISAT. In Wide Swath (WS) mode it covers a swath of 405 km, with a spatial resolution of 150 m and incidence angle in each image ranges from 17 to 42. A total of 120 ASAR WS images which completely or partially cover the Red River delta were taken from European Space Agency (ESA) between 2007 and 2011 (Figure 4).
Figure 4. ENVISAT ASAR WSM images over study area for a period of 5 years (2007-2011)
The ENVISAT ASAR WS data were pre-processed by using the open source NEST (Next ESA SAR Toolbox) software. Pre-processing steps consist of geocoding, radiometric calibration, and resampling. In the geocoding step, DORIS precise orbit information and the other ENVISAT auxiliary files were automatically downloaded from ESA via FTP. The Range-Doppler Range -Approach was carried out by using the 30 arc-seconds DEM (SRTM) and bilinear interpolation as the image and DEM resampling method. The resampling of these images to a fixed grid (cover all the study area) in a database was carried out in order to allow efficient time series analysis, which was required for the extraction of the backscatter parameters.
3.1.2 LANDSAT Data
Because of the difficulty of collecting simultaneous ground-truth data for rice cropped types from historical land use maps, the simultaneous or recent available LANDSAT images can be used as a reference parameter to generate training data. By this means, obvious stability and changes in land use land cover could be reliably detected by image interpretation. In this study, due to the “time gap” between the establishments dates of the land use map in 2007 and 2011, all the free and low-cloud cover LANDSAT 7 Enhanced Thematic Mapper Plus (ETM+) and LANDSAT 5 Thematic Mapper (TM) data downloaded for a period of 5 years (2007-2011) through the USGS website http://earthexplorer.usgs.gov/ were used. Then, with the assistance of reference maps (land use map for the year 2005 and 2010), an interpretation key that describes the spectral reflectance and spectral reflectance changed for each rice cropped type was developed and carefully evaluated. When the definition of representative training areas is known, selecting training sites on the image of false-colour composite 4-3-2 (FCC) has the advantage of easily visually distinguishing the classes.
3.2 Land Use Land Cover and Rice Area Statistic Data
Ancillary maps, including the Land use & land cover map of 10 provinces in the study at 1/50,000 (2010) collected from the General Department of Land Administration of Vietnam (Figure 5a). Rice area statistics were also provided by the General Statistics Office of Vietnam (Figure 5b). Because the land use land cover map just have been updated every 5 years and are recorded in vector format, thus we used the land use map in combine with LANDSAT time series data to digitize sampling sites vector layers. These vector layers were then overlaid upon the 2007 and 2011 time series Landsat images, and the polygons were modified wherever stability rice fields were found. Digitizing sampling sites then were converted to a raster file (75 m resolution) which used for rice cropped classification and validation (70 percent and 30 percent of this training data were used, respectively. In addition, the accuracy of classification result was verified by comparing with the government rice statistics data at province level. In addition, because of the absent of single crop information in both land use land cover map (2010) and government statistics data, in this study, a new shape file was created from time series LANDSAT data.
4. MAPPING METHOD
i) SAR backscatter coefficient normalization (empirical regression-based approach) and combination (Nyquist–Shannon sampling theorem) :ooNOR (moving window) method: NORo _average
o
filtered average NOR_ _
;
iii) Filtered backscattering profiles of different rice crops and other land cover types are then analysed to selected thresholds for classification;
iv) Classification time series data using decision tree approach;
v) Accuracy assessment using ground truth data, rice statistics at province level, and time series Landsat images.
This algorithm might be extended and applied to identify rice-(b) Average of planted area of rice by province and by rice
seasons for the period 2007-2011
4.1 Backscatter coefficient normalization, combination and
filtering.
Following (Loew et al, 2006; Pathe et al, 2009), the local incidence angle and slope parameter were used to normalize backscatter measurements acquired over the study area at different incidence angles, to a single reference incidence angle (θ = 30). Moreover, in our case, data acquisition sequence (day of year sequence) over the study area is as follow: the maximum and minimum in intervals of respectively 16 days and one day. Hence to guarantee that the information from original datasets are not excluded at and to minimize the impact speckle noise or other environmental conditions, the Nyquist–Shannon sampling theorem was applied to generate average of oNORimages
(Nyquist, 1928). The 7 days SAR backscatter coefficient data was combined to determine the mean value of backscatter, it is denoted by oNOR_average . As the result, 52
o aver age NOR_
scenes that
were then stacked into a composite scene (52 bands). Although averaging time series backscatter coefficient value compositing (NORo _average ) increases ability to identify double rice crop, data analysis remains affected by the residual effects of cultivated time difference over period 5 years and other environmental conditions. Therefore, a smoothing of temporal oNOR_average
signal is required. There are many methods of data smoothing. Considering the robust issues, maintain the integrity of signals, and characteristic of noise in NORo _average data, Gaussian filter
was applied to smooth time series NORo _average data. The smooth
time-series oNOR_average _filtered data was then used for
characterizing the temporal characteristics of double rice crop patterns throughout the year.
4.2 Thresholds selection and Classification
A straightforward decision tree approach was used to discriminate different type of rice cropped. This approach is based on the unique seasonal patterns of double rice crop in the magnitude of SAR backscatter coefficient throughout the growth cycle. For each pixel, the maximum backscatter coefficient value, minimum backscatter coefficient value, the different between the minimum of local maximum backscatter coefficient value and the maximum of local minimum backscatter coefficient value, and the different between the two consecutive local maximum backscatter coefficient value were identified and calculated from NORo _average _filtered temporal
profile. Accordingly, by scanning the smoothed time profile of o
filtered average NOR_ _
data to find characteristic points including
only local maximum values from the NORo _average _filtered time
profile. Moreover, other land cover types might have the same number of heading date, like grassland, shrub or small scale mixed horticulture, for example. Consequently several thresholds of feature parameters had to be employed to identify type of rice crop for each pixel. Along with the number of heading time (number of local maxima in time-series backscatter profile that greater than a threshold), two other feature parameters are also used, the first parameter is “absolute value of minimum backscatter different of rice” (the different between the minimum of local maximum and the maximum of local minimum), and the second parameter is “minimum length of rice cultivation” (the different between the two probable dates). Based on training data, a group of SAR backscatter coefficient profile were plotted to select thresholds for corresponding parameters, as can be seen from Figure 6. The first, local maximal points with backscatter coefficient values greater than -8 dB, the second, the different between the minimum of local maximum and the maximum of local minimum with absolute value greater than 2.5 dB, and the third, the “minimum length of rice cultivation” is 77 days.
Figure 6. Rice crop phenology parameters retrieval from time series SAR-C band backscatter coefficient (Beginning of rice crop season, End of rice crop season, Heading time, Rice crop
amplitude, Length of season)
4.3 Validation
In order to validate the accuracy of the classification result, shape files of double-cropped rice was generated based on land use map of the year 2010 and time series LANDSAT data, also called knowledge-base digitizing datasets. These shape files then were converted into binary raster format and used to evaluate the quality of former classification results. True positive pixels are all the pixels in both datasets that have the value of 1. False Negative pixels are the pixels which have a value of 1 in knowledge-base digitizing dataset and a value of 0 in classification results.
5. RESULT AND DISCUSSION
5.1 Classification result & Validation
Double-cropped rice fields estimated from year and multi-track ENVISAT WS SAR data of the study area is shown in Figure 7. The overestimation in the number of crops per year may have been due to mixed-pixel effects caused by adjacent land surfaces. The accuracy of classification is presented in the Table 1. The former provides the Correctness of 88.8% and Completeness of 92.5% and Quality (Overall accuracy) of 83.9%.
Figure 7. Rice crop map derived from five year time series ENVISAT WS mode SAR data in the RRD
Paremeter Crop types
Corr (%)
Comp (%)
Quality (%) Double rice crop 92.5 88.8 83.9
Table 1. The result of the classification accuracy assessment
The relationship between the ENVISAT WS time series data derived rice areas and those from the government’s rice area statistic for each year was also examined. The results showed that the correlation between two datasets was vigorous. The correlation coefficient (R2) used to measured the adequacy of regression model between two datasets, for rice planted area (Figure 8) indicated that the models could explain almost exactly the variability in the data (R2 0.96) with a root mean square error (RMSE) of 3993.98 hectares per province.
5.2 Discussion
Figure 8. Retrieved rice planted areas per province (in hectares) for the sum of double cropped rice vs. statistical rice planted
areas. The thick green line represents the linear regression between the two datasets.
Data Province
name
WSM data ( ×103 ha)
Statistical database (×103 ha)
Diff (×103 ha)
Hanoi 206.0 206.9 -0.9
Vinhphuc 41.1 60.5 -19.4
Bacninh 79.6 76.2 3.4
Haiduong 131.0 127.5 3.5
Haiphong 94.5 83.1 11.4
Hungyen 89.1 81.9 7.2
Thaibinh 188.7 168.3 20.4
Hanam 81.8 70.4 11.4
Namdinh 175.8 159.0 16.8
Ninhbinh 95.0 81.3 13.7
Table 2. Maximum planted area of rice by province (in ha) for all Season in period 5 year (2007-2011) from the statistical
database and from the WSM data
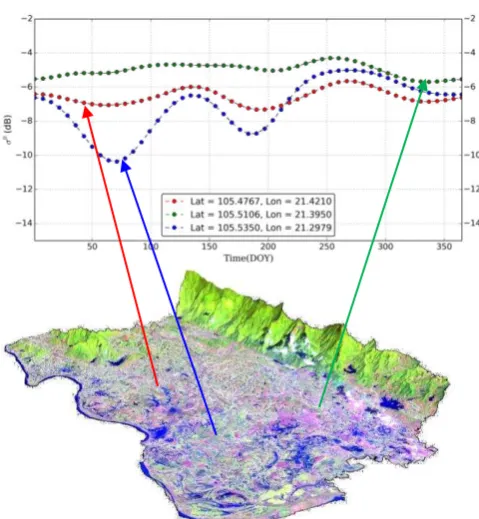
Three pixels were selected in this area to describe the time-series backscatter behaviour (after smoothing with Gaussian filter algorithm) for double-cropped rice and plotted in Figure 10. This figure shows the patterns (the amplitudes of backscatter coefficient after filtered) of double-cropping. The crop season patterns of the same type of rice crop (bur they locate at different location over the study area) are represented in red, green and blue profile. It is worth noting here that the amplitude value of blue profile differs from others, with the value equalling 5.2 dB (bigger than 2.5 dB that was used for double-cropped rice classification), meanwhile, two other profiles (red and green colour) of NORo _average _filtered have
amplitude value quite small (less than 2.0 dB). In addition, it is difficult to observe two heading time characteristic of double-cropped rice from green colour profile. This is a minor issue that led to the double-cropped rice areas classified as non-rice areas. This effect can explain a significant part of the difference between the rice area extent derive from ENVISAT WS data and the rice area extent from the government statistics data. And reasons for this issue come from the fields size, terrain effect, types of rice, as well as cultivation activities in upland areas. It really is available in Vinhphuc province (Figure 10).
Figure 9. Rice map derived from the WSM dataset (below) and land cover map at scale 1:50000 (above) in Vinhphuc
Figure 10. The time series backscatter pattern from Double rice at different location of Vinhphuc province. Red-dot line: Double rice at the open slope areas (wide fields area extend), Green-dot line: Double rice at the complex terrain areas (small
6. CONCLUSION
A novel rice mapping method has been developed, based on former methods using the temporal backscatter time profile as a classification feature, and an adapted method to normalize multi-year and multi-track wide-swath datasets. The effect of the spatial and temporal variation of the incidence angle within the dataset is tackled by using linear relationship coefficients, which slope parameter is derived from multi-temporal ENVISAT WSM data. Five years data composite allows increasing significantly the observation frequency and the size of the mapped areas compared to the former methods using single-track narrow- swath datasets or single year data.
The first rice planted map of double-cropped rice for the entire RRD was generated using ENVISAT ASAR WS mode data. Although several errors causes-notably topography issues resolution bias, as well as mixed-pixel issues, between the classification map and the reference data contributed to the accuracy level of classification results, the Correctness (Corr) and Quality achieved by comparing the classification map and the reference data were approximately 89% and 84% for double-cropped rice, respectively. These results were also reaffirmed by close correlation between the ENVISAT WS mode SAR-derived rice area and the rice area from statistics data (R2 0.96).
ACKNOWLEDGEMENTS
The authors would like to thank Department of Geodesy and Geoinformation, Vienna University of Technology for support us the data and software to do this research. The financial support of the ESA funded TIGERNET project (ESA Contract No 4000105732/12/I-NB).
REFERENCES
Aschbacher, J., Pongsrihadulchai, A., Karnchanasutham, S., Rodprom, C., Paudya, D. R., & Toan, T. Le. (1995). Assessment of ERS-1 SAR data for rice crop mapping and monitoring. IEEE Geoscience and Remote Sensing Letters, 83– 85.
Bouvet, A., & Le Toan, T. (2011). Use of ENVISAT/ASAR wide-swath data for timely rice fields mapping in the Mekong River Delta. Remote Sensing of Environment, 115(4), 1090– 1101. doi:10.1016/j.rse.2010.12.014
Bouvet, A., Le Toan, T., & Lam-Dao, N. (2009). Monitoring of the rice cropping system in the Mekong Delta using ENVISAT/ASAR dual polarization data. IEEE Transactions on Geoscience and Remote Sensing, 47(2), 517–526.
Chen, E. X., Li, Z. Y., Tan, B. X., Pang, Y., Tian, X., & Li, B. B. (2007). Supervised wishart classifier for rice mapping using multi-temporal ENVISAT ASAR APS data. In Envisat Symposium 2007 (Vol. 2007, pp. 2–7).
Denning, G. L., & Vo, T. X. (1995). Vietnam and IRRI : a partnership in rice research : proceedings of a conference held in Hanoi, Vietnam, 4-7 May 1994. Manila, Philippines; Hanoi, Vietnam: International Rice Research Institute ; Ministry of Agriculture and Food Industry.
Devienne, S. (2006). Red River Delta: Fifty Years of Change. Moussons.
FAO. (2012).
http://www.fao.org/docrep/016/ap288e/ap288e.pdf.
Gnanamanickam, S. (2009). Rice and Its Importance to Human Life. In Biological Control of Rice Diseases SE - 1 (Vol. 8, pp. 1–11). Springer Netherlands. doi:10.1007/978-90-481-2465-7_1
Khush, G. (2005). What it will take to Feed 5.0 Billion Rice consumers in 2030. Plant Molecular Biology, 59(1), 1–6. doi:10.1007/s11103-005-2159-5
Loew, A., Ludwig, R., & Mauser, W. (2006). Derivation of surface soil moisture from ENVISAT ASAR wide swath and image mode data in agricultural areas. Geoscience and Remote Sensing, IEEE Transactions on, 44(4), 889–899.
N.V.Nguyen. (n.d.). Global climate changes and rice food security. Retrieved July 29, 2014, from
http://www.fao.org/forestry/15526-03ecb62366f779d1ed45287e698a44d2e.pdf
Nyquist, H. (1928). Certain topics in telegraph transmission theory. AIEE Trans, 47, 617–644. doi:10.1109/5.989875
Pathe, C., Wagner, W., Sabel, D., Doubkova, M., & Basara, J. B. (2009). Using ENVISAT ASAR Global Mode Data for Surface Soil Moisture Retrieval Over Oklahoma, USA. IEEE Transactions on Geoscience and Remote Sensing, 47(2), 468– 480. doi:10.1109/TGRS.2008.2004711
Ribbes, F., & Le Toan, T. (1999). Rice field mapping and monitoring with RADARSAT data. International Journal of Remote Sensing, 20(2-4), 745–765.
Statistical Yearbook of Vietnam 2013. (2012) (pp. 1–7). General Statistics Office of Vietnam.
Statistical Yearbook of Vietnam 2013. (2013) (pp. 1–7). General Statistics Office of Vietnam.