SEMI-AUTOMATED APPROACH FOR MAPPING URBAN TREES FROM
INTEGRATED AERIAL LiDAR POINT CLOUD AND DIGITAL IMAGERY
DATASETS
M. A. Dogon-Yaro ac, P. Kumara, A. Abdul Rahman a, G. Buyuksalih b.
a 3D GIS Research Lab, Dept. of Geoinformatics, Universiti Teknologi Malaysia, 81310, Johor, Malaysia.
[email protected]. bBimtas, Istanbul, Turkey. c Dept.of Surveying and Geoinformatics, Abubakar Tafawa Balewa University, Bauchi, Nigeria.
KEY WORDS: Extraction, Integrated, Airborne LiDAR, Multispectral Image, Urban Trees.
ABSTRACT
Mapping of trees plays an important role in modern urban spatial data management, as many benefits and applications inherit from this detailed up-to-date data sources. Timely and accurate acquisition of information on the condition of urban trees serves as a tool for decision makers to better appreciate urban ecosystems and their numerous values which are critical to building up strategies for sustainable development. The conventional techniques used for extracting trees include ground surveying and interpretation of the aerial photography. However, these techniques are associated with some constraints, such as labour intensive field work and a lot of financial requirement which can be overcome by means of integrated LiDAR and digital image datasets. Compared to predominant studies on trees extraction mainly in purely forested areas, this study concentrates on urban areas, which have a high structural complexity with a multitude of different objects. This paper presented a workflow about semi-automated approach for extracting urban trees from integrated processing of airborne based LiDAR point cloud and multispectral digital image datasets over Istanbul city of Turkey. The paper reveals that the integrated datasets is a suitable technology and viable source of information for urban trees management. As a conclusion, therefore, the extracted information provides a snapshot about location, composition and extent of trees in the study area useful to city planners and other decision makers in order to understand how much canopy cover exists, identify new planting, removal, or reforestation opportunities and what locations have the greatest need or potential to maximize benefits of return on investment. It can also help track trends or changes to the urban trees over time and inform future management decisions.
1. INTRODUCTION
Urban trees have many advantages such as preserving energy, improving water quality, minimizing greenhouse gasses and many other environmental pollutants, as well as connecting urban dwellers with nature (McPherson, 2006, Nowak D. J. 2007). To exploit these benefits, information about location, composition and extent of urban trees is often needed for planning and management purposes. This information can be employed for a different type of analysis, like vegetation growth tracking or monitoring, appraisal of trees condition, etc. Conventionally, this information is obtained through field surveying methods which are highly expensive, laborious (tedious), time-consuming and usually cannot be carry out over large areas. In spite of efforts and capital spent on the conservation of trees, many cities often do not have an all-inclusive information on their conditions (Yang, J. 2012), which is a major limitation for actualizing their benefits (Zhang, and Qiu, 2012). In order to realize numerous economic, environmental and sustainable decision-making processes, an accurate, up-to-date and in-depth information on spatial distributions, extents and health conditions of urban ecosystem is necessary.
limited. As LiDAR applications in urban trees mapping expand, therefore, automated approach for tree detection technique is most likely to increase (Heinzel, et al. 2008).
However, LiDAR systems have no band which makes it insufficient for vegetation classification, especially in urban forests with diverse species and high spatial heterogeneity. Digital multispectral imagine, usually possesses many distinct bands, therefore, exhibit a great potential in identifying and mapping tree feature with their rich spectral contents. Airborne LiDAR data and digital imagery are highly complementary (Caldwell, J. 2005), the images can validate the filtering accuracy (Jawak, et al. 2013) while the elevation information from LiDAR can be used to ortho-rectify images datasets (Flood, 2002, Savopol, et al. 2004). Highly dense LiDAR data with multiple returns per square meter would be overwhelming for tree crown depiction and for determination of crown shape while image spectral properties can be used to differentiate tree objects (Holmgren, et al. 2008, MacFaden, et al. 2012). Therefore, data products which are highly information-rich can be created. It is assumed that both data sources concurrently will be more successful for trees detection in contrast with any of them alone (Chen, et al. 2005, Zhang, C. 2010).
The objectives of this paper includes extraction of shadow free vegetation features from the digital images using shadow index and NDVI techniques, automated extraction of 3D information about vegetation features from the integrated processing of shadow free vegetation features image and LiDAR point cloud datasets and finally, automated extraction of trees from the vegetation objects based on multiple echo attribute of the LiDAR data. The remaining part of this paper describes, the study area and datasets used in section 2, the extraction technique in section 3, the results and discussion in section 4 and finally, the conclusion in section 5.
2.STUDY AREA AND DATA
2.1 Study Area
The study area is located in Besiktas district inside the city center of Istanbul in northwestern Turkey with a total area of 5,343 km2
(Başar, et al. 2011).
Istanbul is among the most special cities in the world with its position as a bridge between Europe and Asia. It is positioned between 280 01’ and 290 55’ eastern longitudes and 410 33’ and 400 28’ latitudes. Bosphorus strait (Figure 1) which connects the Sea of Marmara at the north and the Black Sea to its south divides the city into an Asian city closest to Europe and the closest European city to Asia (Gregory, Timothy E. 2010, Efe, et al. 2011). Istanbul is a typical urban area with complex spatial assemblages of vegetation, buildings, roads, and other man-made features.Figure 1. Map of Istanbul showingg the study area.
2.2 Datasets Used
The datasets used in this study were collected in 2013 by BIMTAS ccompany in Istanbul, Turkey, using airborne laser scanning system. These datasets include airborne multispectral digital image which has Red, Green, Blue and Near Infrared bands and LiDAR point cloud.
2.2.1 Airborne Multispectral Digital Image
Figure 2. RGB bands image
Figure 3. NIR band image
2.2.2 Airborne LiDAR Point Cloud
The LiDAR (Figure 4) data provides an accurate, georeferenced and highly effective 3D spatial information about the shape and surface characteristics of the study area through x, y and z points commonly referred as point cloud. It provides accurate height information which is missing in the digital images and also supporting information about crown shape (Hyyppä, et al. 2008).
Figure 4. Airborne LiDAR point cloud.
3.EXTRACTION TECHNIQUE
This section presents techniques and steps followed in order to achieve objectives of this paper See Figure 5, below for more details:
Figure 5. Work flow chart
3.1 Image Geo-Rectification
3.2 Shadow Index
Shadow index is an indicator which describes presence of shadow objects in a digital image. The presence of shadows of trees is a major problem during classification. Therefore, the shadow values of the digital image were determined using Equation 1 as given below:
SI = √ (256 – Red) (256 – NIR) (1) (Mustafa, et al. 2015).
where: NIR and Red are the Near Infrared and the Red bands respectively.
Furthermore, the shadow index image which provides precise shadows information was thresholded to detect absolute information. The threshold value for shadow image was estimated empirically, as 180. By utilizing this threshold value, a binary image was obtained with a value of 0 indicating the non-shadow objects and a value of 1 indicating the shadow objects.
3.3 Normalized Difference Vegetation Index (NDVI)
NDVI is an index of plant “greenness” or photosynthetic activity (Blanco, et al. 2008, Mróz, et al. 2004). It is based on the observation that different surfaces reflect different types of light differently. Photosynthetically active vegetation, in particular, absorbs most of the Red light that hits it while reflecting much of the Near Infrared light. Vegetation that is dead or stressed reflects more Red lights and less Near Infrared light. Likewise, non-vegetated surfaces have a much more even reflectance across the light spectrum. By taking the ratio of Red and Near Infrared bands from a remotely-sensed image, an index of vegetation “greenness” which ranges from -1 to +1 can be defined.
Therefore, the NDVI values of the digital image were determined on a per-pixel basis using Equation 2 as given below:
NDVI = (NIR - Red) / (NIR + Red) (2) (Mustafa, et al. 2015).
where; NIR and Red are the Near Infrared and the Red bands respectively.
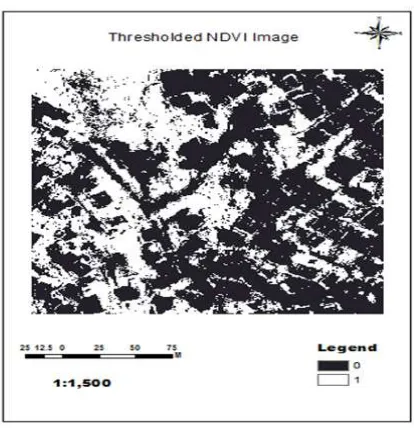
Furthermore, the NDVI image which provides precise information about vegetation features was thresholded to detect absolute information. The threshold value for NDVI image was estimated empirically, as 0.6. By utilizing this threshold value, a binary image was obtained with a value of 0 indicating non-vegetation features and a value of 1 indicating vegetation features.
3.4 Shadow Free Vegetation Features Image
Shadow free vegetation features image was determined by masking out shadow objects from the NDVI binary image. Hence, a binary image was created with a value
of 0 indicating non-vegetation objects and a value of 1 indicating shadow free vegetation objects.
3.5 Extracting 3D Information about Vegetation Features
In order to achieve this task, the shadows free vegetation features image and the LiDAR datasets were integrated to extract 3D information about the vegetation features. This task has been completely processed in an automated way using the Python programming.
3.6 Extracting 3D Information about Trees Features
The objects of interest (OI) in this study are the tree features. However, NDVI only helps to distinguish between vegetated and non-vegetated land cover, but it fails to discriminate shrubs and grasslands from trees. The reason is that the NDVI of a shrub and dense grasslands may have the same or nearby NDVI value as that of a tree object. Therefore, in order to get rid of any form of non-tree features, the LiDAR data was filtered based on its multiple echo (number of returns) attribute. The number of returns of a laser pulse usually helps to determine which feature the reflected pulse came from (e.g., ground, tree, building and so on). Basically, laser pulse with a multiple return are normally associated to vegetation objects while laser pulse with a single return are normally associated to features other than vegetation (Diaz, 2011).
Consequently, all LiDAR points with total number of return values equal to one (i.e. multiple echo = 1) have been filtered out from the vegetation LiDAR data while LiDAR points with total number of return values greater than one (i.e. multiple echo >1) were retained. The processing of the above task was completely accomplished in an automated way using the Python programming.
4.RESULT AND DISCUSSION
This section will exploit, discuss and interpret the research findings, based on the research methodology established in the previous section which is also in accordance with the research objectives as stipulated in this paper. The research results have been analyzed empirically with the goal of answering research questions in order to facilitate convincing conclusions which will in turn support decision making.
4.1 Shadow index
been achieved by applying Equation 1 given in section 3 to calculate shadow values of the digital image. The result of shadow index (Figure 6) is a new image file with shadow values ranging from 1 to 239. The white pixels which have high shadow values represent shadow objects while the black or dark grey pixels which have low shadow values represent objects without shadow.
Figure 6. Shadow index image
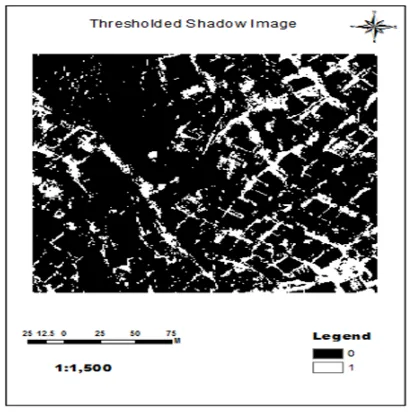
After applying an absolute threshold value to the shadow index image, a binary image (Figure 7) was determined with a value of 0 representing non-shadow objects (i.e. black colour pixels) and a value of 1 representing the shadow objects (i.e. white colour pixels). The threshold value for shadow index image was estimated empirically, as 180.
Figure 7. Shadow index image after applying a threshold
4.2 NDVI
The NDVI which is an index of plant greenness or photosynthetic activity has been used to calculate NDVI values of the digital image on a per-pixel basis by applying Equation 2 given in section 3. This helps to distinguished pixels which belong to vegetation features from pixels which belong to non-vegetation features on the digital image (Geerken, et al 2005, Moleele, et al. 2001). The output of this operation is a new image file (Figure 8) with values ranging from -1.0 to +0.98. The white pixels which have high NDVI values represent the vegetation objects while the black or dark grey pixels which have low NDVI values represent the non-vegetation objects.
Figure 8. NDVI image
Figure 9. NDVI image after applying a threshold.
4.3 Shadow Free Vegetation Image
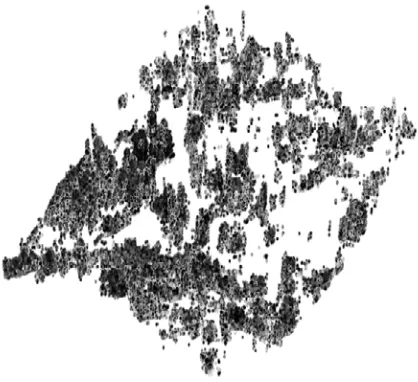
This has been achieved by removing shadow objects from the NDVI binary image. Thus, a binary image was created with a value of 0 indicating non-vegetation objects (i.e. black colour pixels) and a value of 1 indicating shadow free vegetation objects (i.e. white colour pixels). After the shaded areas have been removed, the final output (Figure 10) was then turned into an image which has only vegetation features without shadow objects. In this way, it became possible to get rid of the confusing spectral problem between reflected spectra of trees and their shadows.
Figure 10. Shadow free vegetation image.
4.4 Extracting 3D Information about Vegetation Features
3D information about vegetation features (Figure 11) has been obtained in a fully automated fashion by extracting LiDAR points which belong to vegetation features from integrated processing of shadow free vegetation image and LiDAR points cloud datasets.
Figure 11. 3D vegetation features
4.5 Extracting 3D Information of Tree Features
It is important to note that the object of interest in this study is tree object. However, critical analysis of previously extracted LiDAR data of vegetation features reveals that it consisted of trees and other unwanted vegetation objects such as grasslands and shrubs. This is due to the fact that the result obtained from NDVI only provide information about photosynthetically active vegetation or vegetation “greenness” which helps to distinguish between vegetated and non-vegetated land cover, but it fails to discriminate shrubs and grasslands from trees. This is owing to the fact that the NDVI value of a shrubs and dense grasslands may have the same or nearby value as that of a tree object. Therefore, in order to get rid of any form of non-tree features, the extracted vegetation LiDAR data was filtered based on its multiple echo properties. This LiDAR attribute helped to distinguish between trees and other non trees vegetation features (Carter, et al. 2012).
Figure 12. Trees extracted based on multiple echo.
5.CONCLUSION
This paper presented a workflow about semi-automated approach for urban trees extraction from integrated processing of airborne based LIDAR point cloud and multispectral digital image datasets. The paper proved that the integrated datasets are suitable technology and viable source of information for city managers to analyze, evaluate and enhance urban landscape patterns in order to gain a better understanding of the current composition, spatial distribution and states of trees in an urban area. Furthermore, the extracted information provides a snapshot of location, status and extent of trees in the study area which will be useful to city planners and other urban ecosystem decision makers to understand how much canopy cover exists, identify new planting, removal, or reforestation opportunities and what locations have the greatest need or potential to maximize benefits of return on investment. It can also help track trends or changes to the urban trees over time and inform future management decisions.
Although LiDAR points extracted based on multiple echo have removed significant amount of unwanted vegetation features from the dataset. However, systematic analysis of the extracted data reveals presence of leftover of these undesirable vegetation features such as shrubs which must have to be completely discarded from the dataset. Therefore, future work should concentrate on developing an approach or techniques which can be used to completely filter out these undesirable LiDAR points of non-tree features from the dataset. In addition, the designed algorithms have so far only been tested over the Istanbul urban area. Further research is needed in other urban areas with different species, forest compositions and structural complexity in order to examine the robustness and extensibility of these techniques.
REFERENCES
Başar, A., Çatay, B. and Ünlüyurt, T., 2011. A
multi-period double coverage approach for locating the emergency medical service stations in Istanbul. Journal of the Operational Research Society, 62(4), pp.627-637.
Blanco, L.J., Aguillera, M.O., Paruelo, J.M., and F.N. Biurrun. 2008. Grazing effect on NDVI across an aridity gradient in Argentina. Journal of Arid Environments 72(5):764-776.
Brolly, G., Király, G., & Czimber, K. 2013. Mapping forest regeneration from terrestrial laser scans. Acta Silvatica et Lignaria Hungarica, 9(1), 135-146.
Caldwell, J. 2005. Merging technologies – LIDAR complements multispectral imagery. Earth Imaging Journal.
Carter, J., Schmid, K., Waters, K., Betzhold, L., Hadley, B., Mataosky, R. and Halleran, J. 2012. LiDAR 101: An introduction to LiDAR technology, data, and applications. National Oceanic and Atmospheric Administration (NOAA) Coastal Services Center. Charleston, SC.
Chen, L., Chiang, T., and Teo, T. 2005. Fusion of LiDAR data and high resolution images for forest canopy modelling. In Proc. 26th Asian Conf. on Remote Sensing.
Coops, N. C., Hilker, T., Wulder, M.A., St-Onge, B., Newnham, G., Siggins, A. and Trofymow, J.T. 2007. Estimating canopy structure of Douglas-fir forest stands from discrete-return LiDAR. Trees, 21(3), pp. 295-310.
Diaz, J. C. F. 2011. Lifting the canopy veil: airborne LiDAR for archeology of forested areas. Imaging Notes Magazine, 26(2), pp. 31-34.
Efe, R. and Cürebal, I., 2011. Impacts of the “Marmaray” project (Bosphorus Tube crossing, tunnels, and stations) on transportation and urban environment in Istanbul. In Engineering Earth (pp. 715-733). Springer Netherlands.
FLOOD, M., 2002, Product definitions and guidelines for use in specifying LiDAR deliverables. Photogrammetric Engineering and Remote Sensing, 68, pp. 1230–1234.
Geerken, R., Zaitchik, B., and J.P. Evans. 2005. Classifying rangeland vegetation type and coverage from NDVI time series using Fourier Filtered Cycle Similarity. International Journal of Remote Sensing 26(24, pp. 5535-5554.
Gregory, T.E., 2010. A history of Byzantium (Vol. 19). John Wiley & Sons.
laser scanning data and aerial photographs. Proceedings of SilviLaser, 2008, p. 8.
Holmgren, J. and Persson, Å. 2004. Identifying species of individual trees using airborne laser scanner. Remote Sensing of Environment, 90(4), pp. 415-423.
Holmgren, J., Persson, A and Soderman, U. 2008. Species identification of individual tree by combining high resolution LiDAR data with multispectral image. International Journal of Remote Sensing, 29 (5), pp. 1537-1552.
Hudak, A.T., Evans, J.S. and Stuart Smith, A.M. 2009. LiDAR utility for natural resource managers. Remote Sensing, 1(4), pp. 934-951.
Hyypa, J., Hyppa, H., Leckie, D., Gougeon, F., Yu, X., and M., Maltamo, 2008. Review of methods of small-footprint airborne laser scanning for extracting forest inventory data in boreal forests. International Journal of Remote Sensing, 29(5), pp. 1339-1366.
Hyyppä, J.U.H.A., Hyyppä, H., Yu, X., Kaartinen, H.A.R.R.I., Kukko, A.N.T.E.R.O. and Holopainen, M., 2009. Forest inventory using small-footprint airborne LiDAR. Topographic Laser Ranging and Scanning: principles and processing, pp. 335-370.
Jawak, S. D., Panditrao, S. N., and Luis, A. J. 2013. Validation of High-Density Airborne LiDAR-Based Feature Extraction Using Very High Resolution Optical Remote Sensing Data. Advances in Remote Sensing, 2013.
Lang S., Tiede D., Maier B. and Blaschke T. 2006 3D Forest Structure Analysis from Optical and LIDAR Data, Revista Ambiência, Guarapuava, v.2 Edição Especial, Vol. 1, No. 1, pp. 95-110.
MacFaden, S. W., O’Neil-Dunne, J. P., Royar, A. R., Lu, J. W., & Rundle, A. G. 2012. High-resolution tree canopy mapping for New York City using LIDAR and object-based image analysis. Journal of Applied Remote Sensing, 6(1), 56-71.
McPherson, E.G., 2006. Urban forestry in North America, Renewable. Resources Journal, 24, pp. 8–12.
Moleele, N., Ringrose, S., Arnberg, W., Lunden, B., and C. Vanderpost. 2001. Assessment of vegetation indexes useful for browse (forage) production in semi-arid rangelands. International Journal of Remote Sensing 22(5) pp. 741-756.
Mróz, M. and Sobieraj, A., 2004. Comparison of several vegetation indices calculated on the basis of a seasonal SPOT XS time series, and their suitability for land cover and agricultural crop identification. Tech. Sci, 7, pp. 39-66.
Mustafaa, Y. T., Habeebb, H. N., Steinc, A., and Sulaimanb, F. Y. 2015. Identification and Mapping of Tree Species in Urban Areas Using WORLDVIEW-2 Imagery. ISPRS Annals of Photogrammetry, Remote Sensing and Spatial Information Sciences, pp. 1, 175-181.
Nowak, D.J. and Crane, D.E., 2007. Carbon storage and sequestration by urban trees in the USA. Environmental pollution, 116(3), pp. 381-389.
Patenaude G., Hill R. A., Milne R., Gaveau D. L. A., Briggs B. B. J. and Dawson T. P. 2004. Quantifying Forest above Ground Carbon Content Using LiDAR Remote Sensing, Remote Sensing of Environment, Vol. 93, No. 3, pp. 368-380.
Plowright, A. 2015. Extracting trees in an urban environment using airborne LiDAR. GSS cIRcle Open Scholar Award (UBCV Non-Thesis Graduate Work).
Reitberger, J., Krzystek, P. and Stilla, U., 2009. Benefit of airborne full waveform LiDAR for 3D segmentation and classification of single trees. In ASPRS 2009 Annual Conference pp. 1-9.
Savopol, F., and Armenakis, C. 2004. Assessment of LiDAR and Digital Camera Data in the Context of Rapid Change Detection Methodologies. ISPRS, Commission IV, WG IV/7.
Seielstad, C.A. and Queen, L.P., 2003. Using airborne laser altimetry to determine fuel models for estimating fire behavior. Journal of Forestry, 101(4), pp. 10-15.
Vierling, K. T., Vierling, L. a, Gould, W. a, Martinuzzi, S., and Clawges, R. M. 2008. LiDAR: shedding new light on habitat characterization and modeling. Frontiers in Ecology and the Environment, 6(2), pp. 90–98. doi:10.1890/070001.
Woods, M., Lim, K., and Treitz, P. 2008. Predicting forest stand variables from LiDAR data in the Great Lakes – St. Lawrence forest of Ontario. The Forestry Chronicle, 84(6), pp. 827–839.doi:10.5558/tfc84827-6.
Yang, J., 2012. Urban forestry in challenging environments. Urban Forestry & Urban Greening, 11(2), pp. 103-104.
Zhang, C., 2010. Urban forest inventory using airborne LiDAR data and hyperspectral imagery (Vol. 74, No. 01).