Selectivity of chemoreceptor neuron
A.K. Vidybida *
Bogolyubo6Institute for Theoretical Physics,Metrologichna str.,14-B,Kyi603143,Ukraine
Abstract
Discriminating ability (selectivity) of chemoreceptor neuron is compared with that of its receptor proteins. The process of neuronal triggering is expected to be cooperative and threshold-type in a sense that the neuron can fire if and only if the number of its receptor proteins, which are bound with odor molecules, is above a definite threshold. Both deterministic and stochastic pictures are considered. The stochastic case is treated based on birth and death stochastic process and first passage technique. In both pictures, it is shown that a chemoreceptor neuron can have much a higher selectivity than its individual receptor proteins, provided the chemical stimuli are presented at low concentrations, and the threshold is high enough. This is in agreement with a preliminary estimate based on simplified probabilistic reasoning (Vidybida, A.K., 1999. Cooperative mechanism for improving the discriminating ability in the chemoreceptive neuron. Binomial case. Biol. Cybern. 81, 469 – 473). The mechanism of selectivity improvement is similar to that described before in cooperative chemical systems. A possibility for this mechanism to be valid at higher stages of processing of chemical signals, as well as in other sensory systems is discussed. © 2000 Elsevier Science Ireland Ltd. All rights reserved.
Keywords:Sensory systems; Selectivity; Cooperativity; Threshold; Olfaction; Chemoreception; Stochastic process
www.elsevier.com/locate/biosystems
1. Introduction
In sensory systems, the discriminating ability increases while the sensory signal travels along the corresponding sensory pathways. Improving of discriminating ability at higher levels of process-ing of sensory signals has been found experimen-tally for vision (Norton et al., 1988; Smallman et al., 1996), hearing (de Vries, 1948; Price, 1978), electroreception (Bastian, 1994), olfaction (Kaissling, 1987; Duchamp-Viret and Duchamp, 1997).
All sensory systems have common structural and functional features. First, the systems have hierarchical structure, second, their functioning is of threshold type: a threshold must be exceeded for passing the signal from one stage to another in the hierarchy. When any noise is absent (deter-ministic situation), a single stage processing struc-ture with adjustable reception threshold could ensure arbitrary high sensitivity, because the sen-sitivity is the same as the threshold height in this case. Two stage hierarchy with a modest selectiv-ity at first stage and adjustable threshold at the second one could ensure arbitrary sharp selectiv-ity in the whole system (Fig. 1). In the presence of internal noise the process of signal reception and * Tel.: +380-44-2669468; fax:+380-44-2665998.
E-mail address:[email protected] (A.K. Vidybida).
processing becomes stochastic, and this imposes limits on otherwise unlimited improvement of in-formational quality by means of proper chosen thresholds.
In the chemoreceptor neuron, the chemical stimulus processing may be roughly described as a two stage process (Fig. 2). At first stage, the odor molecules are bound with and released by the receptor proteins (Margolis, 1987; Ressler et al., 1994), at the second stage, due to cooperative action of many bound receptor proteins, the neu-ron fires a spike. The receptor proteins have initial selectivity, and there is a threshold at the second stage. The purpose is to estimate a possible selec-tivity of chemoreceptor neuron as compared to selectivity of its receptor proteins. The determinis-tic case is considered based on idealized strength-duration dependence. In the stochastic case, the fluctuations in the binding-releasing statistics are taken into account based on standard techniques for birth and death processes.
The main conclusion of this paper is that the chemoreceptor neuron can have much better dis-criminating ability than its receptor proteins does, provided the stimuli are presented in low concen-trations, and the total and threshold number of receptor proteins per single neuron are large enough.
2. Methods
Having in mind the purpose to analyze selectiv-ity in the context of threshold and binding-releas-ing statistics, the simplest possible model preserving that context was used. In this model, the binding-releasing of chemical stimulus by a single receptor protein takes place in accordance to the following chemical reaction:
O+RX
k+
k−
OR, (1)
whereO is the stimulus molecule, Ris the recep-tor protein, OR is the receptor protein occupied with chemical stimulus molecule. The receptor neuron in the model is reduced to a set of N
identical receptor proteins incorporated in an ex-citable membrane (Fig. 2).
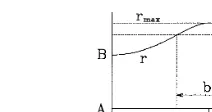
Fig. 1. Organization of sharp selectivity in a two level struc-ture influenced by a set of stimuli parameterized withv(e.g. microwaves). The curverrepresents response level of primary structure; th is the threshold for channeling signal to the second structure; vmax is the frequency of maximal response. Selectivity is defined as S=1/b.S tends to infinity when th approaches the maximal response,rmax(from Vidybida, 1995). If the stimulus O is applied at concentration [O]=c, in the stationary state, the mean fraction
pof bound receptors due to Eq. (1) is given by the following expression:
p=1/(1+[O]1/2/c), (2)
where [O]1/2=k−/k+. If another stimulus, O% with another rate constants,k%+,k%−, is applied at the same concentration, then Eq. (2) may give another value, p%.
A single receptor discriminates between O and
O% if p"p%, or [O]1/2"[O%]1/2. One expects for definiteness that p\p%, or equivalently
[O´ ]1/2\[O]1/2. (3)
The quality of discrimination can be expressed either as m=p/p%\1, or k=[O%]1/2/[O]1/2\1.
The definition of discrimination at the neuronal level is given separately for deterministic and stochastic situation.
2.1. Deterministic situation
In this situation the reasoning is provided in terms of mean values, and statistical fluctuations are neglected. This could be approved for very large number N.
With each bound receptor OR an elementary depolarizing currentiis associated. Thus, the total mean depolarizing current I due to application either O, or O% at concentration cwill be
I=Npi, I%=Np%i. (4)
For describing the neuronal activity under stim-ulations (4) the idealized strength-duration rela-tionship is used (Noble and Stein, 1966):
I=IRh(1−e−t/t)−1, (5)
where t is the duration of current I, which is required for triggering (interspike interval);IRh is
the rheobasic current — the greatest lower bound of currents which are able to trigger; t is the membrane time constant. For the giant squid axon
IRh=2.241 mA, t=2.856 ms (Noble and Stein, 1966). The relationship (5) gives a threshold with respect to stimulating current: IIRh[t .
The rheobasic current can be expressed in terms of threshold number,N0of bound receptor proteins,
which is necessary for triggering:N0=IRh/i. Eq. (5)
can be rewritten in the following form:
Np=N0(1−e−t/t)−1, (6)
where p is given by Eq. (2).
The neuronal selectivityn is expressed in terms of interspike intervals or firing frequencies as follows:
n=t%/t, (7)
wheret,t%are the interspike intervals under stimuli
O, O%, respectively, which are applied at equal concentrations.
2.2. Stochastic situation
If numbersN,N0are not very large, the
statisti-cal fluctuations become essential. In this case the number of bound receptors at time t,n(t) should be considered as realization of birth and death stochastic process described by a set of transition probabilities
p(n,tn%,t%), t%5t,
05n5N, 05n%5N, p(n,tn%,t)=dnn%. If one expected that during an infinitely small period of time only a single birth or death event may happen (ordinary process, Gnedenko, 1962) then the evolution of transition probabilities is given by the backward Master equation:
(p(n,tn%,t%)
where the infinitesimal transition probabilities r+ (n), r−(n) are derived from Eq. (1): r+(n)=
k+(N−n)[O],r−(n)=k−n. The depolarizing current due to chemical stimulation, I(t)=in(t), will be the fluctuating quantity which should be used as stimulating current in the Hodgkin and Huxley set of equations (Hodgkin and Huxley, 1952) in order to estimate mean firing rates f, f% under stimuli O, O%. The neuronal selectivity can be defined analogously to Eq. (7): n=f/f%. The straightforward treatment of this task would be numerical analysis similar to that made in (Vidy-bida, 1996) for another stochastic stimuli in the Hodgkin and Huxley set of equations. In this paper the numerical treatment is not applied. Instead, a limiting case is considered allowing one to obtain an analytical conclusion. Namely, expect that the triggering happens immediately after the number
n(t) of bound receptor proteins achieves the firing threshold N0. In the framework of Hodgkin and
Huxley equations, this condition might be satisfied if the membrane specific capacitance,CMtends to
Let one denote the mean time between two consecutive crossings the thresholdN0by the n(t)
from above and below as W; the mean time between two consecutive crossings the threshold
N0 by the n(t) from below and above as T; the
spike duration (refractory time included) as t0.
Then the mean number of spikes,n¯t during timet can be estimated as
n¯t=(t/t0) · (T/(T+W)), (9)
and the mean firing frequency — as
f=n¯t/t=PT/t0, (10)
where
PT=T/(T+W) (11)
is the probability to find at any moment of time
N05n(t)5N. The neuronal selectivity can be
estimated as
n=f/f%=PT/P%T. (12)
Actually, Eq. (9) gives underestimated number because the last spike in a series can finish after the moment when the threshold is crossed from above. This possibility to get one extra spike in a series can be ignored provided there are many spikes in the series:
T/t01. (13)
The timesT,Wcan be calculated based on Eq. (8) by means of the standard mean waiting time (first passage) techniques1:
W= %
05lBN0
B(N,l,p)/(N0k−B(N,N0,p)),
T= %
N05l5N
B(N,l,p)/(N0k−B(N,N0,p)), (14)
where B(N,l,p)=ClNpl(1−p)N−l, and p is the probability to find any receptor protein bound with O, which is calculated in Eq. (2).
3. Results
3.1. Deterministic situation
For stimuli O, O%, let one introduce the threshold concentrations:
[O]0=[O]1/2p0/(1−p0), [O%]0
=[O%]1/2p0/(1−p0),
where p0=N0/N.
[O%]
0\[O]0, (15)
due to Eq. (3). In this case, for perfect discrimina-tion between OandO% it is enough to apply each stimulus at concentration which satisfies the fol-lowing condition
[O]0BcB[O%]0,
and which exists due to Eq. (15). In this condition the stimulus O% will not be able to cause trigger-ing, whereas Owill cause spiking with some fre-quency. If the stimuli are applied at concentration
c\[O%]0 then interspike intervals t, t% will differ,
t%\t. The intervals can be compared based on Eq. (6):
n=t%/t=ln(p%/(p%−p0))/ln(p/(p−p0)).
Due to Eq. (3)p%Bpfor all concentrationsc. If
c[O%]
0, (16)
then p%p0, and t% , as well as
pp0(1+o), (17)
where
o=(k−1)(1−p0)/(1+p0(k−1))\0. (18)
Therefore, at cond. (16) p−p0]op0\0 which
ensures finite interspike interval for O.
In particular, the concentrationc=[O%]0can be chosen. In this caseO%will not trigger whereas O will trigger with finite frequency. The numerical value of this frequency is important, because very rare spikes do not represent practical interest. Inversely, if a frequency, say 1 Hz, is considered as practically suitable, how close could p and
p%=p
0 be? The estimate can be found based on
Eq. (6) and numerical value t3 ms, which is mentioned above. From Eq. (6) one has
Fig. 3. Dependence of selectivity on concentration at which both stimuli are applied. Here [O%]1/2/[O]1/2=1.01,N0/N=0.1. The interspike intervaltforOis14.2 ms for all concentra-tions presented in thex-axis.
Thus, for n−1 one has
n−1B
p% pN0
1−p% 1−pN−N0
=exp
N0ln p%p+(N−N0)ln
1−p% 1−p
Bexp
−Nln(1+o)p0−p 1−p,where p0=N0/N. This gives for n
n\exp(Nln(1+o)(p0−p)/(1−p)), (22)
or finally2
n\mN(p0−p)/(1−p). (23)
From Eqs. (22) and (23) it can be concluded that the selectivity of the chemoreceptor neuron as a whole could be very high for modest selectiv-ity in a single receptor protein, provided the stim-uli O, O% are presented at concentration c, which is subthreshold:
N0/N\p=1/(1+[O]1/2/c)U
cB[O]1/2N0/(N−N0). (24)
Some examples are given in the Table 1. The course of selectivity and mean firing frequency when stimuli concentration changes is given in Fig. 4.
As regards the condition (13), it could be sa-tisfied for relatively slow reactions (1). Situation is illustrated in Fig. 5.
4. Discussion
In this paper a selectivity of model chemorecep-tor neuron is compared with that of recepchemorecep-tor proteins incorporated in its membrane. Based on realistic structural and functional features of the neuron, it was concluded that the selectivity of neuron as a whole can be significantly improved. These features are: (i) two-level hierarchy of signal
t=tln(p/(p−p0)). (19)
Substituting Eq. (17) into Eq. (19) one has: 1000=3 ln(1+1/o), and further
o10−100. (20)
In terms of [O]1/2, [O%]1/2one has from Eq. (18):
k=o+1−p0(o+1)/(1−p0(o+1))
:1+o1+10−100. (21)
Thus, in deterministic picture, selectivity could be extremely precise, provided the concentrations of stimuli are maintained with similar precision (Fig. 3). The same configuration could be used for measuring very small differences in concentration of a single odor, if such small differences would be meaningful (see Section 4).
3.2. Stochastic situation
In accordance with Eq. (12), the selectivity of the whole neuron can be estimated as follows. Denoteo=p/p%−1\0. For the probabilityP%Tto findn(t)]N0if the stimulusO%is applied one has
from Eq. (11), Eq. (14)
P%T= T%
T%+W%=N %
05k5N
CNkp%k(1−p%)N−k
B
p%
p
N0
1−p%1−p
N−N0
PT.
Table 1
Numerical examples of improved selectivitya
m n
200 0.033 1.05 1.05 9.22 1.52
5000
aThe firing rateffor theOis calculated asP
T/t0. reception; (ii) a threshold for channeling signal from the first level to the second one.3 The
threshold concept is double-bounded with the con-cept of cooperativity. Indeed, there is a cooperativ-ity behind the firing threshold, because the threshold emerges due to cooperation between voltage-dependent sodium channels. On the other hand, there is a cooperativity in front of the threshold, because due to it the elementary inputs must cooperate in order to trigger further stages of information processing. Therefore, the mechanism of selectivity improvement described in this paper is treated, as well as similar mechanisms in trigger-ing states in bistable chemical system (Vidybida, 1995), in triggering degranulation in cytolytic T-lymphocyte (Vidybida, 1991), in improving tempo-ral discrimination during synaptic integration (Vidybida, 1996) as cooperative mechanisms.
The selectivity of chemoreceptor neuron is treated in deterministic and stochastic paradigm. In both paradigms the summation of elementary de-polarizing currents generated by bound receptor proteins is treated as first stage of signal reception. The spike triggering is considered as the second stage. The first stage selectivity, which is expressed in terms of compound stimulating current or recep-tor potential (Kaissling, 1977), should be the same as that of single receptor protein expressed in terms of binding probability with odor. In both
paradigms the selectivity is improved at the second stage. In the deterministic paradigm all fluctuations are ignored, and neuronal response to chemical stimulus is estimated based on idealized strength-duration curve. This curve possesses a threshold for triggering, and this makes possible to improve discriminating ability enormously (Eqs. (20) and (21)). The small concentration differences evalu-ated in Eqs. (20) and (21) fall far beyond the meaningful limits for concentration definition. In-deed, concentration in a volume Vis subjected to fluctuations, which are proportional to 1/N, where N is the mean number of molecules in V
(Kittel, 1959). In case of chemoreceptor neuron a space in the vicinity of, e.g. olfactory cuticle can be taken asV. This volume cannot contain more than
1018molecules. Therefore, in Eqs. (20) and (21)
onlyo]10−9does make sense. The much smaller
numbers displayed in Eqs. (20) and (21) simply demonstrate that without taking into account the
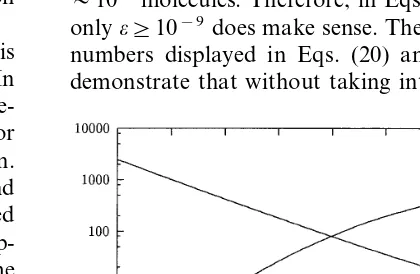
Fig. 4. Dependence of selectivity and firing frequency on concentration at which both stimuli are applied. Here [O]0= 0.67[O]1/2, k=1.05, N=5000, N0=2000, f is calculated in accordance to Eq. (10) witht0=1 ms.
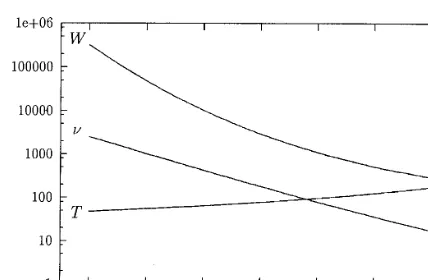
Fig. 5. Mean times,T,Wbetween consecutive crossings of the threshold vs. concentration. Here k−=0.1 s−1, N=5000,
N0=2000,TandWare in ms.
is adopted here (Fig. 2), is simplified, but it seems that the second messenger stage can be introduced with preserving conclusions of this paper. The numerical data used for calculation (Table 1) are partially taken from experiment (N), and partially chosen deliberately (N0,m), because required
ex-perimental data are not available.4Therefore, it is
not clear, what the above cooperative mechanism, if present in real olfactory or taste system, might serve for: to obtain a sharply selective neuron starting from modestly selective proteins (first row in the Table 1), or to obtain a reasonably selective neuron starting from proteins with poor selectiv-ity (second row in the Table 1). Finally it could be mentioned that the same mechanism might be effective at the first relay point after the receptor neuron, because both the structural and func-tional features necessary for its operation are presented there. In this connection, it is interest-ing that in frogs, decreasinterest-ing of odor concentration leads to more pronounced selectivity improve-ment in bulbar neurons as compared with selectiv-ity of the receptor neurons (Duchamp-Viret et al., 1990, p. 260), which is in concordance with con-clusions of this mechanism (Fig. 4, Eq. (24)).
Acknowledgements
The author thanks to Osaka University for a support during attendance the NeuroCod’99 Workshop, and to K.-E. Kaissling for helpful discussion and reference information, and to anonymous referees for critical remarks.
References
Bastian, J., 1994. Electrosensory organisms. Phys. Today 47 (2), 30 – 37.
van Drongelen, W., Holley, A., Døving, K.B., 1978. Conver-gence in the olfactory system: quantitative aspects of odour sensitivity. J. Theor. Biol. 71, 39 – 48.
Duchamp-Viret, P., Duchamp, A., 1997. Odor processing in the frog olfactory system. Prog. Neurobiol. 53, 561 – 602. Duchamp-Viret, P., Duchamp, A., Sicard, G., 1990. Olfactory
discrimination over a wide concentration range. Compari-son of receptor cell and bulb neuron abilities. Brain Res. 517, 256 – 262.
stochastic nature of odor reception unrealistically a good estimate can be obtained.
In the stochastic paradigm the binding-releasing process (1) is treated as birth and death process producing internal noise, which prevents from unlimited selectivity improvement mentioned in Fig. 1. The triggering is expected to happen imme-diately when the number of bound receptors reaches the firing threshold. This might bring the firing rate independent of the stimulus intensity in deterministic paradigm, where the intensity must be just superthreshold (Fig. 3). In the stochastic paradigm, the selectivity improvement takes place only at subthreshold stimulation. In this case the triggering happens due to superthreshold fluctua-tions, probability of which depends on the stimu-lus intensity. Therefore a kind of stimustimu-lus- stimulus-reaction relationship is preserved (Fig. 4).
The route to spiking, which is considered here is ‘one threshold crossing — many spikes’ (Eq. (13)). This requires relatively slow processes in reaction (1) (Fig. 5). Another route, ‘many threshold crossings — single spike’ is possible as well. It is not clear which one takes place in reality. The receptor neuron construction, which
4Actually,N
Gnedenko, B.V., 1962. The Theory of Probability. Chelsea, New York.
Hodgkin, A.L., Huxley, A.F., 1952. A quantitative description of membrane current and its application to conduction and excitation in nerve. J. Physiol. 117, 500 – 544.
Kaissling, K.-E., 1987. In: Colbow, K. (Ed.), R.H. Wright Lectures on Insect Olfaction. Simon Fraser University, Burnaby, B.C., Canada, p. 190 S.
Kittel, C., 1959. Elementary Statistical Physics. Chapman, London, p. 278.
Kaissling, K.-E., 1977. Structure of odor molecules and multi-ple activities of receptor cells. In: Le Magnen, J., Mac Leod, P. (Eds.), Olfaction and Taste IV. London, Paris, pp. 9 – 16.
Margolis, F.L., 1987. Olfactory receptor neurons: specific gene expression and a hypothetical model for stimulus recep-tors. Discuss. Neurosci. 4 (3), 47 – 52.
Noble, D., Stein, R.B., 1966. The threshold conditions for initiation of action potentials by exitable cells. J. Physiol. 187, 129 – 162.
Norton, T.T., Casagrande, V.A., Irvin, G.E., Sesma, M.A., Petry, H.M., 1988. Contrast-sensitivity function of W-, X-, and Y-like relay cells in the lateral geniculate nucleus of bush baby. J. Neurophysiol. 59, 1639 – 1656.
Price, G.R., 1978. Action potentials in the cat at low sound intensities: thresholds, latencies, and rates of charge. J. Acoust. Soc. Am. 64, 1400 – 1405.
Ressler, K.J., Sullivan, S.L., Buck, L.B., 1994. Information coding in the olfactory system: evidence for a stereotyped and highly organized epitope map in the olfactory bulb. Cell 79, 1245 – 1255.
Rospars, J.-P., Fort, J.-C., 1994. Coding of odour quality: roles of convergence and inhibition. Network Comput. Neural Syst. 5, 121 – 145.
Smallman, H.S., MacLeod, D.I.A., He, S., Kentridge, R.W., 1996. Fine grain of the neural representation of human spatial vision. J. Neurosci. 16 (5), 1848 – 1855.
Vidybida, A.K., 1991. Selectivity and sensitivity improvement in co-operative system with a threshold in the presence of thermal noise. J. Theor. Biol. 152, 159 – 164.
Vidybida, A.K., 1995. Estimation of possible selectivity and sensitivity of a cooperative system to low-intensive mi-crowave radiation. Phys. A 221, 30 – 40.
Vidybida, A.K., 1996. Neuron as time coherence discrimina-tor. Biol. Cybern. 74, 539 – 544.
de Vries, H., 1948. Brownian movement and hearing. Physica 14, 48 – 60.
![Fig. 3. Dependence of selectivity on concentration at whichboth stimuli are applied. Here [tions presented in theThe interspike intervalO�]1/2/[O]1/2=1.01, N0/N=0.1](https://thumb-ap.123doks.com/thumbv2/123dok/3141344.1383118/5.612.45.257.48.186/dependence-selectivity-concentration-whichboth-stimuli-presented-interspike-intervalo.webp)