The use of hedges to reduce winter wheat losses caused by
Italian ryegrass (
Lolium multiflorum
)
M.A. Martı´nez-Ghersa
a,*, C.M. Ghersa
a, S.R. Radosevich
b, D.O. Ferraro
aaIFEVA,Department of Natural Resources and En6ironment,Faculty of Agronomy,Uni6ersity of Buenos Aires, A6.San Martı´n4453,Buenos Aires1417,Argentina
bDepartment of Crop and Soil Science,Oregon State Uni6ersity,Cor6allis,OR97331, USA
Received 22 February 2000; accepted 9 August 2000
Abstract
We hypothesized that short duration plant interference aiming to change mainly light intensity and red:far red ratio during crop establishment in Italian ryegrass-infested winter wheat fields, could hinder the development of Italian ryegrass and thus reduce its effect on wheat yield. To test this hypothesis, wheat was planted between previously established live (low red:far red ratio) or dead (high red:far red ratio), barnyardgrass or maize, plant hedges. Experimental results demonstrated that the presence of live or dead plant hedges during the first 30 days of crop establishment and also hedge orientation were important factors regulating weed and crop biomass production and competitive relationships. In barnyardgrass hedge treatments wheat yield was improved up to 67% and Italian ryegrass production was reduced by more than 20%. In plots with maize live hedges oriented N – S the biomass production of wheat was independent of production of Italian ryegrass. Data presented here suggests that there is room for developing weed control technologies on the basis of understanding photosensory processes of weed and crop species. © 2001 Elsevier Science B.V. All rights reserved.
Keywords:Weeds; Competition; Light; Red/far red ratio; Yield
www.elsevier.com/locate/eja
1. Introduction
Tactics to reduce the negative effects of weeds on crop performance generally include the use of herbicides and soil tillage (Aldrich, 1984; Altieri, 1988; Navas, 1991; Tivy, 1990). Herbicide use has allowed agriculture to keep pace with human
population growth (Altieri and Liebman, 1988). However, the increased emphasis on herbicide use has sometimes resulted in fewer crop rotations and caused alternative techniques of weed control to be abandoned, which leads to even more inten-sive herbicide use. This inteninten-sive use selects for resistance in some plant species and generates concerns about contamination of ground water and human toxicity (Gressel, 1991).
Many symposia, review papers and texts (Ra-dosevich et al., 1997) stress the importance of
* Corresponding author. Fax: +1-541-7371393.
E-mail address: [email protected] (M.A. Martı´nez-Ghersa).
research in weed biology to develop information on new cultural methods of weed management. Yet few researchers demonstrate how weed biol-ogy actually can be used to improve weed control (Holt, 1995; Radosevich et al., 1997). Recent re-search suggests that manipulation of the light environment near the soil surface could be an additional weed management strategy in cropping systems (Ballare´ et al., 1987; Ballare´, 1993; Ballare´ et al., 1992; Benech Arnold et al., 1990; Ghersa et al., 1994). This strategy requires identification of differences in crop and weed response to environ-mental signals. With such information, light envi-ronments can be created that deliver the appropriate signals to promote crop performance and/or inhibit weed species.
Crops and weed species generally differ in their response to changes in environmental signals be-cause plant breeding tends to reduce architectural plasticity of crops (Patterson, 1985). For example, Italian ryegrass (Lolium multiflorum) is a weed in
Fig. 2. Layout of experimental plots for studying the effect of orientation and spacing of live and dead maize hedges on wheat and Italian ryegrass relative performance (see text for details). General plot layout showing the two hedge row orientations (N – S and E – W) and the demarcation of areas containing sprayed (brown) and nonsprayed (green) hedges (A), maize hedge spacings used in the study and placement of the biomass sampling plots within the hedge spacings (B).
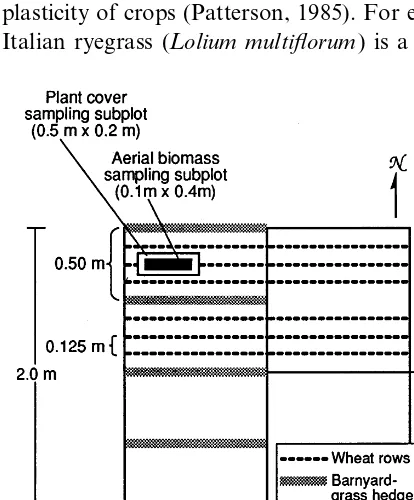
Fig. 1. Layout of experimental plots for studying the effect of short-term shading with barnyardgrass hedges on wheat and Italian ryegrass biomass production in high-and low-density Italian ryegrass plots.
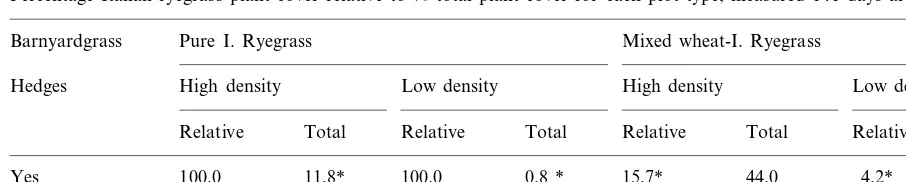
Table 1
Percentage Italian ryegrass plant cover relative to % total plant cover for each plot type, measured 141 days after wheat sowinga
Pure I. Ryegrass
Barnyardgrass Mixed wheat-I. Ryegrass
Hedges High density Low density High density Low density
Total Relative Total Relative
Relative Total Relative Total
Yes 100.0 11.8* 100.0 0.8 * 15.7* 44.0 4.2* 37.9
No 100.0 31.2 100.0 3.5 46.3 39.6 33.8 33.0
aWithin each column of values, * denotes a significant (PB0.05) difference between barnyardgrass and non-barnyardgrass plot
means.
In this study, we tested the hypothesis that manipulating some agronomic variables, aiming to produce changes especially in the light environ-ment during early stages of the crop, can improve wheat ability to compete with ryegrass. Live and dead hedges grown with summer annuals (barn-yardgrass and maize), separated by various dis-tances, were used to reduce the ground-level light intensity and alter the R:FR ratio during winter wheat seedling establishment in Italian ryegrass infested plots.
2. Materials and methods
2.1. Experiment 1
A factorial experiment was established to deter-mine the effect of short-term shading, using barn-yardgrass (Echinochloa cruss-galli) hedges, on wheat (Triticum aesti6um) and Italian ryegrass
biomass production. A split-split plot experimen-tal design with three replications was used. High or low-density Italian ryegrass seed banks were
Table 2
Vegetative and reproductive biomass of wheat and Italian ryegrass grown in pure stands and mixed plots, at high or low Italian ryegrass seed bank density and harvested from 0.04 m2 sampling plots at the end of the growing cyclea
Species
Wheat
Italian ryegrass seed bank density Barnyard
grass
Low High Low
Hedges High
Reproductive biomass (g) Vegetative biomass (g)
65* 72*
Yes 60* 61*
No 42 45 43 36
Ryegrass
Pure stand Mixed stand Pure stand Mixed stand Pure stand Mixed stand Pure stand Mixed stand Reproductive biomass (g)
Vegetative biomass (g)
6* 6*
Yes 16* 8* 9 3 5 5
No 19 15 10 17 10 3 4 8
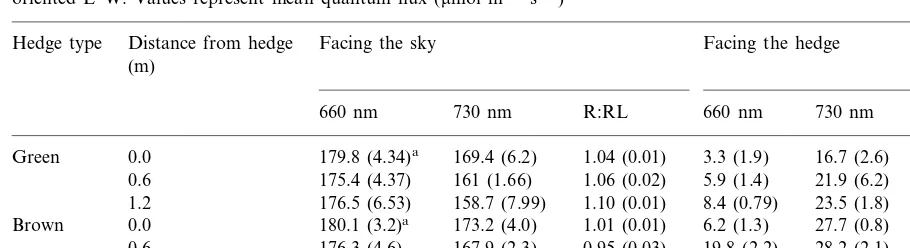
Table 3
The effect of live (green) and dead (brown) hedges on the light microenvironment at ground level on the South side of hedges oriented E–W. Values represent mean quantum flux (mmol m−2s−1)
Distance from hedge Facing the sky Facing the hedge Hedge type
(m)
660 nm 730 nm R:RL 660 nm 730 nm R:RL
179.8 (4.34)a 169.4 (6.2) 1.04 (0.01) 3.3 (1.9)
Green 0.0 16.7 (2.6) 0.20 (0.08)
175.4 (4.37) 161 (1.66) 1.06 (0.02)
0.6 5.9 (1.4) 21.9 (6.2) 0.26 (0.03)
1.2 176.5 (6.53) 158.7 (7.99) 1.10 (0.01) 8.4 (0.79) 23.5 (1.8) 0.36 (0.05) 0.0
Brown 180.1 (3.2)a 173.2 (4.0) 1.01 (0.01) 6.2 (1.3) 27.7 (0.8) 1.03 (0.02) 176.3 (4.6) 167.9 (2.3) 0.95 (0.03)
0.6 19.8 (2.2) 28.2 (2.1) 1.01 (0.01)
1.2 172.4 (2.6) 158.2 (5.4) 1.07 (0.02) 20.1 (1.4) 27.3 (3.0) 1.11 (0.04)
aS.D. (n=3)
main plots while presence or absence of barnyard-grass hedges were the sub-plots and the presence or absence of winter wheat were the sub-subplots. The experiment was conducted at the Oregon State University Vegetable Research Farm, De-partment of Horticulture, in Corvallis, Oregon during the 1989 – 1990 growing season. The exper-imental site contained soil from the Chehalis se-ries, a silty clay loam with 7% organic matter and a pH of 6. In late September, 1 year before the experiment began, high- and low-density Italian ryegrass seed banks were established in the fol-lowing manner: three 4 m2 plots were planted
with Italian ryegrass seed only (pure stand), and three other plots were planted with a mixture of Italian ryegrass and winter wheat. Since wheat competition reduced Italian ryegrass seed produc-tion in the mixed plots, the resulting Italian rye-grass seed banks were different in the mixed and pure plots. Measurements taken during the fol-lowing summer revealed that the seed bank in pure stands averaged 170 000 Italian ryegrass seeds m−2
while in the mixed plots, weed density averaged 39 000 ryegrass seeds m−2
.
On 22 August, soil in all the experimental plots was rototilled and half of each plot was trans-planted with barnyardgrass in rows 0.5 m apart and oriented in an East – West (E – W) direction (Fig. 1). Within each row, plants were spaced at 0.1 m apart, and generated a hedge approximately 0.5 m high at the time of transplanting. Soil in the
other half of each plot was also disturbed with a transplant shovel but did not receive barnyard-grass transplants. On 7 October, the bare soil between the barnyardgrass hedges, and all the soil in the unplanted half of each plot, was again disturbed with a shovel and fertilized with 15 – 15 – 15% NPK (103 kg ha−1) and irrigated. The
next day, the plots were subdivided in North – South (N – S) direction and wheat was sown in one half of each plot in rows 0.125 m apart. Thus, each main plot contained two sub-plots (barn-yardgrass hedges or bare soil) and two sub-sub-plots (with and without wheat) (Fig. 1). Sowing was accomplished by opening small furrows with a rake, distributing the seed (350 seeds m−2), and
raking the furrows closed.
2.2. Experiment2
A split – split plot experimental design with three replicates was used to study the effects of orientation and spacing of live (green) and dead (brown) maize hedges on interference between wheat and Italian ryegrass. In this case, the main plots were hedgerow orientation (N – S or E – W), while subplots were live or dead hedges, which created different light environments (Ballare´ et al.,
1987). Sub-subplots were hedge spacing (1.2, 2.4, 3.6, 4.8, and 6.0 m) (Fig. 2).
The experiments were conducted at the Oregon State University Hyslop Field Laboratory near Corvallis, Oregon, during two growing seasons: 1989/1990 and 1990/1991. Soil was an Amity silt loam with a pH of 5.2 and containing 2.6% organic matter. A 2-ha site heavily infested with Italian ryegrass was plowed at the end of March both years and again on 25 June. It was then
Table 4
Correlations of environmental and yield variables with the first three axis from principal component analysisa
Variable Axis 1 Axis 2 Axis 3 (eig=0.09) (eig=0.23)
(eig=0.64)
−0.312
WTVEG −0.855 0.413
−0.136
WTREP −0.926 −0.341
−0.304
−0.839 −0.166
WTSPK
RYEVEG 0.568 −0.815 −0.085
−0.644
0.482 0.064
RYEREP
−0.683
RYESPK 0.657 −0.143
−0.490
aEigenvalues (eig) given for each axis represent the variance in the matrix attributed to that axis. WTVEG: wheat vegeta-tive weight; WTREP: wheat reproducvegeta-tive weight; WTSPK: number of wheat spikes; RYEVEG: ryegrass vegetative weight; RYEREP: ryegrass reproductive weight; RYESPK: number of ryegrass spikes; ORIENT: orientation of hedges (N–S or E–W); COLOR: color of hedges after spraying (green or brown); DISTAN: distance between two hedges.
sprayed with 0.5 kg a.i. paraquat (1-1% -dimethyl-4, 4%-bipyridinium ion) (Fig. 2), to kill the treated maize plants and create different light environments (sub-plots).
The spacing (sub-subplots) of 1.2, 2.4, 3.6, 4.8 or 6.0 m between the maize hedges were created with a 1.2-m wide rototiller. Four tilling opera-tions (carried the first week of September) were necessary to destroy the maize plants between the hedges and prepare the soil for later wheat planting. On 28 September and 1 October, re-spectively, wheat was sown with an eight-row planter at a rate of 350 seeds m−2
.
To characterize differences in light quality at ground level in the different hedge spacing and orientations existing before sowing wheat, R:FR determinations were taken at increasing dis-tances from sprayed and unsprayed maize hedges every 0.6 m. Measurements were done at midday on a sunny day, with a Skye Radiome-ter model SKR 100, and a sensor model SKR 110. Reductions in light intensity caused by live and dead fences were quantified by comparing quantum flux at 660 and 730 nm when the sen-sor was facing the sky and when it faced the hedge. For this purpose, we measured light in-tensity on the South side of the fences oriented E – W at 0, 0.6 and 1.2 m from the fence. Maize plants were around 1.50 m high and were start-ing to tassel.
Between 22 June and 10 July, aerial biomass was sampled in all sub-subplots. To do the sam-plings, 1.0 m by 1.0 m quadrats were located along a line transect in both the sprayed and unsprayed halves of each main plot. Transects ran perpendicular to the maize hedges and had their origins positioned randomly within each plot half (Fig. 2B). Within each spacing between the maize hedges, the first quadrat was located 0.1 m from the preceding maize hedge, the next quadrat, if row spacing allowed more than one was located 0.2 m from the preceding quadrat. In this way, samples from one, two, three, four, or five quadrats, depending on whether the quadrats were from the 1.2, 2.4, 3.6, 4.8 or 6.0 hedge spacing, were obtained for each treat-ment. Vegetative and reproductive dry biomass was recorded by species (ryegrass and wheat). tilled with a disc harrow and fertilized with 16 –
20 – 0% NPK (2.5×10³ kg ha−1).
On 19 and 21 July, respectively each year, the site was tilled again and planted with maize (70 kg seed ha−1), in rows 0.6 m apart. The rows
were oriented N – S in half of each block and E – W in the other half (Fig. 2A) to create the two main plots.
To create a homogeneous Italian ryegrass stand in the plots, 17 kg Italian ryegrass seed ha−1 was broadcast in the established maize
during the last week of August. The experiment was irrigated as needed. On 26 September, half of the maize hedges in each main plot were
Table 5
Climatic conditions during wheat and ryegrass seedling growth
Mean daily
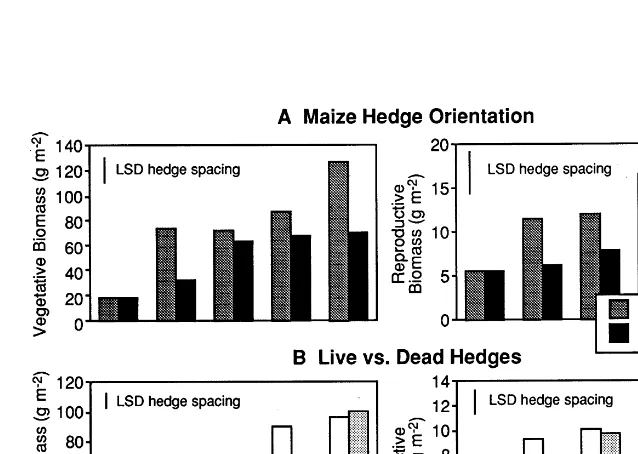
Fig. 4. Effect of maize hedge spacing on vegetative and reproductive wheat biomass for maize hedges oriented E – W and N – S (A) and live and dead maize hedges (B).
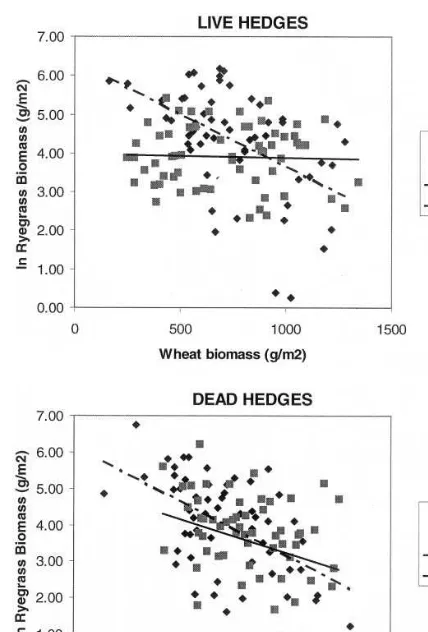
Fig. 6. Ryegrass biomass as a function of wheat biomass in 1 m2 plots with green (alive) or brown (dead) maize hedges oriented E – W or N – S. Regression models are: green hedges, E – W: y= −0.0027x+6.379 R2=0.26; N – S: y= − 0.0001x+3.9895 R2=0.00; brown hedges, E – W: y= − 0.003x+6.157 R2=0.30; N – S y= −0.0018x+5.0874 R2=0.09.
5% level of significance. Linear regressions were calculated for the logarithm of the biomass of each species against the biomass of the other one, and number of spikes or reproductive biomass versus vegetative biomass for each species.
In order to account for the competitive effect of the maize row, we compared regression curves obtained with the whole data set versus those obtained only with subsamples taken at least 1.2 away from the maize row, in the hedge spacings of 3.6, 4.8 and 6.0 m.
Fig. 7. Wheat biomass as a function of ryegrass biomass in 1 m2 plots with green (alive) or brown (dead) maize hedges oriented E – W or N – S. Regression models are: green hedges, E – W: y= −0.0014x+6.7421 R2=0.21; N – S: y= − 0.0002x+6.4663 R2=0.00; brown hedges, E – W: y= − 0.0013x+6.6566 R2=0.23; N – S y= −0.001x+6.7586 R2=0.11.
2.3. Data analysis
Differences in cover and biomass among treat-ments of the first experiment were analyzed using analysis of variance (PB0.05). We used Principal
Fig. 8. The relationship between reproductive and vegetative biomass in wheat plants growing in 1 m2 plots with green (alive) or brown (dead) maize hedges oriented E – W or N – S. Regression models are: green hedges, E – W: y=0.5918+
65.705 R2=0.82; N – S: y=0.6723x+91.858 R2=0.67; brown hedges, E – W: y=0.5398x+146.88 R2=0.42; N – S y=0.5996x+67.746R2=0.69.
tively, in high and low-density plots (Table 1) by the presence of barnyardgrass hedges.
Response to the barnyardgrass hedges was also evident in aboveground biomass production at the end of the crop cycle. Overall the hedge signifi-cantly improved wheat vegetative and reproduc-tive biomass, in both the high and low Italian ryegrass seed bank density treatments (Table 2). In all the treatments (high and low Italian rye-grass seed bank density, pure and mixed stands) barnyardgrass hedges reduced Italian ryegrass vegetative yield compared to the non-hedge areas, but the hedges did not significantly affect repro-ductive yield of Italian ryegrass (Table 2).
Fig. 9. The relationship between reproductive and vegetative biomass in ryegrass plants growing in 1 m2 plots with green (alive) or brown (dead) maize hedges oriented E – W or N – S. Regression models are: green hedges, E – W: y=0.3433x+
1.962R2=0.58; N – S:y=0.1008x+1.1774R2=0.76; brown hedges, E – W: y=0.2618x+6.8231 R2=0.59; N – S y= 0.1351x+1.6479R2=0.87.
3. Results and discussion
3.1. Experiment1
respec-Ghersa et al. (1994) documented the effect of reductions in radiation, R:FR light ratio and the reduction in thermal amplitude on germination of Italian ryegrass seeds relative to wheat seed germi-nation, and on crop yield. In their experiment, wheat yield was improved because of a lower ryegrass-wheat seedling density. Reductions in light intensity and in the R/FR ratio may also increase shoot-root ratio (Ballare´, 1993). Consid-ering that ryegrass is more responsive than wheat to light environmental changes during early stages of development (Hashem et al., 1998), barnyard-grass interference may have played a major role in the observed lower cover of ryegrass in the pres-ence of the hedge. On the other hand, it is well established that plant response to interference re-sults from complex interactions. Ryegrass has been reported to have higher below ground com-petitiveness relative to wheat (Stone et al., 1998). It is possible that barnyardgrass reduced the com-petitiveness of ryegrass in our experiment, or changed microclimatic factors during ryegrass es-tablishment and tillering.
In our experiment, ryegrass biomass was gener-ally not as drasticgener-ally reduced as cover by grow-ing hedges (Table 2). Two factors are responsible for the reduction in tillering rate, largely deter-mining cover in grass species: a decrease in light interception per plant and lower R/FR ratios at their base (Deregibus et al., 1983). However, it has been demonstrated that during ryegrass growth tillering might be reduced by a phy-tochrome response triggered by low R/FR before a serious scarcity in energy availability is pro-duced by mutual shading (Casal et al., 1986). These authors observed that lower densities af-fected tillering without depressing dry matter accumulation.
3.2. Experiment 2
In the first experiment, separate effect of hedges shading, changes in the light quality and soil resource exploitation were not accounted for. Since it is known that hedge height, orientation and distance between them will affect the spatial pattern of resource availability and light quality, the second experiment was designed aiming to vary them differentially, in order to evaluate pos-sible interactions. Therefore, the following aspects were considered to lay the different treatments (1) soil resource exploitation is greater in the first 30 cm of the soil profile and in the first 50 cm from the row. It decreases exponentially with depth and distance away from the row (Plavychenko, 1937a,b; Davis et al., 1965; Ca´rcova et al., 1998); (2) a hedge oriented E – W, would shade the soil all day on the N side; and if it has green tissues it should also reduce the R:FR ratio near the soil surface, up to a distance depending on its height and the sun angle. On the S side of the hedge, no shading is expected but R:FR ratio is reduced by the light reflected by the leaves, when they have live tissue (Ballare´ et al., 1987); (3) a hedge ori-ented N – S should shade, and if it is alive, it will reduce the R: FR ratio in a similar way in both E and W sides, except for the fact that soil shading will vary along the day with the sun’s trajectory. As expected, the dead maize plants (brown hedges) shaded the soil without altering the R:FR
Table 6
The relationship between number of tillers and individual plant biomass in plots with maize hedges differing in color and orientation
Green N–S Tillers=0.2975 0.82
×biom−8.4575
0.81 E–W Tillers=0.3102
×biom−13.541 N–S Tillers=0.3236
Brown 0.71
×biom−40.258
E–W Tillers=0.2378 0.76
×biom+13.593
Ryegrass
N–S
Green Tillers=0.3625 0.73
×biom+8.5438
E–W Tillers=0.1892 0.74
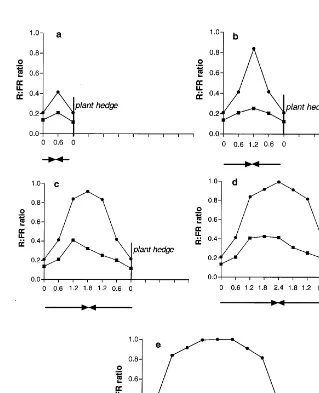
ratio which was around 1.0 at all the measured distances (Table 3). Live maize plants (green hedges) in the other half of each main plot both shaded the soil and reduced the R:FR ratio until the second and third week of October when the first killing frosts occurred. Visual observations revealed that at the crop seedling stage, the E – W hedges shaded up to 2.4 m towards N direction. Therefore the maize plants shaded the soil throughout the day in the 1.2 and 2.4 m spacing, but only to some extent, in the wider hedge spacings (3.6, 4.8 and 6.0 m). During the early morning and late afternoon, when the inclination of the sun was low, the soil was fully illuminated. Shading by maize plants increased as the sun rose until reaching its maximum at noon. Moreover, variable proportions in these plots near the S side of a hedge were never shaded, but radiation reflected from the live hedges still reduced the R:FR ratio. In the plots with live hedges, the R:FR ratio was highest at noon, but never ex-ceeded 0.4 (Fig. 3). Maize plants oriented N – S shaded the ground nearly all the day except for 2 h around noon. The R:FR ratio in the plots with N – S live hedge orientation varied with distance away from the hedge to a greater extent than in those plots with live E – W hedges. The maximum values observed at midday in the center of the plots with N – S hedge increased progressively with hedge spacing: from 0.4 in the narrowest to 1 in the widest. Therefore during the day the ratio changed from around 0.2 when the soil was shaded to the corresponding midday maximum. By the end of November the maize plants in all the hedges had lost a high proportion of their leaves, and by the end of December there were no standing maize plants.
The principal components analysis for 1990 and 1991 data provided results with regard to the most important agronomic manipulations (hedge color, orientation and spacing) affecting biomass production of wheat and ryegrass. The first two axis of the ordination diagram explained nearly 90% of the data variance (Table 4). Pearson and Kendal correlations with ordination axes indi-cated that wheat yield was little affected by envi-ronmental manipulations. We found a strong negative correlation of wheat vegetative and
re-productive yield with the first ordination axis, but this correlation is not associated to any of the environmental conditions generated with the hedges. On the other hand, part of the ryegrass vegetative and reproductive biomass variability (24%) is associated to the environmental condi-tions generated by the experiment, in particular, orientation of the maize hedges (Table 4).
Despite slight differences in weather conditions (Table 5), interactions between hedge treatments and harvest year were not statistically significant on wheat and ryegrass yield, and therefore, only average figures are presented. Spacing and orien-tation of maize hedges did not affect wheat yield (PB0.05), which averaged 2500 kg ha−1.
More-over, wheat yield was independent of sample dis-tance from maize hedge (Fig. 4). However, at the narrower hedge spacing, average vegetative and reproductive biomass for wheat was significantly greater in the dead-hedge treatments than in the live-hedge treatments (Fig. 4). In the treatments with live hedges, competition for both, above and belowground resources may have occurred as a consequence of the 2-week longer growth of the maize plants in the non-sprayed hedges than the sprayed.
Significant interactions were detected between treatments and hedge spacing on ryegrass biomass. Spacing of maize hedges affected Italian ryegrass biomass production (Fig. 5). Live hedges increased ryegrass vegetative biomass by about 25%, compared with dead hedges. This increase was particularly large at 1.2 and 2.4 m hedge spacing (Fig. 5). The low R:FR ratio experienced by ryegrass leaves growing in plots with live hedges may have affected canopy structure im-proving ryegrass light interception (Ballare´, 1993; Morgan and Smith, 1981). Differences between live and dead hedges were largely insignificant in terms of Italian ryegrass reproductive biomass production (Fig. 5).
plots with live (green) maize hedges oriented N – S, total biomass production of wheat was not modified by the presence of ryegrass, and vice-versa. In the rest of the plots, total biomass of each species decreased as the biomass production of the other species increased. The slope of the linear model provides an estimate of the competi-tive effect of one species on the other (Radosevich et al., 1997). In these plots, biomass decrease of ryegrass almost doubled that of wheat (Figs. 6 and 7). These findings are in accordance with the results of Hashem et al. (1998) who showed that wheat was less affected than ryegrass as a result of competition in a wide range of plant spatial arrangements.
No significant differences among treatments were observed in the proportion of biomass allo-cated to reproduction by wheat (Fig. 8). The relation between reproductive and vegetative pro-duction has agronomic significance because it gives an indication of how much of the crop biomass was allocated to the grain, which is har-vested, and how much of the weed biomass went to seed production, which feeds the soil weed seed bank (Weiner, 1988). In all the environmental conditions, spikes dry weight was around 60% of wheat vegetative biomass. Instead, allocation to reproduction was greatly modified in ryegrass by the orientation of the maize hedges (Fig. 9). In the plots with hedges oriented E – W a higher propor-tion of the biomass allocated by the ryegrass to reproduction was observed than in plots with hedges oriented N – S, irrespectively of the hedge color. Annual plants draw the carbohydrate com-pounds for their reproductive requirements mainly from their current dry matter production (Chapin et al., 1990). Because vegetative growth is already coming to an end when seed development begins, the quantity and quality of the seeds are influenced by the environmental factors prevailing before, as well as during, reproductive phase (Larcher, 1995). It is possible that in the plots with hedges oriented N – S, longer periods of shading, poor supply of nutrients to ryegrass plants, or both, might have given priority to vegetative development.
Live or dead biomass and orientation of plant hedges were important factors regulating tiller
number per unit of total biomass production of Italian ryegrass (Table 6). In the plots with live E – W hedges where the maximum level of the R:FR ratio never exceeded 0.4 (Fig. 3) ryegrass produced half of the tillers per unit of biomass than those produced in plots with N – S hedges (R:FR maximum ratio=1). In the plots with brown hedges (R:FR ratio=1) the tiller produc-tion per unit of biomass was the same for both orientations and similar to the one for the N – S live hedges. As with the other measured variables, wheat tiller production per unit of biomass was insensitive to hedge treatments. The effect of low R:FR ratio on the reduction of tillering has been shown for ryegrass and other grass species (Casal et al., 1985). This process is so sensitive to R:FR that Paspalum dilatatum grown in pots placed at low densities (B7 plants m2) do not shade each
4. Conclusions
Our results show that changes in the light mi-croenvironment during seedling establishment, generated by the use of plant hedges, can improve wheat ability to compete with ryegrass. Hedges improved vegetative and reproductive wheat biomass and reduced ryegrass yield. Wheat yield was little affected by different spacing and orien-tation of hedges. On the contrary, Italian ryegrass biomass production and allocation was highly modified by hedge treatments.
While our study did not isolate the resources involved in plant competition, data suggest that there is room for developing weed control tech-nologies on the basis of an understanding of photosensory processes in crop canopies. Before such non-chemical weed management tactics can be widely applied, experiments analogous to dose screening in chemical weed control research must be initiated. For example, in our experiments, ‘dose’ should be interpreted as the integration of duration, spacing, and orientation of hedges. The tactic also assumes that crop breeding will con-tinue to maintain differential responses to envi-ronment between weeds and crops. Models that are developed specifically to study phenotypic and phenological responses of crops and weeds species interacting with different environments including changes in light quality would aid in that work.
References
Aldrich, R.J., 1984. A new mind set toward weeds. In: Aldrich, J.R. (Ed.), Weed Crop Ecology. Principles in Weed Management. Brenton Publishers, North Scituate, MA, pp. 3 – 5.
Altieri, M.A., 1988. The impact, uses and ecological role of weeds in agroecosystems. In: Altieri, M.A., Liebman, M. (Eds.), Weed Management in Agroecosystems: Ecological Approaches. CRC Press, Boca Raton, FL, pp. 1 – 6. Altieri, M.A., Liebman, M., 1988. Weed management:
ecolog-ical guidelines. In: Altieri, M.A., Liebman, M. (Eds.), Weed Management in Agroecosystems: Ecological Ap-proaches. CRC Press, Boca Raton, FL, pp. 331 – 338. Ballare´, C.L., 1993. Light gaps: sensing the light opportunities
in highly dynamic canopy environments. In: Caldwell, M.M., Pearcy, R.W. (Eds.), Exploitation of Environmental Heterogeneity by Plants. Ecophysiological Processes Above and Below Ground. Academic Press, Orlando, FL.
Ballare, C.L., Casal, J.J., 2000. Light signals for crop and weed plants. Field Crops. Res. 67, 149 – 160.
Ballare´, C.L., Sanchez, R.A., Scopel, A.L., Casal, J.J., Ghersa, C.M., 1987. Early detection of neighbor plants by phy-tochrome perception of spectral changes in reflected sun-light. Plant Cell Environ. 10, 551 – 557.
Ballare´, C.L., Scopel, A.L., Sanchez, R.A., Radosevich, S.R., 1992. Photomorphogenic processes in the agricultural envi-ronment. Photochem. Photobiol. 56, 777 – 788.
Beaumer, K., de Wit, C.T., 1968. Competitive interference of species in monocultures and mixed stands. Neth. J. Agric. Sci. 16, 103 – 122.
Benech Arnold, R.L., Ghersa, C.M., Sanchez, R.A., Insausti, P., 1990. A mathematical model to predict Sorghum halepense(L.) Pers. Seedling emergence in relation to soil temperature. Weed Res. 30, 91 – 99.
Ca´rcova, J., Maddonni, G.A., Ghersa, C.M., 1998. Crop water stress index of three maize hybrids grown in soils with different quality. Field Crops Res. 55, 165 – 174. Casal, J.J., Deregibus, V.A., Sanchez, R.A., 1985. Variations
in tiller dynamics and morphology in Lolim multiflorum
Lam vegetative and reproductive plants as affected by differences in red/far red irradiation. Ann. Bot. 56, 553 – 559.
Casal, J.J., Sanchez, R.A., Deregibus, V.A., 1986. Effects of plant density on tillering: the involvement of the R/FR and the proportion of radiation intercepted per plant. Exp. Environ. Bot. 26, 365 – 371.
Chapin, F.S., Schulze, E.D., Mooney, H.A., 1990. The ecology and economics of storage in plants. Annu. Rev. Ecol. Syst. 21, 423 – 447.
Davis, R.G., Wiese, A.F., Pafford, J.L., 1965. Root moisture extraction profiles of various weeds. Weeds 13, 98 – 100. Deregibus, V.A., Sanchez, R.A., Casal, J.J., 1983. Effects of
light quality on tiller production inLolium multiflorumspp. Plant Physiol. 72, 900 – 902.
Digby, P.G.N., Kempton, R.A., 1991. Ordination classifica-tion. In: Usher, M.B. (Ed.), Multivariate Analysis of Eco-logical Communities. Chapman & Hall, London, pp. 124 – 125.
Dunnett, N.P., Grime, J.P., 2000. Competition as an amplifier of short-term vegetation responses to climate: an experi-mental test. Funct. Ecol., in press.
Ghersa, C.M., Martinez-Ghersa, M.A., Casal, J.J., Kaufman, M., Roush, M.L., Deregibus, V.A., 1994. Effect of light on winter wheat (Triticum aesti6um) and Italian Ryegrass (Lolium multiflorum) competition. Weed Technol. 8, 37 – 45.
Gressel, J., 1991. Why get resistance? It can be prevented or delayed. In: Caseley, J.C., Cussans, G.W., Atkin, R.K. (Eds.), Herbicide Resistance in Weeds and Crops. Butter-worth Heinemann, London, pp. 1 – 26.
Hashem, A., Radosevich, S.R., Roush, M.L., 1998. Effect of proximity factors on competition between winter wheat (Triticum aesti6um) and Italian ryegrass (Lolium multiflo
Holt, J.S., 1995. Plant responses to light: a potential tool for weed management. Weed Sci. 43, 474 – 482.
Larcher, W., 1995. Physiological Plant Ecology. Ecophysiol-ogy and Stress PhysiolEcophysiol-ogy of Functional Groups, third ed. Springer, Berlin.
Morgan, D.C., Smith, H., 1981. Non-photosynthetic responses to light quality. In: Nobel, P. (Ed.), Encyclopedia of plant Physiology. New Series 12A. Springer, Berlin, pp. 109 – 134.
Navas, M.L., 1991. Using plant population biology in weed research: a strategy to improve weed management. Weed Res. 31, 171 – 179.
Patterson, D.T., 1985. Comparative ecophysiology of weeds and crops. In: Duke, S.O. (Ed.), Weed Physiology. Repro-duction and Ecophysiology. CRC Press, Boca Raton, FL, pp. 101 – 130.
Plavychenko, T.K., 1937a. Quantitative study of the entire root system of weeds and crop plants undel field condi-tions. Ecology 18, 62 – 79.
Plavychenko, T.K., 1937b. The soil washing method in quanti-tative root study. Can. J. Res. 15, 33 – 57.
Radosevich, S.R., Holt, J.S., Ghersa, C.M., 1997. Weed Ecol-ogy. Implications for Vegetation Management. Wiley, New York.
Shainsky, L.J., Radosevich, S.R., 1992. Mechanisms of com-petition between Douglas-fir and Red alder seedlings. Ecol-ogy 63, 30 – 45.
Smith, H., 1992. The ecological functions of the phytochrome family. Clues to a transgenic programme of crop improve-ment. Photochem. Photobiol. 56, 815 – 822.
Stone, M.J., Cralle, H.T., Chandler, J.M., Miller, T.D., Bovey, R.W., Carson, K.H., 1998. Above-and belowground inter-ference of wheat (Triticum aesti6um) by Italian ryegrass (Lolium multiflorum). Weed Sci. 46, 438 – 441.
Tivy, J., 1990. Agriculture and the environment. In: Tivy, J. (Ed.), Agricultural Ecology. Longman Scientific and Tech-nical, New York, pp. 243 – 260.
Weiner, J., 1988. The influence of competition in plant repro-duction. In: Lovett Doust, J., Lovett Doust, L. (Eds.), Plant Reproductive Ecology, Patterns and Strategies. Ox-ford University Press, OxOx-ford, pp. 228 – 246.