254 (2000) 169–188
www.elsevier.nl / locate / jembe
Somatic growth and otolith growth in juveniles of a small
subtropical flatfish, the fringed flounder, Etropus crossotus
a ,* a,b,c a,b,c
Marcel J.M. Reichert , John M. Dean , Robert J. Feller ,
d
John M. Grego
a
Belle W. Baruch Institute for Marine Biology and Coastal Research, University of South Carolina, Columbia, SC 29208, USA
b
Marine Science Program, University of South Carolina, Columbia, SC 29208, USA
c
Department of Biological Sciences, University of South Carolina, Columbia, SC 29208, USA
d
Department of Statistics, University of South Carolina, Columbia, SC 29208, USA
Received 16 August 1999; received in revised form 21 July 2000; accepted 31 July 2000
Abstract
A growth experiment was conducted with juvenile fringed flounder (Etropus crossotus) from North Inlet (South Carolina, USA) to provide information on the growth of a small, shortlived flatfish with a subtropical and tropical distribution. The fringed flounder has a maximum life span of 1.5 y and its long spawning period from March through October complicates the determination of growth rates based on length frequency data. Otoliths of juveniles with a standard length (SL) 23.1–53.0 mm were marked with Alizarin complexone and the fish were held in the laboratory for 66 days at 14, 20, 24 and 298C while being fed ad libitum. The mean somatic growth increased
21 21
with temperature from 0.1 mm SL day at 148C to 0.4 mm SL day at both 24 and 298C. The
1
maximum observed somatic growth rate was 0.7 mm SL day at 298C. The number of micro-increments formed in otoliths was not significantly different from the expected value, validating formation of one increment per day. The significant relationship between increment width and somatic growth rate can be used to estimate somatic growth rates of individual wild fish based on daily increment information in their otoliths. 2000 Elsevier Science B.V. All rights reserved.
Keywords: Flatfish; Growth; Otoliths; Temperature
*Corresponding author. Tel.:11-803-777-3135; fax:11-803-777-3935. E-mail address: [email protected] (M.J.M. Reichert).
1. Introduction
There has been considerable discussion of the role of food in determining maximum growth rates and survival of juvenile flatfishes in nursery areas (Miller et al., 1991; Van der Veer and Witte, 1993; Gibson, 1994). It is generally accepted that among the many factors governing growth of fish, the most important are the quality and quantity of food as the driving force, temperature as a rate controlling factor, and the size of fish as an allometric scaling factor (Brett and Groves, 1979). Abundant food, favorable tempera-tures, and shelter from predation are key factors in allowing juvenile fish to grow quickly to a less vulnerable or adult size in nursery areas (e.g., Gibson, 1994). The majority of the available information on flatfishes is based on studies of relatively longlived, large, temperate species. Information on growth of shortlived, small subtropi-cal and tropisubtropi-cal flatfish species is limited and almost exclusively based on field-collected material (e.g., Topp and Hoff, 1972; Reichert and van der Veer, 1991; Van der Veer et al., 1994; Joyeux et al., 1995). Experimental data on growth under well-defined conditions is lacking.
Many subtropical and tropical (flat)fish species have an extended spawning period (Topp and Hoff, 1972; McEvoy and McEvoy, 1992; Reichert, 1998). When reproduction is spread out over several months, the increase in mean size of the population over time cannot be used to estimate growth rates. Since the discovery of daily structures in otoliths, the microstructure of otoliths has provided a tool to study both growth rates and life history characters in fish (e.g., Pannella, 1971; Stevenson and Campana, 1992; Secor et al., 1995). Various studies have shown that resorption of otolith material does not take place, even under periods of low or even negative growth (Simkiss, 1974; Campana, 1983; Neilson and Geen, 1985; Jones, 1992, p. 2). The resulting permanent records of daily increments in otoliths allow detailed determinations of the age of individual fish, permitting estimates of recruitment, mortality rates, and related parameters in fish populations. Despite wide acceptance of the use of increments in age and growth studies in fish, and the fact that ‘‘the deposition of daily increments appears to be a universal phenomenon under perhaps all but the most severe conditions’’ (Jones, 1992), an appropriate validation is still essential for a correct interpretation of the otolith microstructure (Geffen, 1992).
Wright et al. (1990) for Atlantic salmon parr. Others have argued that such uncoupling is not always present, for instance Dickey et al. (1997) found no evidence for uncoupling in larval striped bass. Regardless of the presence of an uncoupling, and assuming the rate of growth is neither extremely high nor low, increment width can be used to provide estimates of (recent) growth of individual field-collected fish once the relationship between otolith growth (increment width) and somatic growth is established.
This paper will address aspects of growth in the fringed flounder (Etropus crossotus Jordan and Gilbert, 1882), a small flatfish with a subtropical and tropical distribution. Along the Atlantic coasts it has been described from Chesapeake Bay (Virginia, USA), to the northern coasts of South America, but it is most abundant in the South Atlantic Bight and the Gulf of Mexico, and very common in estuaries and shallow waters of South Carolina, USA (Topp and Hoff, 1972; Martin and Drewry, 1978; Ogburn et al., 1988; Reichert and van der Veer, 1991; Allen and Baltz, 1997; Reichert, 1998). The maximum reported total length of the fringed flounder is 16.9 cm, but individual fish are rarely longer than 15 cm, and their wet weight is seldom more than 40 g (Moe and Martin, 1965; Topp and Hoff, 1972; Reichert and van der Veer, 1991; Reichert, 1998). Reichert (1998) described aspects of the age, growth, and reproduction of the species, showing that its maximum expected life span is about 14.5 months. The fringed flounder can be found year round on mud and muddy sand in shallow coastal waters and estuaries at temperatures ranging from 11 to 318C and salinities from less than 5 to over 35 ppt (Topp and Hoff, 1972; Martin and Drewry, 1978; Reid, 1954; Ogburn et al., 1988; Reichert and van der Veer, 1991). The relatively small mouth of the fringed flounder limits the size of their prey, predominantly small benthic and epibenthic crustaceans and polychaetes (Reid, 1954; Topp and Hoff, 1972; Stickney et al., 1974; Reichert and van der Veer, 1991). Spawning in South Carolina takes place from March through October, and the smallest size at which females can potentially reproduce is 7–7.5 cm SL with a length at 50% maturity between 8.0 and 8.5 cm SL (Reichert, 1998). Reichert and van
21 der Veer (1991) and Reichert (1998) estimated a growth rate of about 0.5 mm day at 24 to 288C for juveniles, but detailed information for growth under controlled, good quality conditions was not available. Using experimentally derived data, we investigated (1) the relationship between temperature and growth under defined conditions with no food limitation, (2) the validation of daily increment formation in the otoliths, and (3) the relationship between otolith growth and somatic growth. The data can be used to estimate natural rates of growth of individual fish collected in the field, and to model growth of fringed flounder populations.
2. Materials and methods
2.1. Sample collection
mm) and wet weight (WW, 60.001 g) of a subsample of the collected juvenile E.
crossotus were determined shortly after sampling. On the day of collection, live fish
were transported to a walk-in experimental chamber with climate control in Columbia (SC). Here the fish were acclimated for 6 weeks in two 150 l seawater tanks (238C and
S529–30 ppt) while being fed ad libitum with a mixture of live black worms (Lumbriculus variegatus), finely chopped grass shrimp (Palaemonetes pugio), and live adult and juvenile brine shrimp (Artemia) grown on a Chlorella sp. suspension.
2.2. Experimental setup, otolith marking procedure, and otolith preparation
The growth experiment was conducted at 14, 20, 24 and 298C (each 60.58C) in a climate controlled experimental chamber. These temperatures were chosen to create a range of growth rates under ad libitum food conditions. Temperatures were randomly assigned to eight tanks, two at each temperature. The tanks (L3W3H550326.53 31 cm) were equipped with an aquarium heater, a thermometer, a foam filter and air supply, and filled with 33 1 of seawater (29–31 ppt). The bottom of each tank was covered with a 2 cm layer of cleaned fine sand from the same location the fish were collected. The top of every tank was covered with clear Plexiglas and the four sides were covered with brown Styrofoam to provide insulation, prevent visual interaction between tanks, and minimize disturbances. A ninth tank at 148C (60.58C) with identical setup was used as a control to investigate the effect of handling and marking. Prior to the beginning of the experiment, seawater was recirculated between all experimental tanks and a 150 1 storage aquarium equipped with a trickle wet / dry filter to establish uniform water quality in all tanks.
Six weeks after collection, 55 fish with a standard length between 23.2 and 53.0 mm (mean 42.6 mm) were marked by submerging them for 18 h in a solution of 75 ppm Alizarin complexone in seawater (238C, 30 ppt). The marking procedure was tested by marking 10 fish 1 day after collection and again by marking 10 fish 8 days after collection, or 109 and 100 days before the end of the experiment respectively. There was no mortality during the marking procedure or in the few days that followed. Immediately after marking, the fish were measured with electronic calipers (SL and TL), weighed (WW), and uniquely externally marked by fin clipping for identification. Five fish were placed in each of the experimental tanks. The remaining marked and unmarked fish were placed in the storage aquarium at 238C to replace fish that died during the experiment. Over a period of several days the temperature levels were gradually adjusted to create the appropriate experimental temperatures in each tank. Temperature in all tanks was stable at the nominal value within 10 days. Starting on the 18th day after marking, the SL, TL, and WW of each fish were determined five times at 12 day intervals, resulting in four 12 day growth periods. The fish in the control tank were measured only at the beginning and at the end of the experiment. Three of these five fish were not marked with Alizarin.
keep the level under 0.1 ppm. Seawater for these changes came from the 150 l storage aquarium and was brought to the appropriate temperature before each change. The light / dark period during both the acclimation period and the growth experiment was L:D515:9, similar to the summer situation, and was switched on and off in two phases to reduce light shock and to mimic sunrise and sunset. The fish were fed at least twice daily during the light period with pre-weighed portions of the food mixture described above. The feeding pattern was irregular in frequency and time of day, and was predominantly based on the amount of left-over food and the willingness of the fish to accept food. Observations showed that individuals frequently swam through the aquarium chasing adult brine shrimp, and that feeding activity slowed down during the dawn and dusk period. No observations were made during the night. Unconsumed food was removed by pipette and weighed before each successive feeding. Fish that died during the first three growth periods were replaced by individuals of about the same length to keep the fish densities in the experiment constant. Mortality during the growth experiment varied (Table 1). Within hours after beginning the experiment, two fish died in tank five (248C), both fish were immediately replaced with one unmarked fish and one fish that was marked 100 days before termination of the experiment. Both were treated as ‘original fish’. All fish died in tank seven (298C) during the first growth period and were replaced at the beginning of the third growth period with five new fish, two were unmarked, two were marked at 100 days, and one was marked 109 days before termination of the experiment. In tank three (208C) all original fish, as well as their replacements, died in the third growth period for unknown reasons and were not replaced.
At the end of the experiment, both sagittal otoliths of each fish were removed, cleaned, stored dry and coded. Odd numbers represented the otoliths from the right (blind) side, even numbers those from the left side of the fish. The left sagitae were prepared for microstucture analysis following standard techniques (see Secor et al., 1991; Stevenson and Campana, 1992; Reichert, 1998). The embedded otoliths were
Table 1
sectioned and polished along the transverse plane to a thickness of a fewmm with the primordium visible. If the polishing inadvertently resulted in the destruction of the otolith, the other sagitta was prepared. The preparations were examined under a compound microscope with a 1003 dry objective lens. Polarized light and a blue filter were used to enhance the visibility of increments. Although the theoretical resolution of the microscope setup was 0.3mm, a test indicated that the actual resolution was 0.5mm. The Alizarin mark was detected using UV light at 540–585 nm for excitation and a 610–680 nm emission filter.
2.3. Somatic growth and temperature
The growth response of juvenile fringed flounder at the experimental temperatures was investigated using the somatic growth data from ‘original’ fish and those added to tank seven at the beginning of the third growth period. Somatic growth was calculated as the net daily increase in SL of the fish over any of the 12 day growth periods. Uneven mortality in the tanks resulted in an unbalanced statistical design. We analyzed the data using a mixed model nested ANOVA with repeated measures. The fixed effects were temperature (T ), growth period, and the temperature by growth period interaction. Tank was treated as a random effect nested in temperature. Fish were treated as a repeated measures factor with responses recorded for each period in which the fish was alive. Compound symmetry, AR(l) and unstructured correlation structures were considered for the repeated measures; Akaike Information Criterion (AIC) was used to select an unstructured correlation structure as the most appropriate (SAS Institute, 1999). Before analysis we removed two data points (tank three, 208C, period 2) from the data set. These were from two original fish that survived the second growth period, but had very low or negative growth rates and died early in the third growth period. All post hoc power analyses were done for a 50.05.
The gross growth efficiency (E ) was calculated as E5G /I (Brody, 1945), with G as
the somatic growth in total fish WW increase per tank, and I the food intake in net WW of food eaten per tank, using only those periods in which all fish survived.
2.4. Daily increment validation and the relationship between otolith growth and
somatic growth
were made by the senior author. A t-test was used to compare the mean count in each otolith with the expected value based on the number of days the fish lived after being marked.
The relationship between otolith growth and somatic growth was investigated in fish that survived the complete experiment from marking through termination. In this part of the analysis we were interested in the relationship between somatic growth and otolith growth only, irrespective of how the somatic growth was achieved. We estimated the
2
otolith growth by measuring the surface area (SA in mm ) and width (W inmm) outside the mark with the aid of image analysis software. SA was measured once in each otolith.
W is the mean of six linear measurements, three on each side of the sulcal grove in the
designated area, from the Alizarin mark to the edge of the otolith and perpendicular to the increments. The mean daily increment width (IW inmm) was estimated by dividing
W by 66 (four 12 day growth periods plus the 18 day post-mark period). In five fish, W
was determined in both the left and the right sagittal otolith to examine variability in width measurements within fish.
We also investigated a method that can be used in unmarked, field-collected fish by measuring the width of the 24 most recently deposited increments in 22 fish that survived the last two growth periods. Three measurements were made on each side of the sulcal groove, perpendicular to the increments and the IW was compared with the SG of the fish in the last two growth periods.
3. Results
3.1. Somatic growth and temperature
Based on all measurements of all fish, the standard length (SL) was 81.7% of the total 2
length (TL) (n5176, adj.r 599.9%) and the overall SL / wet weight relationship was
26 3.363 2
WW5(4.52310 )3SL (n5176, adj.r 597.8%). The mean condition factor
23
(CF5WW?SL ) at the beginning of the first growth period was 0.0174 (n546, s.e.50.0032) and increased during the successive growth periods at all temperatures except 148C (Fig. 1). At the end of the growth experiment, only the mean CF of fish growing between 24 and 148C were significantly different (Bonferroni (95%) corrected multiple range test).
23
Fig. 1. Change in mean condition factor (CF5W?SL ) during the growth experiment with juvenile E. crossotus. The numbers 0, 12, 24, 36 and 48 refer to the days the fish were measured and weighed, with 0 indicating the start of the first of four 12 day growth periods. The error bars are61 standard error. Data for the two tanks at each temperature were pooled. The dotted horizontal line indicates the CF of field-collected fish of the same size range (data from Reichert, 1998).
The repeated measures analysis of growth data from the eight tanks revealed that the main effect of temperature (T ) was moderately significant (P50.0376, Table 3) and depended greatly on period (P,0.0001). The variability of tank nested within
2
temperature was moderate (s 5T 0.0050) compared to the within-tank variation (be-tween 0.0102 and 0.0046). Examination of the data indicated that somatic growth of the fish in tank four (208C) in period four, tanks five and six (248C) in period two, and tank eight (298C) in period one was lower than the SG in all other tanks and periods at the
Table 2
Daily somatic growth used to investigate the effect of handling and marking of juvenile E. crossotus. n is the number of fish used in the analysis. A Bonferroni multiple comparison test yielded no significant differences
21
between tanks (F0.05[2,12]52.88, P50.095 and post hoc power 0.25 for mm SL day and F0.05[2,12]50.74,
21
P50.497 and post hoc power 0.10 for mg WW day ), or between marked and unmarked fish (F0.05[1,13]5
– 1
0.090, P50.766 and post hoc power 0.05 mm SL day and F0.05[1,13]51.73, P50.211 and post hoc power
– 1
0.06 for mg WW day )
21 21
Main n mm SL day mg WW day
effect
Mean S.D. Mean S.D.
Tank Tank 1 5 0.07 0.027 8.91 2.50
Tank 2 5 0.08 0.015 13.36 6.23
Tank 9 5 0.12 0.053 13.16 9.08
Mark Mark 12 0.09 0.027 12.87 4.41
Table 3
21
ANOVA for the fixed effects of the daily somatic growth (mm SL day ) in experiments with juvenile E. crossotus at 14, 20, 24 and 298C during four subsequent 12 day growth periods
Effect Num. Den. F-
P-df df ratio value
Temperature 3 4 7.84 0.038
Period 3 99 1.25 0.295
Temp*Period 9 99 10.71 ,0.000
same temperature (Fig. 2). In tank five two fish died in the first growth period and in tank six three fish died late in the second and early in the third growth period. In tanks four and eight the reason for lower growth in the first growth period was unclear. The initial size was a significant (negative) effect on SG only in tank four (208C) (P5 0.001). The lack of a consistent effect of initial size on growth indicated that, within the size range of the juveniles used, SG at each T was independent of the size of the fish. Since we were interested in the relationship between T and SG under good quality growth conditions we omitted the data from period four at 208C, period two at 248C and period one at 298C based on the above analysis. Data from all fish and all periods at each
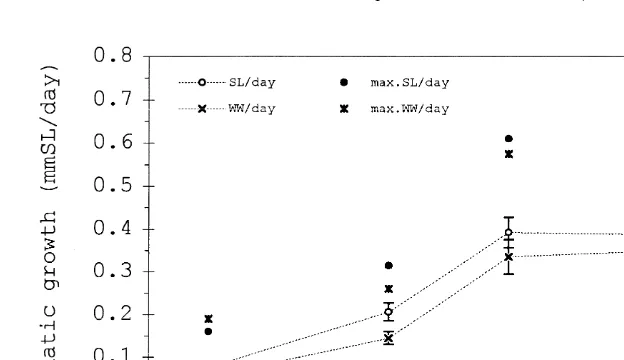
T were then pooled. The somatic growth increased with temperature reaching a
maximum at 24 and 298C and showed similar patterns whether expressed as mm SL
21 21 21
day or g WW d (Fig. 3). The maximum observed growth rate was 0.7 mm SL d
21
or 0.136 g WW d , both at 298C. A Bonferroni multiple comparison yielded a
Fig. 3. Mean daily increase in length (left axis,s) and wet weight (right axis,3) of juvenile E. crossotus at the four experimental temperatures. The error bars indicate61 standard error. (d,*) The maximum observed values.
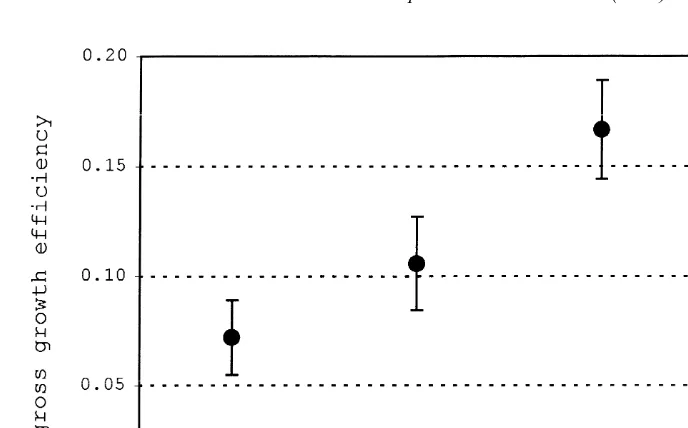
significant difference between SG for 14 versus 208C only. The gross growth efficiency (E ) increased with T to 248C, with a subsequent decrease at 298C (Fig. 4).
3.2. Validation of daily increment deposition and check formation
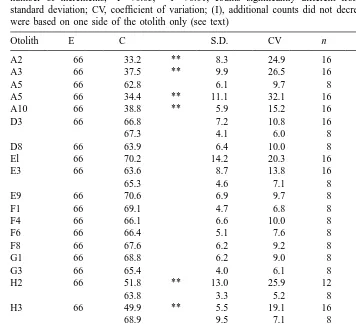
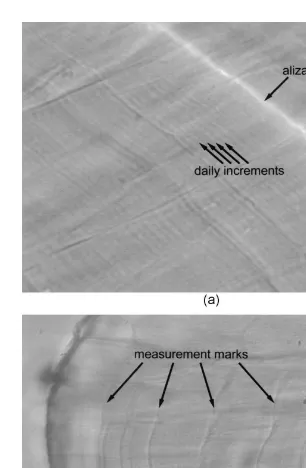
The Alizarin complexone left a clear fluorescent mark that could be followed consistently throughout all otolith preparations. For the validation of the daily increment deposition, eight replicate counts were enough to generate a mean value with a coefficient of variation (CV) of #10% in 11 of the 24 examined otoliths (Table 4). Increasing the counts lowered the CV to #10% in only two more otoliths. In six of the remaining otoliths, the increments on one side of the sulcus (two on the dorsal and four on the ventral side) were inconsistent and difficult to distinguish, resulting in variable counts (CV 14–26%). Subsequently, the other side was used for the analysis and in all otoliths eight counts on that side yielded a CV #10%. A t-test revealed that in only five otoliths was the mean number of counted increments significantly different from the expected value; in all cases they were lower (Table 4).
Some otoliths showed indications of stress checks; discontinuities in the appearance of the micro-increments (Fig. 5B). These checks were visible as darker and more pronounced opaque zones and could possibly be associated with the measurement events. The first occurred on the 18th day after marking, and the number of daily increments between the subsequent stress checks was 12, coinciding with the number of days in each of the four growth periods.
3.3. Somatic growth and otolith growth
Fig. 4. Mean gross growth efficiency (E ) of juvenile E. crossotus at the four experimental temperatures. E was calculated as daily somatic growth of all fish per tank divided by the daily food intake per tank. Data from only those growth periods in which no fish died were used and data from the two tanks per temperature were pooled. The vertical bars indicate61 standard error.
2
increase in otolith surface area outside the mark (SA in mm ) and daily somatic growth
21 2
(SG in mm SL day 50.06910.9193SA, F1,19555.3, adj.r 574%, Fig. 6A), suggesting a positive relationship between somatic growth and otolith growth. We assumed that either otolith could be used for the analysis since linear measurements of otolith growth outside the mark (W ) in both otoliths of five fish indicated that W was not consistently higher or lower in the left or right otolith, and that there were no significant differences in the mean W of the two sagittal otoliths of each fish (P-values ranged from 0.471 to 0.606, while the post hoc power ranged from 0.10 to 0.19, Table 5).
To describe the relationship between SG and increment width (IW), we first compared the data based on the linear measurements from the Alizarin mark to the edge (66 days,
d in Fig. 6B) with the data based on the last 24 daily increments (24 days, 3 in Fig.
6B). A visual inspection of the regression lines suggested differences between the two data sets when somatic growth was low. An ANCOVA yielded no significant differences between the slopes (P50.750) or the intercepts (P50.998) of two linear regression
21
lines for SG$0.2 mm SL day , a value selected on the basis of the visual inspection.
21
Table 4
Validation of daily increment deposition in E. crossotos otoliths. E, expected number of increments; C, counted number of increments; *P,0.05, **P,0.01, counts significantly different from expected value; S.D., standard deviation; CV, coefficient of variation; (I), additional counts did not decrease the CV; (II), counts were based on one side of the otolith only (see text)
Otolith E C S.D. CV n
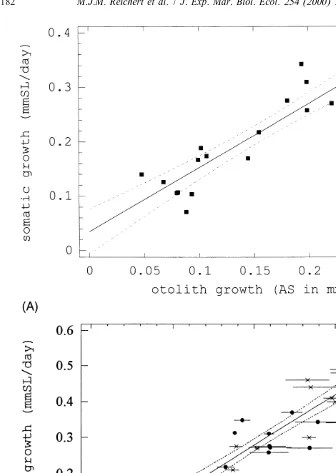
197). Changes in IW accounted for 85% of the variability in SG. A comparison of regression models yielded a logarithmic relationship (SG50.28910.170 ln(IW), F1,225
2
98.1, adj.r 582%) for the lower part of the data (SG,0.35) and a reciprocal model for 2 the upper part of the data (SG.0.18, SG51 /(6.34–2.623IW), F1,24563.0, adj.r 5
2
72%). The r values for the linear models using the same data were respectively 5 and 2% lower.
4. Discussion
4.1. Somatic growth and temperature
Fig. 6. Regression analyses of the relationship between daily somatic growth (SG) and otolith growth. The dotted lines are the 95% confidence limits. (A) Relationship between the increase in otolith surface outside the
2 2
mark (SA in mm ) and SG. SG50.06910.9193SA, F1,19555.3, adj.r 574%. (B) Relationship between SG and increment width (IW). (d) Data based on measurements from the Alizarin mark to the edge (66 days); (3) data based on the measurements of the last 24 daily increments. SG5 20.00410.2823IW, F1,335197,
2
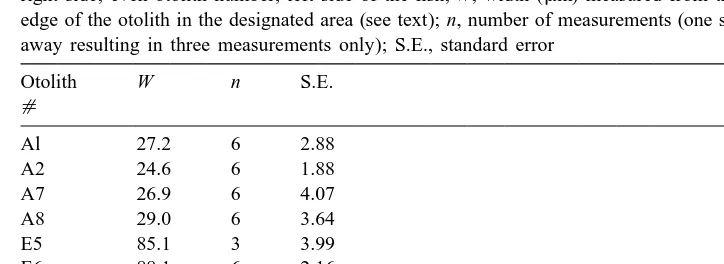
Table 5
Variability in width measurements in both sagittal otoliths of five juvenile S. crossotus. Odd otolith number, right side; even otolith number, left side of the fish; W, width (mm) measured from the Alizarin mark to the edge of the otolith in the designated area (see text); n, number of measurements (one side of ES was polished away resulting in three measurements only); S.E., standard error
Otolith W n S.E.
tal growth conditions were generally good. At the beginning of the first growth period, the condition factor (CF) of the experimental fish at all four temperatures was below that of field-collected fish. The condition factor (CF) increased during the growth experiment at all temperatures to values not different from or exceeding those determined shortly after the fish were caught. By the end of the growth experiment the CF increased most at 248C, suggesting near optimal growth conditions, also supported by high growth rates at that temperature. The increase in growth efficiency with the growth rate suggested that optimal food conversion took place near the optimum growth temperature. Growth efficiency data for E. crossotus are not available in the literature, but a growth efficiency between 7 and 17% is within the range given for other fish species (e.g., Volk et al., 1984; Fonds et al., 1992). The lack of a significant relationship between fish size and somatic growth in juveniles between 25 and 70 mm SL was supported by information from field-collected fish of the same size range (Reichert and van der Veer, 1991; Reichert, 1998). The high variability in the growth data at 298C might have been caused by the fact that this is close to the potential lethal temperature of 318C for this species (Topp and Hoff, 1972; Reichert, unpublished data). The low growth rate in the first growth period at 298C might have resulted from incomplete acclimation. The analysis indicated that acclimation was completed before the first growth period at the other temperatures. The growth rates observed at the various temperatures were similar to the few values provided in other studies. Growth experiments with juvenile E. crossotus by
21 Reichert and van der Veer (1991) yielded a mean growth rate of 0.5 mm SL day at
21 21
both 24 and 298C, with maximum values of 0.7 mm day at 248C and 0.8 mm day at 298C. The growth curve based on otolith data of field-collected fringed flounder by
21
Reichert (1998) indicated a mean growth rate of 0.5 mm day for juveniles, but the effect of temperature was not taken into account in constructing that curve.
communication). Additional growth experiments with fish of a different size range should provide information on size-dependent temperature preferences as reported by Fonds and Saksena (1977) and Fonds et al. (1992) for plaice and sole. Juveniles of these two species have a higher optimum temperature for growth than larger fish, which grow better at lower temperatures. In both plaice and sole the young adults migrate offshore where they find optimum growth conditions at lower temperatures. While juvenile E.
crossotus are abundant in southeastern estuaries, the large adults (.8 cm SL) are rarely found there, but are commonly caught offshore (Reichert and van der Veer, 1991; Allen and Baltz, 1997; Reichert, 1998; Boylan, SCDNR, personal communication). Although Fonds et al. (1992) worked on northern temperate species, a similar migration pattern might be reflected in a similar size-dependent growth response to temperature.
4.2. Daily increments validation and check formation
The formation of daily increments was validated for E. crossotus. In five fish with low growth rates the number of counted daily increments was less than the expected value and the daily increments might have been too narrow to be consistently distinguished using a light microscope. The overall variability in the counts of the daily increments suggested that four replicate counts in each of the two designated areas are sufficient to estimate the fish’s age.
The formation of checks in otoliths following environmental or physiological events have also been described by several other authors (e.g., Campana, 1983; Volk et al., 1984, 1999; Berghahn and Karakiri, 1990; Geffen and Nash, 1995; Berghahn, 2000). In our experimental work with E. crossotus, stress checks were not present or clearly visible in all otoliths, possibly because of careful handling to reduce stress. Campana (1992) and Geffen (1992) provide an excellent overview of the many factors affecting the deposition and appearance of daily increments: feeding frequency, temperature, and light can influence deposition, appearance, and width of daily increments. Recently, Volk et al. (1999) described the use of temperature cycles to induce stress checks in otoliths of juvenile salmonids and reviewed its use in large-scale marking efforts. Less careful handling or a temporary change in oxygen level or temperature might create a more distinct stress mark that can be used in lieu of chemical marking.
4.3. Somatic growth and increment width
the experimental method using the Alizarin mark in the otolith. The standardized measurements used in this study revealed a highly significant linear relationship between increment widths (IW) and somatic growth rates, indicating that increment widths can be used to estimate recent somatic growth. A linear relationship has also been reported for other species, e.g. Jenkins et al. (1993) for juvenile greenback flounder, and Dickey et al. (1997) for juvenile striped bass. There is, however, reason for some caution. A linear relationship between IW and SG with an intercept close to the origin implies that there was no evidence for a loss of a linear relationship (uncoupling) between SG and IW. The deviation from a linear relationship at the lower and higher ends of the somatic growth rate spectrum suggested that an uncoupling between somatic growth and increment width might be present. The exact nature of the relationship between otolith growth and fish growth near maximal end minimal growth rates is not entirely clear using the currently available data. The minimum increment width in the area we designated for our measurements was about 0.4 mm, but the analysis suggests that increment widths less than 0.6mm should be used with caution to estimate daily somatic growth. The data also indicated that somatic growth might be somewhat underestimated when the increment width becomes greater than l.5mm and may be better described by a reciprocal function. Detailed studies of the lower and upper end of the growth rate spectrum may reveal a relationship between SG and IW that is more accurately described with a reciprocal natural log or polynomial function.
The validation of daily increment deposition and the relationship between increment width and rate of somatic growth can be used to estimate recent growth of field-collected juvenile E. crossotus. Using the known growth response to temperature, a comparison can be made between the potential growth and realized growth based on recent temperature profiles in the natural environment. Possible discrepancies can be traced to possible growth-limiting factors in the environment such as food and the physical environment. These experimental data fill a void in the information on growth of smaller, shortlived subtropical flatfishes. Our work is currently used to estimate growth rates of individual fish collected in the field, to investigate the role of food in determining growth rates of field populations, and to model both individual and population growth of the fringed flounder.
Acknowledgements
Institute. This is Contribution No. 1240 of the Belle W. Baruch Institute for Marine Biology and Coastal Research. [AU]
References
Allen, R.L., Baltz, D.M., 1997. Distribution and microhabitat use by flatfishes in a Louisiana estuary. Environ. Biol. Fishes 50 (1), 85–103.
Berghahn, R., 2000. Response to extreme conditions in coastal areas: biological tags in flatfish otoliths. Mar. Ecol. Prog. Ser. 192, 277–285.
Berghahn, R., Karakiri, M., 1990. Experimental induction of biological tags in otoliths of 0-group plaice Pleuronectes platessa by starvation, temperature, and UV-B radiation. Mar. Ecol. Prog. Ser. 67, 227–233. Bradford, M.J., Geen, G.H., 1987. Size and growth of juvenile chinook salmon back-calculated from otolith growth increments. In: Summerfelt, R.C., Hall, G. (Eds.), Age and Growth of Fish. Iowa State University Press, Ames, IA, pp. 453–462.
Brett, L.J., Groves, T.D.D., 1979. Physiological energetics. In: Hoar, W.S., Randall, D.S., Brett, J.R. (Eds.). Fish Physiology, Vol. 8. Academic Press, New York, pp. 279–352.
Brody, S., 1945. Bioenergetics and Growth. Reinhold, New York, 1023 pp.
Brothers, E.B., McFarland, W.N., 1981. Correlations between otolith microstructure, growth and the life history transitions in newly recruited French grunts (Haemlon flavolineatum (Desmarest) Haemulidae). Rapp. P.-V. Reun. Cons. Int. Explor. Mer 178, 369–374.
Campana, S.E., 1983. Calcium deposition and otolith check formation during periods of stress in coho salmon, Oncorhynchus kisutch. Comp. Biochem. Physiol. 75A, 215–220.
Campana, S.E., 1992. Measurements and interpretation of the microstructural examination. In: Stevenson, D.K., Campana, S.F. (Eds.), Otolith Microstructure Examination and Analysis. Can. Spec. Publ. Fish. Aquat. Sci., Vol. 117, pp. 19–57.
Campana, S.E., Jones, M.J., 1992. Analysis of otolith microstructure data. In: Stevenson, D.K., Campana, S.E. (Eds.), Otolith Microstructure Examination and Analysis. Can. Spec. Publ. Fish. Aquat. Sci., Vol. 117, pp. 73–100.
Dickey, C.L., Isely, J.J., Tomasso, J.R., 1997. Slow growth did not decouple the otolith size fish size relationship in striped bass. Trans. Am. Fish. Soc. 126 (6), 1027–1029.
Fonds, M., Saksena, V.P., 1977. The daily food intake of young soles (Solea solea L.) in relation to their size and water temperature. ICES Acte Coll. CNEXO 4, 51–58.
Fonds, M., Cronie, R., Vethaak, A.D., Puyl van der, P., 1992. Metabolism, food consumption and growth of plaice (Pleuronectes platessa) and flounder (Platichthys flesus), in relation to fish size and temperature. Neth. J. Sea Res. 29 (1–3), 127–143.
Geffen, A.J., 1992. Validation of otolith increment decosition rate. In: Stevenson, D.K., Campana, S.E. (Eds.), Otolith Microstructure Examination and Analysis. Can. Spec. Publ. Fish. Aquat. Sci., Vol. 117, pp. 101–113.
Geffen, A.G., 1982. Otolith ring deposition in relation to growth rate in herring (Clupea harengus) and turbot (Scophthalmus maximus). Mar. Biol. 71, 317–326.
Geffen, A.J., Nash, R.D.M., 1995. Periodicity of otolith check formation in the juvenile plaice. In: Secor, D.H., Dean, J.M., Campana, S.E. (Eds.), Recent Developments in Fish Otolith Research. The Belle W. Baruch Library in Marine Science, Vol. No.19. The University of South Carolina Press, Columbia, SC, pp. 65–76. Gibson, R.N., 1994. Impact of habitat quality and quantity on the recruitment of juvenile flatfishes. Neth. J.
Sea Res. 32 (2), 191–206.
Jearld, A., Sass, S.L., Davis, M.F., 1992. Early growth, behavior, and otolith development of the winter flounder Pleuronectes americanus. Fish. Bull. 91, 65–75.
Jones, C.M., 1992. Development and application of the otolith increment technique. In: Stevenson, D.K., Campana, S.E. (Eds.), Otolith Microstructure Examination and Analysis. Can. Spec. Publ. Fish. Aquat. Sci., Vol. 117. Canadian Department of Fisheries and Oceans, pp. 1–11.
Joyeux, J.-C., Miller, J.M., Aliaume, C., Zerbi, A., 1995. Growth of sand whiff Citharichthys arenaceus and bay whiff Citharichthys spilopterus (Pleuronectiformes: Bothidae) in Puerto Rico (Greater Antilles) and North Carolina (USA), with comments on growth rate comparisons. Neth. J. Sea Res. 34 (1–3), 211–220. Karakiri, M., von Westenhagen, H., 1989. Daily growth patterns in otoliths of larval and juvenile plaice (Pleuronectes platessa L.): influence of temperature, salinity and light conditions. Rapp. P.-V. Reun. Cons. Int. Explor. Mer 191, 376–382.
Martin, F.D., Drewry, G.E., 1978. Stromateidae Through Ogcocephalidae. Development of Fishes of the Mid-Atlantic Bight. An Atlas of Egg, Larval and Juvenile Stages, Vol. VI. U.S. Department of the Interior, Fish and Wildlife Service, Biological Services Program, 416 pp.
McEvoy, L.A., McEvoy, J., 1992. Multiple spawning in several commercial fish species and its consequences for fisheries management, cultivation and experimentation. J. Fish Biol. 41 (Suppl. B), 125–136. Miller, J.M., Burke, J.S., Fitzhugh, G.R., 1991. Early life history patterns of Atlantic North American flatfish:
likely (and unlikely) factors controlling recruitment. Neth. J. Sea Res. 27 (3 / 4), 261–275.
Moe, M.A., Martin, G.E., 1965. Fishes taken in monthly trawl samples offshore of Pinellas county, Florida, with new additions fish fauna of the Tampa Bay area. Tul. Stud. Zool. 12, 29–151.
Mosegaard, H., Svedang, H., Taberman, K., 1988. Uncoupling between somatic growth and otolith growth in Arctic charr (Alvinus alpinus) as an effect of differences in temperature response. Can. J. Fish. Aquat. Sci. 45, 1514–1524.
Neilson, J.D., Geen, G.H., 1985. Effects of feeding regimes and diel temperature cycles on otolith increment formation in juvenile chinook salmon (Oncorhynchus tshawytscha). Fish. Bull. 83 (1), 91–101. Ogburn, M.V., Allen, D.M., Michener, W.K., 1988. Fishes, shrimps, and crabs of the North Inlet estuary, SC: a
four year seine and trawl survey. Baruch Institute Technical Report No. 88-1. University of South Carolina, Columbia, 299 pp.
Pannella, G., 1971. Fish otoliths: daily growth layers and periodical patterns. Science 173, 1124–1127. Reichert, M.J.M., van der Veer, H.W., 1991. Settlement, abundance, growth and mortality of juvenile flatfish in
a subtropical tidal estuary (Georgia, U.S.A. Neth. J. Sea Res. 27 (3 / 4), 375–391.
Reichert, M.J.M., 1998. Etropus crossotus, an annual flatfish species; age and growth of the fringed flounder in South Carolina. J. Sea Res. 40 (3 / 4), 323–332.
Reid, G.K., 1954. An ecological study of the Gulf of Mexico fishes in the vicinity of Cedar Key, Florida. Bull. Mar. Sci. Gulf Caribb. 4, 1–94.
SAS Institute, 1999. SAS / STAT User’s Guide, Version 8. SAS Institute, Cary, NC.
Secor, D.H., Dean, J.M., Baldevarona, R.B., 1989. Comparison of otolith growth and somatic growth in larval and juvenile fishes based on otolith length / fish length relationships. Rapp. P.-V. Reun. Cons. Int. Explor. Mer 191.
Secor, D.H., Laban, E.H., Dean, J.M., 1991. Manual for otolith removal and preparation for microstructural examination. Technical Publication No. 1991-01. Belle W. Baruch Institute for Marine Biology and Coastal Research, Columbia, SC, 85 pp.
Secor, D.H., Dean, J.M., Campana, S.E., 1995. Recent developments in fish otolith research. In: The Belle W. Baruch Library in Marine Science, Vol. 19. University of South Carolina Press, Columbia, SC, 735 pp. Simkiss, K., 1974. Calcium metabolism of fish in relation to ageing. In: Bagenal, T.B. (Ed.), Ageing of Fish.
Unwin Brothers, London, pp. 1–12.
Stevenson, D.K., Campana, S.E., 1992. Otolith Microstructure Examination and Analysis. Can. Spec. Publ. Fish. Aquat. Sci., Vol. 117. Canadian Department of Fisheries and Oceans, 126 pp.
Stickney, R.R., Taylor, G.L., Heard, III R.W., 1974. Food habits of Georgia estuarine fishes I: Four species of flounders (Pleuronectiformes: Bothidae. Fish. Bull. 72 (2), 515–525.
Topp, R.W., Hoff, Jr., F.H., 1972. Memoirs of the hourglass cruises: flatfishes (Pleuronectiformes). In: Memoirs of the Hourglass Cruises, Vol. IV, Part II. Marine Laboratory, Florida Department of Natural Resources, St. Petersburg, 135 pp.
Van der Veer, H.W., Alliaume, C., Miller, J.M., Adriaans, E.J., Witte, J.I., Zerbi, A., 1994. Ecological observations on juvenile flatfish in a tropical coastal system, Puerto Rico. Neth. J. Sea Res. 32 (3 / 4), 453–460.
Volk, E.C., Wissmar, R.C., Simmenstad, C.A., Eggers, D.M., 1984. Relationship between otolith micro-structure and growth of juvenile chum salmon (Oncorhynchus keta) under different prey rations. Can. J. Fish. Aquat. Sci. 41, 126–133.
Volk, E.C., Schroder, S.L., Grimm, J.J., 1999. Otolith thermal marking. Fish. Res. 43 (1–3), 205–219. Wright, P.J., Metcalfe, N.B., Thorpe, J.E., 1990. Otolith and somatic growth rates in Atlantic salmon parr,