www.elsevier.com / locate / econbase
Business success and businesses’ beauty capital
a b c ,
*
dGerard A. Pfann , Jeff E. Biddle , Daniel S. Hamermesh
, Ciska M. Bosman
a
Faculty of Economics, University of Maastricht, Maastricht, The Netherlands b
Department of Economics, Michigan State University, MI, USA c
Department of Economics, University of Texas, Austin, TX 78712-1173, USA d
Nice, France
Received 9 July 1999; accepted 8 October 1999
Abstract
Using a sample of Dutch advertising firms, we find that those with better-looking executives have higher revenues. Impacts on revenue far exceed the likely effects of beauty on the executives’ earnings. This suggests that beauty creates firm-specific investments, with the returns shared by the firm and the executive. 2000 Elsevier Science S.A. All rights reserved.
Keywords: Discrimination; Beauty; Productivity
JEL classification: J7
1. Introduction
Recent research has demonstrated a relationship between physical attractiveness and earnings, but whether the wage differentials are due to discrimination or to differences in productivity remains an
1
open question. One way of examining this is to study the payoff to the characteristic in product markets. This study uses firm-level panel data from the Dutch advertising industry to analyse the effect of employees’ attractiveness, or beauty, on firms’ performance.
2. Theoretical issues
There are several reasons for a relationship between employees’ beauty and their firm’s performance. In industries where clients have substantial interactions with employees, consumer
*Corresponding author. Tel.: 11-512-475-8526; fax:11-512-471-3510.
E-mail address: [email protected] (D.S. Hamermesh) 1
See Hamermesh and Biddle (1994); and for specific groups of workers, such as attorneys, see Biddle and Hamermesh (1998), and for prostitutes, see Lillard (1995). See also Filer (1981) for evidence of the effects of other ascriptive characteristics on wages.
discrimination might give a competitive advantage to firms with more attractive workers. If the assumption of competitive markets is maintained, however, employee beauty must have some real effect in the production process for a beauty / firm performance relationship to exist. For example, one could assume that the firm’s ‘beauty capital’ augments its production function, as in Y5F(N,K,B ),
FB.0, where Y is a measure of value added or sales, N the number of employees, K the level of
physical capital, and B is beauty capital, a function of the physical appearance of all or of certain key employees. Firms would then choose N, K and B to maximise profits:
p5PY2C(N,K,B ), (1)
where P is product price, C(?) is a cost function, and the dependence of C on B reflects the higher wages more attractive workers command. In long-run competitive equilibrium all firms earn zero profits, but those with more beauty capital produce more and obtain higher revenues. The coefficient of a measure of beauty from a regression of output or revenue data would estimate the impact of beauty in the production function.
In this competitive situation more beautiful workers capture the full returns to their greater productivity; but competitive labour markets that include search costs, human capital investment, or simply worker and firm heterogeneity can generate quasi-rents to labour, some of which the firm can capture. If the quasi-rents are increasing in ability, profits may be increased by employing more able / productive workers (see Hashimoto and Yu, 1980). Good working relationships with one’s co-workers and the firm’s clients create a form of firm-specific human capital, and a facility for forming these good relationships lowers the marginal cost of acquiring such capital. In the context of Hashimoto and Yu’s model, more beautiful managers may find it easier to develop such relationships, generating higher earnings for themselves and higher quasi-rents for their employers. Only if workers and employers can fully assess ex ante the value of the manager’s looks will the worker capture all the returns and the quasi-rents not be generated.
3. Measuring beauty and other characteristics
Our basic data set is a sample of Dutch advertising agencies, all members of one of the three associations of such agencies (Rota, VEA or Pragma). We include a firm in our sample from the first year during the period 1984–94 that it is reported until it disappears. The sample consists of 289 agencies, yielding 2111 (N(t)3T ) observations. N(t), the number of firms in the sample in a given
year, varies from 162 to 222. The agencies account for about 70 percent of industry sales.
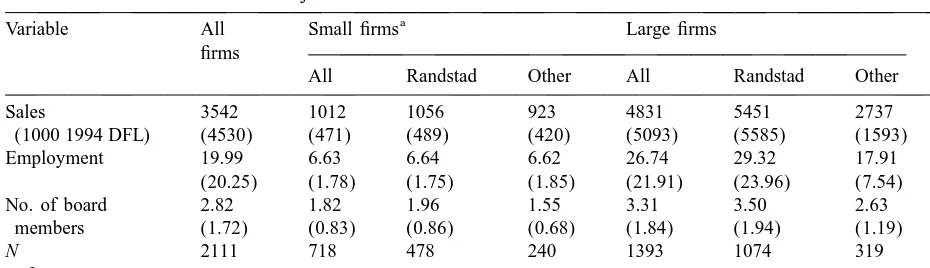
Table 1
Means and standard deviations of major variables a
Variable All Small firms Large firms
firms
All Randstad Other All Randstad Other
Sales 3542 1012 1056 923 4831 5451 2737
(1000 1994 DFL) (4530) (471) (489) (420) (5093) (5585) (1593)
Employment 19.99 6.63 6.64 6.62 26.74 29.32 17.91
(20.25) (1.78) (1.75) (1.85) (21.91) (23.96) (7.54)
No. of board 2.82 1.82 1.96 1.55 3.31 3.50 2.63
members (1.72) (0.83) (0.86) (0.68) (1.84) (1.94) (1.19)
N 2111 718 478 240 1393 1074 319
N firms 289 144 98 47 220 170 54
a
Small firms have fewer than 10 employees.
homely, far below average in attractiveness. To reduce problems of reverse causation, the looks of each manager are rated in the first year that his / her picture became available. The beauty of the average manager in the advertising industry is 2.80, just below average on our five-point scale. There is substantial agreement about the executives’ looks: the average pairwise correlation among raters is
10.29, highly significant given the number of pictures.
Data describing agencies’ sales and employment were collected from the same sources. Table 1 provides descriptive statistics for the sample, divided into large and small firms (fewer than 10 employees, the standard definition for this industry, as in Centraal Bureau voor de Statistiek, 1991, et seq.). During the 11-year period many firms switched from small to large, and a few from large to small; thus the number of firms classified as large or small in Table 1 is 366, not 289. The average small agency has almost seven employees and sales of 1.01 million 1994 Dutch guilders (US $650 thousand). Larger agencies average 27 workers and sales of 4.83 million 1994 guilders. We also classify firms based on location in or outside the Randstad (the region containing the major Dutch cities of Amsterdam, The Hague, Rotterdam and Utrecht).
4. Beauty in the production function
The first column of Table 2 presents estimates of a Cobb–Douglas-type function to which the average beauty of the firm’s board members and indicator variables for the year(s) it is observed have been added. Executives’ beauty has a positive effect on firms’ revenues, as we expected, but while the estimates in column 1 are quite satisfactory, they are not robust to alternative cuts of the sample: behavior is substantially different inside and outside the Randstad, and between small and large firms. We thus present estimates that include both an indicator variable for location in the Randstad and its interaction with the firm’s average beauty, and we distinguish between small and large firms.
Table 2
a The effect of beauty on productivity [dependent variable, ln(Sales)]
Variable All firms Small firms Large firms
Ln(Employees) 0.750 1.046 1.051 0.844 0.766 1.104 1.115
(0.011) (0.011) (0.013) (0.044) (0.054) (0.015) (0.016)
Ln(Board) 0.116 0.105 0.142 0.078 0.287 0.108 0.090
(0.016) (0.016) (0.024) (0.031) (0.066) (0.017) (0.025)
Beauty 0.038 0.115 0.187 0.125 0.192 0.175 0.259
(0.018) (0.041) (0.059) (0.064) (0.120) (0.055) (0.065)
Randstad 0.412 0.856 0.672 1.237 0.321 0.601
(0.128) (0.175) (0.200) (0.342) (0.168) (0.201)
Beauty*Randstad 20.110 20.268 20.203 20.399 20.083 20.185
(0.046) (0.064) (0.072) (0.125) (0.061) (0.074)
sBeauty 0.089 0.088 0.033
(0.031) (0.032) (0.035)
]2
R 0.876 0.878 0.892 0.399 0.461 0.853 0.867
N 2107 2107 1497 714 370 1393 1127
N firms 289 289 235 144 93 220 192
≠ln(Sales) /≠Beauty 0.005 20.080 20.078 20.207 0.092 0.074
in Randstad (0.022) (0.025) (0.034) (0.038) (0.027) (0.034)
a
Standard errors in parentheses below the parameter estimates.
ln(Employees), 1.046, in column 2 shows that, once we account for differences between the Randstad and the rest of the country, there are very slight increasing returns to scale. This cross-section finding is consistent with evidence that average firm size in the industry has increased since 1987 (CBS, 1994). Given the size of the firm, having more board members generates additional revenue, presumably because board members are more skilled than non-board employees. Finally, sales are higher in the Randstad, other things equal, both because nominal prices are higher there and because more productive members of the industry may gravitate toward the area where opportunities for advancement are greater.
Examining columns 2, 4 and 6, we see that advertising firms with better-looking board members generate significantly greater revenues, other things equal. This is true in estimates based on the entire sample, and also for both small and large firms outside the Randstad. When we disaggregate the sample by location and firm size, we find that only among small firms in the Randstad is the impact of beauty on agencies’ revenues negative.
Why beauty should have a negative effect in this one subsample is unclear, but one possibility is that the result arises from an artificial sample-selection problem created when we restrict the sample to small firms inside the Randstad. If a firm with good-looking board members remains small in the Randstad, where the opportunities for growth are greatest (witness the inter-area difference in firm size shown in Table 1), that firm presumably also has unobservable detrimental characteristics that make it grow more slowly. The substantial overlap of firms in the two subsamples provides some support for this interpretation.
specialization. Although the example is stereotypical, a firm might assign its good-looking board member to hustle clients while the plain board member handles financial matters in the back room. The estimates in columns 3, 5 and 7 of Table 2 add sBeauty to the regressions. For both the entire sample and for the subsamples distinguished by firm size the estimates imply that greater dispersion
2 of executives’ looks raises productivity. Implicitly specialization pays off.
An alternative causal path to that described in Section 2 is that beautiful executives are attracted to already successful firms. If success causes (the firm’s) beauty, better-looking executives will be attracted to firms that have previously been more successful. Taking the 256 executives who in Year t joined firms that were in our sample in Year t21, we regress their average beauty on their firms’ lagged sales, the lagged number of board members, and lagged total employment. None of the
t-statistics in this regression exceeds one in absolute value, and the coefficient on lagged sales is
negative (t5 20.16). Previously successful firms do not attract better-looking executives.
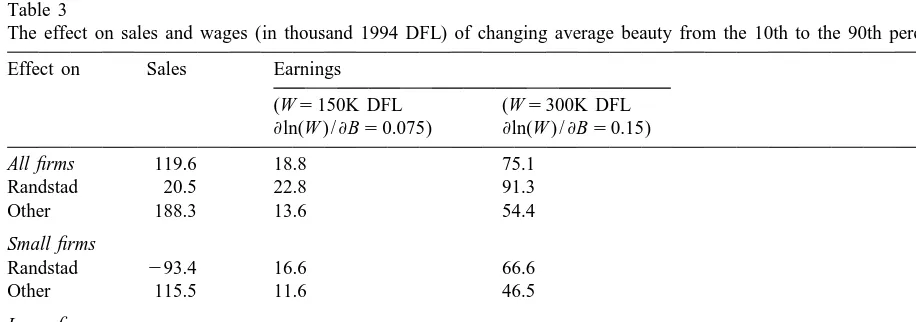
In light of the discussion in Section 2, how does the impact of beauty on the firm’s value added compare to its effect on wages? Does beauty produce quasi-rents that are shared by the worker and the firm, or does it merely enhance the firm’s revenue and wages by equal amounts? We start by simulating the effect on sales of a change in the firm’s beauty from the 10th percentile of firms in each subsample to the 90th. The results are presented in the first column of Table 3 for the whole sample, by region for the entire sample and for small and large firms separately (corresponding to the estimates in columns 1, 2, 4 and 6 of Table 2). Beauty is highly productive: for the entire sample the effect is 120 thousand guilders. This increase in average beauty raises revenue by 21 thousand guilders per year in the Randstad, and by 188 thousand guilders per year outside. Except for small firms in the Randstad, where we could not discern any positive effect of beauty on revenues, similar calculations for the other subsamples (presented in the fifth through seventh rows of the table) show that better-looking executives generate substantially higher revenues.
Since we do not have data on individuals’ earnings W, we use extraneous estimates from studies of
Table 3
The effect on sales and wages (in thousand 1994 DFL) of changing average beauty from the 10th to the 90th percentile Effect on Sales Earnings
the impact of looks on earnings along with information on the average earnings of Dutch advertising executives to infer the responsiveness of W to looks,≠ln(W ) /≠B. Multiplying this by average board
size, and then multiplying by the change in beauty between less- and better-looking boards,DB, yields
D[Wage bill] /DBeauty5W?[Board size]DB[≠ln(W ) /≠B]. (2)
We calculate DB as a move from the 10th to the 90th percentile of average beauty.
The best evidence suggests that, in 1995, average gross earnings of executives in the largest 3
agencies was no more than 225,000 guilders. We use a range of 150 to 300 thousand guilders. In the individual data that underlie this study a change in beauty from the 10th to the 90th percentiles moves the person from the middle of categories 1 and 2 in the ratings we have used to the middle of categories 4 and 5. Evidence for the U.S., Canada and China from Hamermesh and Biddle (1994) and Hamermesh et al. (1999) suggests that this change raises earnings by between 7.5 and 15 percent.
In column 2 of Table 3 we present an estimate ofD[Wage bill] /DBeauty, based on the assumption of a 7.5-percent effect on wages averaging 150,000 DFL per year; in column 3 we assume a 15-percent effect on average wages of 300,000 DFL per year. In the entire sample, and in the three subsamples other than small firms in the Randstad, even the highest estimate of the impact of beauty on board members’ earnings is far below the estimates of its effects on revenues that are shown in column 1.
These calculations imply that the positive effect of executives’ looks on revenues substantially exceeds the direct effect of their beauty on their own earnings. For the sample as a whole the results in the first row of Table 3 suggest that, at most, only 63 percent (75.1 / 119.6) of a change in the beauty of a firm’s executives is reaped by the executives in the form of higher wages. At least one-third of the quasi-rents generated by beauty is reaped by the firm as higher profits. Beauty capital yields returns to both workers and firms. While perhaps unsurprisingly much of this type of capital is not firm-specific, a large part of it appears to be. That the effect results from interactions of better-looking executives with their work groups is consistent with our results. No doubt one can construct other explanations that are also consistent, but these too would have to be based on the firm-specificity of the effects of beauty.
5. Conclusions
We have used the Dutch advertising industry to provide the first analysis of the impact of affective human capital on firms’ performance. Like other characteristics, such as sex and race, the characteristic on which we have focused — beauty — is one that a number of studies have demonstrated affects earnings. Our strategy of examining the impact of managers’ beauty on firms’ revenues has allowed us to shed light on whether and to what extent the differentials associated with beauty are due to discrimination or to differences in productivity. Executives’ beauty raises firms’ sales; and those increases exceed the likely extra wages that good-looking executives command. The results demonstrate that studies that consider the impact of workers’ other ascriptive characteristics on
3
firms’ performance would provide a useful complement to the vast literature that simply measures the wage differences associated with those characteristics.
Acknowledgements
Steve Bronars and Steve Nickell provided helpful suggestions, as did participants at several seminars. We thank several individuals in the Dutch advertising industry and are deeply grateful to the people who evaluated the photographs.
References
Biddle, J., Hamermesh, D., 1998. Beauty, productivity and discrimination: lawyers’ looks and lucre. Journal of Labor Economics 15, 172–201.
Centraal Bureau voor de Statistiek, 1991 et seq. Onder de loep genomen: reklame- en advertentiebureaus. CBS, Heerlen, The Netherlands.
Filer, R., 1981. The influence of affective human capital on the wage equation. Research in Labor Economics 4, 367–409. Hamermesh, D., Biddle, J., 1994. Beauty and the labor market. American Economic Review 84, 1174–1194.
Hamermesh, D., Meng, X., Zhang, J., 1999. Dress for success: does primping pay? National Bureau of Economic Research, Working Paper No. 7167.
Hashimoto, M., Yu, B.T., 1980. Specific capital, employment contracts and wage rigidity. Bell Journal of Economics 11, 536–549.
![Table 2The effect of beauty on productivity [dependent variable, ln(Sales)]](https://thumb-ap.123doks.com/thumbv2/123dok/1849434.2107225/4.612.47.506.105.317/table-the-effect-beauty-productivity-dependent-variable-sales.webp)