ePROCEEDING
The 13
thUBAYA International Annual Symposium on Management
MARKET INTEGRATION IN ASEAN:
SUSTAINABLE GROWTH AND
CROSS CULTURAL ISSUES
Ho Chi Minh City, Vietnam
18
th-20
thMarch 2016
Department on Management
Faculty of Business and Economics, University of Surabaya,
Surabesia
Proceeding
The 13th UBAYA International Annual Symposium on Management
MARKET INTEGRATION IN ASEAN:
SUSTAINABLE GROWTH AND CROSS CULTURAL ISSUES Editors:
Dudi Anandya, PhD. Edithia Ajeng P, SE.
Phan Thi Hong Xuan, Prof. PhD. Nguyen Ngoc Tho, PhD.
Do Hoang Phuong An, M.A. Reviewers:
Candra S. Chayadi, Ph.D. (School of Business, Eastern Illinois University) Dudi Anandya, Dr (University of Surabaya)
Joniarto Parung, Ph.D, Prof. (Universitas Surabaya) Ning Gao, Ph.D. (Manchester Business School)
Wahyu Soedarmono, Ph.D. (Research Analyst, the World Bank, Jakarta) Yuanto Kusnadi, Ph.D. (City of Hong Kong University)
Tran Nam Tien, Dr. Prof. (USSH, VNU-HCM) Huynh Ngoc Thu, Dr. (USSH, VNU-HCM) Tran Anh Tien, Dr. (USSH, VNU-HCM) Published by:
Department of Management, Faculty of Business & Economics, University of Surabaya
Jl. Raya Kalirungkut
Surabaya, Indonesia 60293
Phone: +62-31-2981139; Fax : +62-31-2981239
University of Social Sciences and Humanities, Vietnam National University Ho Chi Minh City, Vietnam
10-12 Dinh Tien Hoang, Ben Nghe Ward, District 1, HCMC Phone: (84 - 8) 38293828; Fax: (84 - 8) 38221903
ISBN (Indonesia): 978-602-73852-0-7 ISBN (Vietnam): 978-604-73-4020-0
FOREWORD
It is with deep satisfaction that I write this Foreword to the Proceedings of
THE 13TH INTERNATIONAL ANNUAL SYMPOSIUM ON MANAGEMENT (INSYMA)
held at University of Social Sciences and Humanities, Vietnam National University - Ho Chi Minh City, Vietnam, March 18 -20, 2016. The 13th Insyma aims to provide a forum for discussion among leadings academics, researchers, students, and practitioners from all over the world, experts in economic and social sciences.
The theme for INSYMA 2016 is “MARKET INTEGRATION IN ASEAN: SUSTAINABLE GROWTH AND CROSS CULTURAL ISSUES”. This theme represent emerging and highly challenging and opportunities area of research and practice. There has been tremendous number of researchers investigating the impact of market integration and cultural impacts on economy on several communities. Mainly they found a positive impact on the economic growth as a result on significant increasing of trading for products and services in its country member. Nevertheles, market disstabilization is still main disadvantage of the regional integration. Regional community needed to developed the new model of market integration system that could minimize the disadvantages.
Hundreds of scientific papers are sent to the conference commitees in Indonesia and in Vietnam, and the results of a rigorous selection of 160 selected. This paper is derived from a variety of authors, both within and outside Indonesia and Vietnam, academics and practitioners. All the articles are then presented at the symposium and documented in this proceedings.
We thank all authors, participants, sponsors and co-hosts for their contributions and we hope that these proceedings can contribute to the development of science and business practices. Hopefully you can enjoy and gain valuable lessons from this article collection.
CONTENTS
FOREWORD ... iii CONTENTS ... v
FINANCE & ACCOUNTING
1. RISK TAKING AND PROFITABILITY: EVIDENCES FROM INDONESIA
Abdul Mongid, Muazaroh ... 3 2. CAPITAL ADEQUACY RISK AND SYSTEMIC RISK: AN EFFORT TO
ANTICIPATE BANKING CRISIS WITH SYSTEMIC IMPACT
Alfiana ... 17 3. CD INDEX, A NEW METHODS FOR MEASURING BANKING CRISIS
Amir Ambyah Zakaria, Musdholifah ... 33 4. THE EFFECT OF GOOD CORPORATE GOVERNANCE TO STOCK
RETURN IN INDONESIAN MOST TRUSTED COMPANY FOR 2006 – 2013 PERIOD
Andreas Kiky, Michael Chris Ardhitya ... 46 5. THE DETERMINANT OF INDONESIA’S ISLAMIC RURAL BANKING
RISK TAKING
Anggraeni ... 56
6. FREEDOM OF CONTRACT: RISK MANAGEMENT PRACTICES IN
MANAGING FRANCHISE BUSINESS
Aris Armuninggar ... (Abstract only)
7. BUSINESS STUDENT’S FINANCIAL LITERACY IN SURABAYA: ARE
THEY GOOD ENOUGH?
Aulia Imiaf ... (Abstract only)
8. THE IMPACT OF TRADE LIBERALISATION ON THE ECONOMIC PERFORMANCE OF ASEAN COUNTRIES
Awan Setya Dewanta ... 70 9. FINANCIAL PERFORMANCE IMPACTS OF CORPORATE
ENTREPRENEURSHIP
Bertha Silvia Sutejo ... 85 10. FRAMING EFFECT TO INVESTOR REACTION BASED ON GENDER
PERSPECTIVE: AN EXPERIMENTAL STUDY
11. THE INFLUENCE OF ENVIRONMENTAL MANAGEMENT ACCOUNTING TOWARD THE COMPANY PERFORMANCE AND STAKEHOLDERS
Candra Sinuraya ... 111 12. GENDER COLLABORATION ROLE IN ANALYZING AND
MANAGING RISKS AT BODY REPAIR “X” IN MALANG
Debby Andriani, Fidelis Arastyo Andono ... 120 13. A SIMPLE STRESS TEST ON INDONESIAN ISLAMIC
BANKING INDUSTRY
Dece Kurniadi, Sutan Emir Hidayat ... 135 14. THE INFLUENCES OF INVESTMENT OPPORTUNITIES AND
PROFITABILITY ITS POLICIES DIVIDEND AT LQ45 COMPANY
Dede Hertina ... 153 15. INVESMENT OPPORTUNITY SET BASED INDUSTRIAL GROWTH IN
INDONESIAN MANUFACTURE
Eka Handriani ... 169 16. ILLIQUIDITY, MARKET CHARACTERISTIC AND STOCK RETURN (A
STUDY AT INDONESIA STOCK EXCHANGE)
Erman Denny Arfinto, Putri Nur Rositawati ... 188 17. THE EFFECT OF CORPORATE GOVERNANCE MECHANISM ON
FINANCIAL PERFORMANCE WITH AGENCY COST AS INTERVENING VARIABLE
Finda Selli Anditya, Sutrisno ... 201 18. BANKING INTEGRATION AMONG EMERGING AND DEVELOPED
MARKET COUNTRIES: EVIDENCE FROM SOUTH EAST ASIA
Ghalih R Viratama, Harjum Muharam ... 215 19. IMPACT OF INTERNAL AND EXTERNAL FACTORS ON STOCK
RETURN IN INDONESIA STOCK EXCHANGE
Gusni ... 229 20. THE EXAMINING CAPITAL STRUCTURE DETERMINANTS:
EMPIRICAL ANALYSIS OF REGIONAL DEVELOPMENT BANKS IN INDONESIA
Hamdi Agustin, Detri Karya, Suyadi ... 252 21. ANALYSIS OF FACTORS AFFECTING THE PREDICTING
BANKRUPTCY PRIVATE BANKS IN INDONESIA
Hasrizal Hasan , Hamdi Agustin, Eva Sundari, Yul Efnita ... 266 22. THE EFFECT OF ENTERPRISE RISK MANAGEMENT DISCLOSURE
INDONESIAISTOCK EXCHANGE)
Ifada Diah Ayu Rizka, Zaenal Arifin ... 277 23. ANALYSIS OF FACTORS AFFECTING THE CAPITAL STRUCTURE IN
INDONESIA STOCK EXCHANGE
Indira Kurniasari, Werner R. Murhadi, Mudji Utami ... 290 24. STUDY OF FINANCIAL LITERACY ON MAGISTER MANAGEMENT
XTUDENTS: DEMOGRAPHIC REVIEW (not abstract)
Rr. Iramani ... 299 25. ASYMMETRY INFORMATION AND CREDIT RISK EFFECT ON LOAN
PRICING IN ASIA PACIFIC
Ivana Alim, Deddy Marciano, Liliana Inggrit Wijaya ... 312 26. ANALYSIS OF THE DAY OF WEEK EFFECT, WEEK FOUR EFFECT,
ROGALSKY EFFECT, AND JANUARY EFFECT ON STOCK RETURN IN INDONESIA STOCK EXCHANGE
Kartini, Meilya Dian Santika ... 326
27. PERFORMANCE AND RISK ANALYSIS BETWEEN JAKARTA ISLAMIC INDEX AND LQ45
Luluk Kholisoh, Sulistyani Rahmah Indah, Untara ... (Abstract only)
28. THE EFFECT OF INTERNATIONALIZATION TO RISK IN
INDUSTRIAL MANUFACTURING COMPANY THAT LISTED ON THE INDONESIA STOCK EXCHANGE 2010-2014 PERIOD
Mechiko, Deddy Marciano, Arif Herlambang ... 344 29. BIAS REPRESENTATIVENESS WITH TREND AND SEQUENCES
APPROACH: THE OVERVALUE/UNDERVALUE, MOMENTUM AND REVERSAL RETURN TEST
Putu Anom Mahadwartha, Bertha Silvia Sutejo ... 359 30. RISK MANAGEMENT IN INDONESIA TO CREATE HEALTHY
COMPANY IN ASEAN ECONOMIC COMUNITY
Rosemarie Sutjiati ... 383
31. FINANCIAL LITERACY STUDY OF MAGISTER MANAGEMENT
STUDENTS: DEMOGRAPHIC REVIEW
Rr. Iramani ... (Abstract only)
32. CORPORATE GOVERNANCE AND FIRM PERFORMANCE: THE MODERATING ROLE OF INVESTMENT
Siti Puryandani, Hartati Hadady ... 394 33. FINANCIAL PERFORMANCE ANALYSIS OF PRE AND POST
MERGER ON INDONESIAN COMMERCIAL BANK WHICH REGISTERED ON INDONESIAN STOCK EXCHANGE
34. ANALYSIS OF READINESS FOR ISA (INTERNATIONAL STANDARD AUDITING) BASED IN AUDIT PLANNING (CASE STUDY AT LOCAL PUBLIC ACCOUNTANT “X” IN SURABAYA)
Steffi Sunur, WiyonoPontjoharyo, Senny Harindahyani ... 430 35. MEASUREMENT OF ISLAMIC BANK HEALTH USING SHARIA
COMPLIENCE ANDIPERFORMANCE
Sutrisno, R. Agus Basuki ... 450 36. INTELLECTUAL CAPITAL DISCLOUSURE AND FIRM VALUE: AN
ANALYSIS WITH NON RECURSIVE MODEL
Toni Heryana ... 461
37. THE NEW CORPORATE GOVERNANCE MEASUREMENT AND ITS IMPACT ON FIRM VALUE
Ulil Hartono, Musdholifah ... (Abstract only) 38. REAL EXCHANGE RATE MISALIGNMENT AND CURRENCY CRISIS:
CASE OF INDONESIA
Unggul Heriqbaldi ... (Abstract only)
39. THE INFLUENCE OF ENTERPRENEURSHIP ON FINANCIAL
PERFORMANCE MEDIATED BY NON-FINANCIAL PERFORMANCE
Uswatun Hasanah, Saniman, Faidal ... 487 40. THE ROLE OF CORPORATE GOVERNANCE IN FAMILY CONTROL
FIRMS: EVIDENCE FROM INDONESIA
Yie Ke Feliana, Suwenda Liantina ... 499 41. E-PAYMENT SYSTEMS IN SUPPORT ONLINE TRANSACTIONS
(USER CASE STUDIES OF E-PAYMENT SERVICES IN MAKASSAR)
Zikra Supri, Andi Rahmatullah Mangga, Mediaty ... 510
HUMAN RESOURCES
42. THE EFFECT OF COMMITMENT CAREER TO THE SUCCESSFUL CAREER WITH EMOTIONAL PERCEPTION AS VARIABLE MODERATOR AT PT. PJB PUSAT SURABAYA
Aninda Tri Cahyaningrum, M.E Lanny Kusuma Widjaja ... 525 43. THE INFLUENCE OF THE ISLAMIC BUSINESS ETHICS AND
SPIRITUAL INTELLIGENCE OF ISLAMIC LEADERSHIP AND PERFORMANCE MANAGER SHARIA BANK IN SURABAYA
A Rochim Sidik ... 546
44. EVALUATION OF EFFECTIVENESS ON DESIGN THINKING METHOD
FOR THE DERGRADUATE STUDENTS(CASE STUDY ON
UNIVERSITY)
Annisaa Novieningtyas, Triyana Iskandarsyah,
Rizka Nugraha Pratikna, Ivan Prasetya Tanimukti ... 562 45. OPTION-BASED MODEL AND PROJECT-BASED CAREER MODEL
AFFECT EMPLOYEE’S INTENTION TO STAY IN
PROFESSIONAL SERVICES ORGANIZATION: KNOWLEDGE AND SKILLS AS MODERATOR
Bagus Suripto, Gugup Kismono ... 575 46. THE IMPACT OF KKNI (INDONESIAN QUALIFICATION NETWORK)
IMPLEMENTATION TO HIGHER EDUCATION GRADUATES’ QUALITY: A STUDY OF UNDERGRADUATE ALUMNI AT TANGERANG, BANTEN
Dewi Wahyu Handayani, Anthony Halim ... 598 47. ORGANISATIONAL CHANGE IN PUBLIC SERVICE:
DECONSTRUCTING SECTORIAL EGO IN PUBLIC COLLABORATION
Dian Ekowati ... 617 48. WORKLOAD ANALYSIS FOR GOOD HUMAN RESOURCE PLANNING
AT FACULTY Y IN UNIVERSITY X
Endang Ernawati, Elsye Tandelilin ... 635 49. THE APPLICATION OF INTERNAL CONTROL FOR THE WOMEN
COOPERATIVE PERFORMANCE IN EAST JAVA
Eni Wuryani, Dewi Prastiwi ... 649 50. THE INFLUENCE OF THE QUALITY OF WOMEN’S COOPERATIVE
PERFORMANCE TO GOOD CORPORATE GOVERNANCE (STUDI ON WOMEN’S COOPERATIVES IN EAST JAVA)
Erlina Diamastuti, Ni Nyoman Alit Triani ... 661 51. SUSTAINABLE GROWTH AND ETHICS A STUDY OF BUSINESS
MANAGEMENT STUDENTS IN SURABAYA
Erna Andajani ... 674 52. REPUTATION ORGANIZATION DEVELOPMENT MODEL TO CREATE
COMPETITIVE ADVANTAGE – A CASE STUDY IN TRANSMEDIA
Indrianawati Usman ... 682 53. PERFORMANACE MANAGEMENT APPROACH AS THE BEST
CHOICE IN THE IMPLEMENTATION OF INDONESIAN NATIONAL QUALIFICATIONS FRAMEWORK
Joseph L. Eko Nugroho ... 693 54. ORGANIZATIONAL HEALTH AS A CORPORATE CULTURE AND
FOUNDATION OF ORGANIZATIONAL DEVELOPMENT
55. ANALYSIS OF JOB COMPETENCIES ADVERTISED IN NEWSPAPERS AND THE CURRICULUM OF MANAGEMENT DEPARTMENT OF A SCHOOL OF BUSINESS
Laila Saleh Marta ... (Abstract only) 56. EMPLOYER BRANDING AND THE MEANING OF WORKING THEIR
EFFECTS ON WORK PLAVE PREFERENCE - A COMPARATIVE STUDY ON WORK PERCEPTION BETWEEN LOCAL WORKERS AND EXPATRIATES WORKING WITHIN LOCAL AND MULTINATIONAL FIRMS IN BANDUNG AND EXTENDED AREAS
Maman Kusman, Dwinto Martri Aji Buana, Nugroho Hardiyanto ... (Abstract only)
57. COMPARISON OF CULTURAL VALUES IN THREE INDONESIAN SUB-CULTURES
Mirwan Surya Perdhana, Devia Arda... 717 58. INFLUENCE OF WORK FAMILY CONFLICT, JOB SATISFACTION,
AND TURNOVER INTENTION – THE CASE OF CV. STAR INTERNATIONAL
Mochamad Rizki Sadikin, Debby Ulfah ... 726 59. THE EFFECT OF INVOLVEMENT OF WORK AND DEMANDS OF
WORK ON WORK-FAMILY CONFLICT WITH THE SOCIAL SUPPORT AS A MODERATING VARIABLE EMPLOYEES
Ninin Prastiwi, Dwiarko Nugrohoseno ... 734
60. THE ROLE OF MANAGEMENT SUPPORT ON CORPROATE ENTREPRENEURSHIP AND EMPLOYEE WORK OUTCOME
Nuri Herachwati, Yohana Dewi Anggur ... (Abstract only)
61. ASEAN ECONOMIC COMMUNITY IMPACT TO SOCIO-CULTURE TO INDONESIA BORDER AREA RIAU STATE
Nurman, Detri Karya, Zulkifli Rusby, Evizal Abdul Kadir ... 756 62. CONTRIBUTION LANGUAGE (ENGLISH) AND CULTURE TO
MARKET INTEGRATION IN ASEAN
Seno H Putra, Desy Mardianti ... 768 63. THE INFLUENCE OF MOTIVATION AND WORK ENVIRONMENT TO
LECTURER PERFORMANCE IN BATAM CITY
Sri Langgeng Ratnasari ... 773 64. THE IMPACT OF WORK FAMILY CONFLICT TOWARDS THE
EMPLOYEE PERFORMANCE OF DEPARTMENT OF FORESTRY AND ESTATE CORPS IN BATANG REGENCY, CENTRAL JAVA, WITH THE JOB SATISFACTION AS THE INTERVENING VARIABLE
65. ANALYSIS OF FACTORS AFFECTING THE INFORMATION TECHNOLOGY USER PERFORMANCE IN MAKASSAR GOVERNMENT’S PUBLIC BANKS
Suhartono, Dewi Arvini Wisudawaty, Grace T. Pontoh ... 795 66. CONCEPTUAL REVIEW ON THE NEEDS FOR COMPREHENSIVE
INTEGRATED CASE STUDIES OF ORGANIZATION DEVELOPMENT, WHICH SUPPORT TALENT DEVELOPMENT
AND LEADERSHIP PROGRAM
T. Soemarman ... 812 67. JOB AUTONOMY, SELF-EFFICACY, JOB PERFORMANCE AND
RESISTANCE TO CHANGE (EMPIRICAL STUDY ON EMPLOYEE PT. UNITED WARU BISCUIT MANUFACTORY SIDOARJO)
Tri Siwi Agustina, Nidya Ayu Arina ... 833 68. ASEAN ECONOMIC COMMUNITY CHALLENGING AND
OPPORTUNITY FOR INDONESIAN GRADUATE
Zulkifli Rusby, Nurman, Hasrizal Hasan, Evizal Abdul Kadir ... 848
MARKETING
69. THE EFFECT OF BRAND EQUITY ON PURCHASE INTENTION AND ITS IMPACT ON PURCHASE DECISION (CASE STUDY: MITSUBISHI MIRAGE BRAND)
Aam Bastaman, Ilmi Dimas Rahma Pradana ... 863
70. ANTECEDENTS AND CONSEQUENCE OF CUSTOMER SATISFACTION IN GLOBAL FAST FOOD RESTAURANT Anas Hidayat, Aulia Arifatu Diniyya,
Muhammad Saifullah, Asmai Ishak ... (Abstract only)
71. DOES MESSAGE FRAMING MATTER? THE ROLE OF MESSAGE FRAMING AND INVOLVEMENT IN INFLUENCING ATTITUDES AND RESERVATION PRICE TOWARD ORGANIC PRODUCTS
Andhy Setyawan ... 886 72. THE IMPACT OF INSTITUTIONAL IMAGE AND STUDENT
SATISFACTION ON ATTITUDINAL AND BEHAVIORAL LOYALTY – THE CASE OF UNIVERSITAS TERBUKA
Andy Mulyana, Devi Ayuni ... 895 73. THE CONSUMER INTEREST OF KEDAI MANGKOK MANIS
BANDUNG: A STORE ATMOSPHERE PERSPECTIVE
Ayuningtyas Y. Hapsari ... 905 74. THE IMPACT OF FAIRNESS ON SERVICE RECOVERY
ON PEMALANG BRANCH OF CENTRAL JAVA
Chandra Arief Mauriat, Budi Astuti ... 917 75. ACHIEVING STUDENTS LOYALTY THROUGH QUALITY OF
SERVICES, STUDENTS SATISFACTION, AND REPUTATION
Devi Ayuni, Andy Mulyana ... 930 76. EFFECT OF LOW-PRICE AND HIGH-PRICE PRODUCTS DEPTH AND
PROMOTION OPTIONS ON MESSAGE FRAMING AND NOMINAL PERCENTAGE DISCOUNT
Dian Ambarwati, Dudi Anandya, Indarini ... 943 77. CAUSE RELATED MARKETING: THE IMPORTANCE OF
BRAND ENGAGEMENT TO WIN THE COMPETITION IN ASEAN ECONOMIC COMMUNITY
Dorien Kartikawangi, Avianto Nugroho ... 950 78. EFFECT OF PRODUCT INNOVATION, CORPORATE IMAGE AND
QUALITY OF SERVICE TO CONSUMER SATISFACTION AND LOYALTY CATERING CUSTOMERS IN SURABAYA
Eny Rochmatulaili ... 968 79. MAYOR’S PERSONAL BRAND ACCELERATES THE EMERGENCE OF
CITIZEN’S BRAND ATTITUDE
Eriana Astuty, Sri Astuti Pratminingsih ... 984 80. THE EFFECT OF LOYALTY FORMING FACTORS AMONG VISITOR
AT BANDUNG CULINARY TOURISM
Etik Ipda Riyani, Devi Ayuni, Andy Mulyana ... 994 81. IMPLEMENTATION OF E-COMMERCE ON THE USE OF
GOJEK SERVICE IN MAKASSAR
Fajriani Azis, Nurlaila Hasmi, Mediaty ... 1011 82. ANALYSIS INTENTION TO USERS OF ONLINE SHOPPING ON
E-COMMERCE: REVIEW OF THEORY OF PLANNED BEHAVIOR
Grace T. Pontoh, Ibrahim, Satriani ... 1029 83. GENDER DIFFERENCES ON THE RELATION OF
SATISFACTION-LOYALTY
Gregorius Stanley Pratomo, Christina Rahardja Honantha,
Liliana Inggrid Wijaya ... 1047 84. MARKETING ANALYSIS, EXPERIENTIAL AND MARKETING
CUSTOMER RELATION TO REALIZE CUSTOMER VALUE, AND IMPLICATIONS FOR CUSTOMER LOYALTY
(SURVEY ON CUSTOMER STAR HOTELS 3, 4, AND 5 IN BANDUNG AREA)
85. ANALYSIS OF FACTORS QUALITY OF SERVICE E-COMMERCE AND ITS EFFECT ON CUSTOMER LOYALTY (SURVEY ON E-COMMERCE CUSTOMER IN WEST JAVA)
Heppy Agustiana Vidyastuti ... 1101 86. THE IMPACTS OF TRI HITA KARANA AWARD ON HOTEL ROOM
RATES PERFORMANCE: AN EXAMINATION OF ITS APPLICATIONS ON HOTELS IN BALI BASED ON SEASONS AND RESORT AREAS
I Ketut Surata, I Nyoman Sudiksa, Ida Bagus Made Wiyasha ... 1129 87. THE IMPLEMENTATION OF THE STAKEHOLDER PERSPECTIVE TO
SUPPORT SUSTAINABILITY ACTIVITIES AND THE ENABLING FACTORS
Iin Mayasari, Devi Wulandari, Iyus Wiadi, Anita Maharani ... 1151 88. THE EFFECT OF COUNTRY OF ORIGIN IMAGE ON BRAND EQUITY
THROUGH THE MEDIATION OF BRAND ASSOCIATIONS, BRAND LOYALTY AND BRAND AWARENESS ON LG AIR CONDITIONER (AC) IN SURABAYA
Ivana Haryanto, Silvia Margaretha, Dudi Anandya ... 1177
89. ARE GENDER AND ETHNICITY MATTER IN IMPULSIVE BUYING BEHAVIOUR? A STUDY ON YOUNG ADULT CONSUMERS IN AUSTRALIA AND INDONESIA
Made Pranadatha Gunawan, Mahestu N Krisjanti ... (Abstract only)
90. PASSPORT SERVICE QUALITY DEVELOPMENT BASED E-GOVERNMENT (E-PASSPORT) ON SATISFACTION USERS
Mediati, Purnama Sari, Kartini, Muslimin ... 1191 91. THE INFLUENCE OF CORPORATE SOCIAL RESPONSIBILITY
AND SERVICE QUALITY TO PURCHASE INTENTION IN ISLAMIC BANKING
Muchsin Muthohar, Merlin Rahmawati ... 1206 92. EFFECT OF COUNTRY OF BRAND TO
QUALITY PERCEPTION AND BRAND TRUST
Muhammad Hasbi Zaidi, Nurman, Azmansyah ... 1218 93. THE INFLUENCE OF CREATIVITY, PRODUCT
INNOVATION,CUSTOMERS RELATIONSHIP MANAGEMENT TO THE PRICE DETERMINATION WHICH GRABS THE SUCCESS (THE
RESEARCH ON SMALL MEDIUM BUSINESS UNITS (UKM) OF BATIK IN CENTRAL JAVA AND D.I. YOGYAKARTA PROVINCES)
R. Adjeng Mariana Febrianti ... 1233 94. ATTITUDE TOWARDS CIGARETTE ADVERTISEMENT
95. CRITICAL ANALYSIS ON MARKETING ACTIVITIES OF MUSEUMS IN BALI
Rizal Hari Magnadi... (Abstract only)
96. THE IMPACT OF THE QUALITY OF INTRINSIC AND EXTRINSIC ATTRIBUTES IN CREATING LOYALTY AND PURCHASE INTENTION
Sofiana Dewi, Albari ... 1262 97. DOES SOCIAL ADVERTISING IN TWITTER AND
FACEBOOK WORK DIFFERENTLY?
THE ROLE OF PROFIT ORIENTATION OF THE ORGANIZATION
Sony Kusumasondjaja ... 1278 98. ANALYSIS OF INTERNET BANKING BASED ON RISKS, BENEFITS,
AND SIMPLICITIES ON THE CUSTOMERS TRUST
Sri Nirmala Sari, Juniaty Ismail, Grace T. Pontoh ... 1287 99. DETERMINANTS OF BRAND PRODUCTS SWITCHING ON
SMARTPHONE (CASE STUDY ON WIDYATAMA UNIVERSITY)
Sri Wiludjeng SP, Rudi Gunawan ... 1300 100. INFLUENCE ON AWARENESS, PERCEIVED QUALITY,
UNIQUENESS, SOCIAL IMAGE, AND HOME COUNTRY ORIGIN TO PRICE PREMIUM AND LOYALTY ON
HÄAGEN DAZS PREMIUM PACKAGED ICE CREAM
Sutrisno Hamdany, Indarini, Dudi Anandya ... 1309 101. THE INFLUENCE OF SERVICE QUALITY AND TRUST ON LOYALTY
CONSUMER OF CICENDO EYE HOSPITAL PERIOD 2014
Taufik Rachim, Adam Apriyadi Putra ... 1324 102. STUDENT INTEREST TO PRESERVE DRAGON AND LION
TRADITIONAL DANCE (AN INTERNAL FACTOR
AND IMAGE OF BANDUNG SANTO CLUB PERSPECTIVE)
Tezza Adriansyah Anwar, Galuh Boga Kuswara ... 1332 103. THE EFFECT SERVICE QUALITY AND CORPORATE IMAGE
ON LOYALTY WITH CUSTOMER TRUST AS A MODERATOR: A STUDY IN A PRIVATE UNIVERSITY
Yasintha Soelasih, Efendi... 1341 104. EFFECT ATTRIBUTES SERVICES TO SATISFACTION USER
SERVICES AND ITS IMPACT ON WORD OF MOUTH
(STUDIES IN WIDYATAMAUNIVERSITY BANDUNG - INDONESIA)
Yenny Maya Dora ... 1349 105. THE INFLUENCE OF CUSTOMER RELATIONSHIP MANAGEMENT
AT PT.BERJAYA ABADI TOUR AND TRAVEL)
Zulganef, Sri Astuti Pratminingsih, Santy Hepty Hexiawaty ... 1373
OPERATION
106. IMPROVING SERVICE QUALITY OF SECRETARIAL AND OFFICE MANAGEMENT STUDY PROGRAM,
FACULTY OF VOCATIONAL, UNIVERSITAS AIRLANGGA BY INTEGRATING MATRIX IMPORTANCE PERFORMANCE ANALYSIS AND FISHBONE DIAGRAM
Febriana Wurjaningrum, Ida Setya Dwi Jayanti ... 1385 107. PERBAIKAN KUALITAS LAYANAN “CALL CENTER”
MENGGUNAKAN METODE “DMAIC” DAN “SERVICE BLUEPRINT”
Fino Wahyudi Abdul, Nining P. ... 1401 108. RESTAURANT ATTRACTIVENESS AND PSYCHOLOGICAL EFFECT
OF UPLOADING FOOD PICTURE ON INSTAGRAM TO WILLINGNESS TO DINE OUT
Hanz Christianto, Siti Rahayu, Prita Ayu Kusumawardhany ... 1416 109. RISK AND MITIGATION ANALYSIS OF SUPPLY CHAIN WITH
HOUSE OF RISK APPROCH FOR A BUSINESS IN FREE TRADE ERA
Indrianawati Usman, Rudati Ariani ... 1430 110. THE FOOTWEAR SMES VALUE ORCHESTRATION IN MOJOKERTO
Juliani Dyah Trisnawati ... 1442 111. IMPROVING QUALITY OF SERVICES USING IMPLEMENTATION
OF QFD TO WIN MARKET COMPETITION
Ratna Widiastuti... 1449 112. SUPPLIER SELECTION USING ANALYTICAL HIERARCHY PROCESS
IN PT PELITA MEKAR SEMESTA
Sharon Audrey Madeline Vriso, Stefanus Budy Widjaja, A. Budhiman S. ... 1456 113. THE EFFECTS OF DINING ATMOSPHERICS ON BEHAVIORAL
INTENTIOS THROUGH SERVICE QUALITY AND FOOD QUALITY IN GOJUMONG RESTAURANT SURABAYA
Shelli Rustam Moidady, Fitri Novika Widjaja, Dudi Anandya... 1462 114. THE EFFECT OF SUPPLY CHAIN MANAGEMENT PRACTICES ON
PERFORMANCE OF SMEs IN YOGYAKARTA
Siti Nursyamsiah, Ninoury Ardaiva ... 1474 115. MOTIVATION OF STUDENTS IN HOSPITALITY AND TOURISM
MANAGEMENT PROGRAMS
116. THE IMPLEMENTATION OF SEVEN QUALITY MANAGEMENT TOOLS: EXPERIENCES FROM THREE ENTERPRISES
IN EAST JAVA, INDONESIA
Stefanus Budy Widjaja, Anthonius Budhiman Setyawan... 1503 117. IMPLEMENTATION OF QUALITY CONTROL
BY USING PDCA AND STATISTICS TOOLS
IN BREAD STORES OLIVIA BAKERY AT MOJOKERTO
Steven Anggriawan, Stefanus Budy Widjaja, Prita Ayu Kusumawardhany ... 1516 118. THE DEVELOPMENT OF EDUCATIONAL TOURISM
IN THE AREA OF MOUNT PENANGGUNGAN THROUGH COMMUNITY EMPOWERMENT Veny Megawati,Edna Sri Redjeki, Gunawan,
Yoan Nursari Simanjuntak, Nanang Krisdinanto ... 1531 119. GREEN COMPANIES SCORECARD
Zainur Hidayah ... 1543
STRATEGIC & ECONOMICS
120. E-ASEAN JOB AS STRATEGY TOWARDS FREE LABOUR MARKET IN ASEAN ECONOMIC COMMUNITY (CASE STUDY INDONESIA)
Alfina Rahmatia, Resky Izzati Afiah, Nida’ Al-Ulfah Untoro ... 1557
121. AN ANALISYS WORLD OIL PRICE MOVEMENTS AND THE G7 CAPITAL MARKETS
Dian Surya Sampurna ... (Abstract only)
122. BUILDING ASEAN EXCHANGE RATE UNIT (AERU)
FOR MONETARY INTEGRATION IN ASEAN-5 COUNTRIES Dimas Bagus Wiranatakusuma, Masyhudi Muqorobin,
Imamudin Yuliadi, Alif Supriyatno ... 1569 123. THE ANALYSIS OF FACTORS INFLUENCING DEMAND
FOR IMPORTED COFFEE MALAYSIA FROM INDONESIA 1993-2013
Eko Atmadji, Afik Beny Adam ... 1601 124. THE EFFECT OF CORPORATE SOCIAL RESPONSIBILITY
ON COMPANY REPUTATION AND MARKET RISK
Fitri Ismiyanti ... 1612
125. INTERNATIONAL BUSINESS RELATION OF EMERGING INDONESIA WITH ASIAN NEIGHBOURS
126. ASEAN ECONOMIC COMMUNITY (AEC) AND ECONOMIC STABILITY: A REVIEW FROM INDONESIA’S SIDE
Hersugondo, Robiyanto, Gatyt Sari Chotijah ... 1629 127. BUSINESS STRATEGY ANALYSIS AND IMPLEMENTATION
TO WIN COMPETITION (CASE STUDY AT SSM)
Idris Gautama So, Fransisca Chatarina, Natalia ... 1638 128. ANALYSIS OF THE STRATEGY TO DEVELOP THE OLD TOWN
ARRANGEMENT (SUNDA ETHNIC) USING THE CONCEPT OF THE NEW CITY IN BANDUNG WEST JAVA
Keni Kaniawati ... 1647 129. DRIVERS OF COUNTRY’S EXPORT PERFORMANCE
Masmira Kurniawat ... 1662 130. IMPROVING COMPETITIVENESS OF MICRO AND SMALL BUSINESS
PRODUCT FACING GLOBAL MARKET (CASE ON MICRO AND SMALL BUSINESS FOOD AGROINDUSTRY IN GIANYAR REGENCY)
Ni Wayan Sukartini, Ni Ketut Lasmini, Ni Made Sudarmini ... 1670 131. TIERED SME TRAINING IN SURABAYA: STRATEGY FOR
STRENGTHENING SME COMPETITIVENESS TO FACE MARKET INTEGRATION IN ASEAN
Noviaty Kresna Darmasetiawa ... 1681 132. ACCELERATING ECONOMIC DEVELOPMENT IN SURABAYA CITY
TOWARDS ASEAN SINGLE MARKET
Nurul Istifadah ... 1691 133. CORPORATE SOCIAL RESPONSIBILITY AND CULTURE: THE
STUDY IN HOSPITALITY Nyoman Indah Kusuma Dewi,
I Gusti Agung Bagus Mataram, I Wayan Siwantara ... 1702 134. THE ROLE OF THE STATE MANAGEMENT IN THE LABOR EXPORT
IN SOUTHEAST ASIAN NATIONS TOWARDS THE ASEAN VISION 2025 (THE CASE-STUDYOF LABOR EXPORT IN VIETNAM
AND THE ASEAN COUNTRIES)
Phan Thi Hong Xuan ... 1712 135. CHARACTERISTICS AND IDENTIFICATION OF
OBSTACLES FACED SMES, BASED SWOT ANALYSIS IN MALANG (CENTER FOR STUDIES IN INDUSTRIAL CERAMICS DINOYO)
Ririt Iriani Sri Setiawati, Tri Mujoko ... 1723 136. ANALYSIS THEORY OF SPECIALTY AS A STEP IN ACCELERATING
ECONOMIC COMMUNITY (AEC) (CASE STUDY IN INDONESIA)
Sumandi, Farhan Fabilallah, Heni Rahmawati, Mia Rosmiati ... 1730 137. REGIONAL TOURISM DEVELOPMENT STRATEGY
(STUDIES ON DEVELOPMENT OF LOCAL GOVERNMENT TOURISM MADIUN COUNTY)
Tatik Mulyati, Saraswati Budi Utami, Choirum Rindah Istiqaroh ... 1752 138. BUSINESS DEVELOPMENT OF SMALL AND MEDIUM ENTERPRISES
(SMEs) IN THE CREATIVE INDUSTRY IN SUPPORTING REGIONAL ECONOMIC IMPROVEMENT THROUGH GROSS DOMESTIC REGIONAL PRODUCT (GDRP) REGION IN BANDUNG
Wien Dyahrini ... 1776 139. TAX COMPLIANCE AND COMPLIANCE CONTINUUM: REVIEW OF
CONCEPTS AND SOME SUGGESTIONS FOR THE MODEL OF
COMPLIANCE MANAGEMENT IN SOUTHEAST ASIAN NATIONS IN THE CONTEXT OF ASEAN COMMUNITY
Vo Tien Dung ... 1790
VIETNAM'S ECONOMIC, SOCIAL AND CULTURAL ISSUES
IN THE ERA OF INTEGRATION
140. POST-MODERN MANAGEMENT
AND MANAGEMENT CULTURE IN EAST ASIA
Nguyen Ngoc Tho ... 1801 141. ORGANIZATIONAL DEVELOPMENT
Nhor Sanha ... 1817 142. SOME ISSUES RELATED TO THE CONSTRUCTION OF
REGIONAL IDENTITIES IN THE DEVELOPMENT OF ASEAN COMMUNITY FROM CROSS-CULTURAL PERSPECTIVES
Tran Thi Thu Luong ... 1838 143. CROSS-CULTURAL MANAGEMENT AND EXCHANGES IN THE
VIETNAMESE HIGHER EDUCATION IN THE INTEGRATION ERA
Nguyen Duy Mong Ha ... 1851 144. EXPANDING THE ROLE OF UNOFFICIAL CULTURAL INSTITUTIONS
IN THE CULTURAL ACTIVITIES
Ngo Van Le ... 1858 145. RAISING THE AWARENESS OF SOUTHEAST ASIAN IDENTITY
IN REALIZING THE ASEAN COMMUNITY
146. CONSTRUCTING THE ASEAN POLITICAL-SERCURITY COMMUNITY THEORETICAL AND PRACTICAL PERSPECTIVE
Tran Nam Tien ... 1881 147. UNIVERSITIES AND ENTERPRISES: SUSTAINABLE COOPERATION
IN TRAINING AND RECRUITING QUALITY HUMAN RESOURCES IN THE ERA OF INTEGRATION AND DEVELOPMENT
Nguyen Nhu Binh ... 1895 148. PERCEPTION OF VIETNAMESE FEMALE SEX WORKERS ON
QUALITY OF CARE IN CERVICAL CANCER SCREENING
Le Thi Ngoc Phuc ... 1911 149. NEAKTA BELIEF IN THE SOUTHERN KHMER CULTURE:
TRANSFORMATION FROM STONE TO HUMAN FIGURES
Phan Anh Tu ... 1924 150. THE VIETNAMESE RELIGIOUS BELIEF OF FOUR DAI CAN LADIES
(TỨ VỊ ĐẠI CÀN NƯƠNG NƯƠNG) IN SOUTHWESTERN VIETNAM – A CASE STUDY OF DIEU HOA COMMUNAL HOUSE
(MY THO, TIEN GIANG)
Nguyen Thi Le Hang, Tran Thi Kim Anh ... 1935 151. A STUDY OF THIEN HAU THANH MAU IN THE FISHERMEN
COMMUNITY IN SONG DOC (CA MAU PROVINCE)
Duong Hoang Loc ... 1947 152. THE ROLE OF EDE (RADE) WOMEN IN MARRIAGE
AND FAMILY LIFE THROUGH CUSTOMARY LAWS
Ngo Thi Minh Hang ... 1959 153. TEACHING TEOCHEW AND THE STATE OF VIETNAMESE-CHINESE
(TEOCHEW DIALECT) LINGUISTIC ADAPTATION (A CASE STUDY IN VINH HAI VILLAGE, VINH CHAU TOWN,
SOC TRANG PROVINCE)
Truong Anh Tien ... 1974 154. INCORPORATING TOURISM ACTIVITIES INTO THE VALUES OF
KHMER PEOPLE’S COMMUNITY CULTURE IN TRA VINH
Son Ngoc Khanh, Pham Thi To Thy ... 1981 155. ASEAN COMMUNITY’S IMPACTS ON MARKETS
IN SOUTHEAST VIETNAM
Le Quang Can ... 1996 156. CHALLENGES, OPPORTUNITIES, ADVANTAGES, AND
DISADVANTAGES OF VIETNAM’S TOURISM IN INTEGRATION WITH ASEAN AND ITS SOLUTIONS
157. ROLES OF INDONESIA AND VIETNAM IN SOUTHEAST ASIA’S SECURITY
Le Thi Lien ... 2012 158. COMPARING VIETNAM’S AND INDONESIA’S
CURRENT DEVELOPMENT INDICES
Nguyen Quang Giai ... 2032 159. ASEAN COMMUNITY : ADVANTAGES AND DIFFICULTIES
IN EDUCATIONAL MANAGEMENT
Nguyen Thi Huyen Thao ... 2042 160. THE ROLE OF AGRICULTURAL FESTIVALS
IN THE DEVELOPMENT OF TOURISM IN LAOS
Phan Thi Hong Xuan, Quach Dua Tai ... 2052 161. HO CHI MINH CITY’S TOURIST DESTINATION PRODUCTS
IN ASEAN INTEGRATION TRENDS THROUGH SWOT MATRIX
Nguyen Cong Hoan ... 2067 162. COLLABORATIVE DEVELOPMENT OF CULTURAL TOURISM
IN CENTRAL VIETNAM WITH SOUTHERN LAOS AND NORTHEASTERN CAMBODIA
THE 13TH UBAYA INTERNATIONAL
University of Social Sciences and Humanities - VNU-HCM,
All rights reserved. No part of this publication may be reproduced, copied, or transmitted in any forms or by any means, without the prior permission of the Authors, the Universities or the Publisher.
VNU-HCM PRESS
Quarter 6, Linh Trung Ward, Thu Duc District, Ho Chi Minh City
Block C, 10-12 Dinh Tien Hoang Street, Ben Nghe Ward, District 1, Ho Chi Minh City
Phone: (84-8) 862726361- 862726390
University of Surabaya - Indonesia
Print run 300 copies Size 14.5 x 20.5 cm
Registered No: DKKHXB No.
643-2016/CXBIPH/03-30/DHQGTPHCM
License of Publishing No. 40/QD of VNUP-HCMC
on March 11th, 2016.
Printed by Hung Phu Printing and Packaging Co. Ltd. Add. 162A/1, Quarter 1A, AnPhu Ward,
ISBN (Indonesia): 978-602-73852-0-7 1047
GENDER DIFFERENCES ON
THE RELATION OF SATISFACTION-LOYALTY
Gregorius Stanley Pratomo Christina Rahardja Honantha
Liliana Inggrid Wijaya
Faculty of Business and Economics Universitas Surabaya
[email protected], [email protected], [email protected]
Abstract
Indonesia is one of developing countries which also followed by the presence of the retail business and industries, especially for textile and clothing industry. The fact that retail industry affects the behavior and way of thinking in Indonesian society especially on the relation of satisfaction on loyalty became an interesting phenomenon to study. This study have the purpose to explore the phenomenon and trying to figure the heterogeneous shopping assessment in retail and how that experience may influence on consequent customer loyalty in different way.
Data processing that used in this research is Structural Equation Modeling (SEM) with software AMOS 16.0. The researcher try to analyze and elaborate each relationship of satisfaction that respondents got in experienced, in which affecting on attitudinal, behavioral loyalty, and positive word of mouth. Demographic segmentation also conducted to divide consumer segments category based on gender, then compared those consumer segments in order to know the differences on the relationship of satisfaction-loyalty in each segment.
The result shows that there are positive and significant relationships between satisfaction and loyalty dimensions. Moreover, another results shows that there are two latent segments where the strength of causal relationships are same in several causal relationship, also different in some causal relationship. The knowledge of this research may be beneficial towards store owner especially to clothing shops to create a great and memorable shopping experience for customers.
Keywords: heterogeneity shopping assessment, satisfaction, loyalty
JEL Classification: M30, M31
INTRODUCTION
people are apart from the necessities of life. It is clear that human beings are consumptive. The existence of this led to a lot of requests required by humans, so it appears actions or solutions to meet the needs of human life. One is the emergence of the retail industry in the world. According to Levy and Weitz (2009: 8) Retailing is a series of business activities to add value to goods and services sold to consumers for personal or household consumption. Retailing is all activities involving the sale of goods or services to the final consumer for use of personal nature, and not a business (Kotler and Keller, 2012: 469). An increase in demand in society spawned retail industry. With the retail industry, the public will be permitted to meet its needs for the retail industry sells various items needed by the community. Phenomenon occurs, because of the growing number of Retailers in the world, until mid of 2015 (last update 5/9/2015), the number of retailers worldwide is expected to reach approximately 8000 retailers. It‟s only counted for the head offices including Food, Fashion and Consumer Electronics and another sectors. These retailers represent over 1.6 million stores/outlets in the world. As expected, the number of retailers has grown up by time (http://www.retail-index.com/ accessed on 5/21/2015).
One of the developing countries, followed by the presence of the retail business and industries which are quite advanced is Indonesia. Trends in retail business in Indonesia, which received strong capital support growing steadily in the market, even the position has shifted traditional retail. Indonesia‟s predicate as the world's fourth largest population, as well as increased economic growth and the level of purchasing power, making Indonesia as a lucrative market in textile and clothing. It was recognized by foreign companies, so that both foreign companies and domestic companies competing to chase competent markets. The development of textile and apparel in Indonesia are also able to attract as well as an opportunity for foreign companies to offer machinery, know how, and capital. (http://www.gbgindonesia.com/ accessed on 4/27/2015).
Research related to the nature of gender differences in shopping at clothing shop (retail sector) is still rarely performed. Research degree of heterogeneity in shopping at clothing shop (retail sector) that have been done related to the tendency of consumers to make any decisions in the store buying process (Blasco et al., 2014). However, such decisions may differ from consumer behavior are assumed by Blasco et al., (2014) raised the concept of satisfaction (both affective and cognitive) will motivate consumers to more loyalty (behavioral and attitudinal) and the impact on word-of-mouth. Previous research refers to the assessment of the general shop in a heterogeneous society. Therefore, this study aimed to complement existing research gaps.
ISBN (Indonesia): 978-602-73852-0-7 1049
respondents have a level of behavioral loyalty and word-of-mouth are almost balanced but still refers to the positive direction and the majority of respondents have high levels of
affective satisfaction and cognitive satisfaction. Based on the results of preliminary
observations had been known that there are indications buyers in the clothing shop experiencing affective satisfaction and cognitive satisfaction affect the level of behavioral loyalty, attitudinal loyalty and word-of-mouth.
LITERATURE BACKGROUND
Affective satisfaction
One of the concepts mentioned regarding to Lai et al. (2005), “In affective design, affection (or „„Kansei‟‟ in Japanese) refers to consumer affective impressions or feelings about a product”. Thus, it provides an effective means to facilitate the affective mapping process and its being able to improve consumer affective satisfaction with product design. Severt (2002) stated that, satisfaction as an affective consumer condition that results from a global evaluation of all the aspects that make up the consumer relationship. Lovelock and Wirtz (1997) stated that, satisfaction as a person‟s feeling of pleasure or disappointment resulting from a consumption experience when comparing the result of a product with consumer expectations (as cited in Blasco et al., 2014). This proves that defend the convergence of both approaches, which are cognitive perspective and affective perspective. This perspective means that feeling, which is one of the affective approach is the driver of the individual emotion to measure expectation can deal with the real experience.
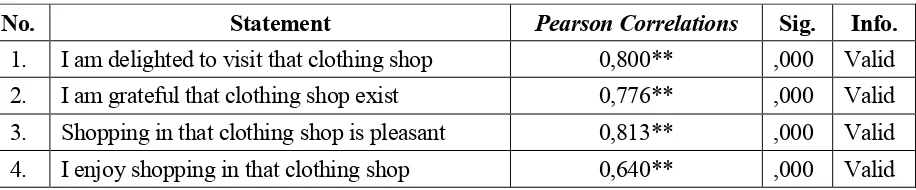
According to Blasco et al. (2014), the affective satisfaction can be measured by: SA1: I am delighted to visit this shop; SA2: I am grateful this shop exists; SA3: Shopping in this shop is pleasant; SA4: I enjoy shopping in this shop.
Cognitive satisfaction
Oliver (1997: 8) stated, “Satisfaction is the consumer‟s fulfillment responds. It is a judgement that a product/service feature, or the product or the service itself, provided (or is providing) a pleasureable level of consumption–related fulfillment, including levels of under- or overfulfillment.” The intent of this definition is the purely cognitive perspective that judgement the individual emits over the performance of the product or service.
Blasco et al. (2014), customer‟s happiness increases their satisfaction with the shop, whereas a feeling of disappointment reduces judgements of satisfaction. It means that the enhancing impact of positive or negative affect on satisfaction thus to make the valuation. J. Paul Peter and Jerry C. Olson (2005: 46) stated that the affective responses (emotions, feelings, or moods) produced by the affective system in reaction to stimuli in the environment can be interpreted by the cognitive system. Thus, the consumers‟ affective reactions (positive responses) to the environment can influence their cognition during decision making.
H1. Customer Affective Satisfaction with the establishment has a positive impact on Cognitive Satisfaction
Behavioural loyalty
According to Buttle & Burton (2002) as cited in Blasco et al., (2014), the behavioral perspective considers that customers show different levels of loyalty in relation to consumer repeat purchase behavior over time.
According to Blasco et al. (2014), the behavioral loyalty can be measured by: LC1: I often visit this shop; LC2: I often make purchases at store.
Attitudinal loyalty
Blasco et al. (2014) stated that attitudinal loyalty can be defined as an individual‟s promised behavior which entails the likelihood of future purchases or reduced likelihood of changing to another brand or service provider. The attitudinal loyalty can be measured by:LA1: I feel committed to this shop; LA2: I have a close relationship with this shop.
Word of mouth
According to Carl (2006) quoted by Blasco et al. (2014), stated that WOM or Word-Of-Mouth is one of the most significant and recognized dimensions in the loyalty literature. Moreover, Harrison-Walker (2001) and Litvin et al. (2008) stated that, the literature, generally define that WOM is about communication of customers regarding a product.
Blasco et al. (2014), the Word-of-Mouth can be measured by 2 parts:
Action
BO1: I recommend this shop to my family and friends.
ISBN (Indonesia): 978-602-73852-0-7 1051
Content
BO4: I tell other people about the advantages of this shop. BO5: I tell other people that this shop is better than other. BO6: I tell them that this shop treats me better than the others.
Vesel and Zabkar (2009), satisfaction with shops selling household goods has a direct impact on intention to repeat purchase and recommend. Getty and Thompson (1994) quoted by Ryu et al. (2010) found that high levels of satisfaction can increase customers‟
intentions to repurchase and recommend the product that already consume. This caused increasing toward company‟s profitability.According to Barsky (1992) quoted by Ryu et al. (2010) many researchers have provided empirical evidence for a positive relationship between customer satisfaction and behavioral intentions, such as repurchase and word-of-mouth intentions.
Walsh et al (2008), satisfaction has a positive impact on repetition and word-of-mouth intentions, on a chain of franchise. Moreover, Boulding et al., (1993) & Parasuraman et al. (1994) stated, satisfaction and loyalty are operate indisputably at the corporate organizational level, through better management of claims and warranties, building up productivity, corporate image and favorable word of mouth.
H2a. Affective satisfaction has a positive impact on behavioral loyalty. H2b. Affective satisfaction has a positive impact on attitudinal loyalty. H2c. Affective satisfaction has a positive impact on word-of-mouth.
Namkung and Jang (2007) quoted by Ryu et al. (2010) so evidenced the significant impact of customer satisfaction on behavioral intentions, including revisit, recommendation, and positive word-of-mouth intentions. These findings all support the significant link between customer satisfaction and behavioral intentions.
Cortinas et al. (2010) quoted by Blasco et al. (2014) stated that, customer satisfaction in store increases frequency of visits to the establishment and repeat purchase intention. Furthermore, one of the concepts concludes regarding Nesset et al. (2011), confirm the positive effect of satisfaction with product on future purchase intention and recommendations to others.
H3a. Cognitive satisfaction has a positive impact on behavioral loyalty. H3b. Cognitive satisfaction has a positive impact on attitudinal loyalty. H3c. Cognitive satisfaction has a positive impact on word-of-mouth.
impact of the customer affective satisfaction to cognitive satisfaction. Thus, it can be claimed that differentiated consumer behavior are created segmentation of the customer. While, Hahn et al. (2002) stated that, various limitation inherent in a priori segmentation are exist in multi-group methodology, as it is based on a two stage procedure that first forms groups without considering the structural model and second is applies multi-group methodology in each segment and it can be statistically inefficient for large models. H4. The strength of the relationship between affective satisfaction and cognitive satisfaction differs between consumer segments.
Geyskens et al. (1999) in Casalo et al., 2008, satisfaction can be divided into two distinct perspective which one of the perspective was considers satisfaction as an affective predisposition sustained by economic conditions, such as the volume of sales or profit margins obtained. Moreover, Teller and Gittenberger (2011) also examined to identify consumers segments based demographic or a psychographic variable and consequently to characterize these segments. It is useful to investigate (the determinants of) heterogeneity of older consumers to reveal variables that directly impact satisfaction toward re-patronage behavior (behavior intentions).
It can be concluded that there are customer segment distinguished by different customer behavior, attitude, reaction and value which are the trigger happened in affective
satisfaction and defect it relationship‟s strength within behavioral loyalty, attitudinal
loyalty and word-of-mouth in every purchase situation.
H5a. The strength of the relationship between affective satisfaction and behavioral loyalty differs between consumer segments.
H5b. The strength of the relationship between affective satisfaction and attitudinal loyalty differs between consumer segments.
H5c. The strength of the relationship between affective satisfaction and word-of-mouth differs between consumer segments.
ISBN (Indonesia): 978-602-73852-0-7 1053
From the definition above, it can be concluded that there are customer segment distinguished by different customer thought to make a judgment or decision when shopping, which are the trigger happened in cognitive satisfaction and defect it relationship‟s strength within behavioral loyalty, attitudinal loyalty and word-of-mouth in every purchase situation.
H6a. The strength of the relationship between cognitive satisfaction and behavioral
loyalty differs between consumer segments.
H6b. The strength of the relationship between cognitive satisfaction and attitudinal
loyalty differs between consumer segments.
H6c. The strength of the relationship between cognitive satisfaction and
word-of-mouth differs between consumer segments.
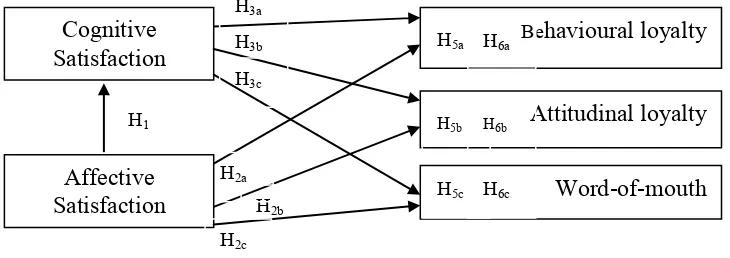
Figure 1. A Summary of the Research Hypotheses Established in the Theoretical Framework
Source: Blasco et al. (2014)
RESEARCH METHODOLOGY
This research is causal research, which has the goal to find out the pattern of cause-effect relationships of relationship variables (Zikmund, 2009: 16). In this study several variables studied are cognitive and affective satisfaction, behavioral and attitudinal loyalty, word of mouth and reviews their relationship between satisfaction-loyalty. Other influence, there are different segments of consumer based on heterogeneity because of differentiated consumer behavior.
Primary data obtained by preparing a questionnaire in accordance with the journal reference. Next step is to start by looking for activity survey respondents and distributing questionnaires are structured and understandable to people who have visited and shopped at clothing shop.
Scales that are used in this study use the measurement interval that has the same distance and a clear difference in scale. Alternative answers on the interval level measurement scale arranged numerical scale intended to make the respondents provide an assessment on the statement to be measured in 7 scale levels, as follows:
Disagree 1 2 3 4 5 6 7 Agree
The target population of this study was the visitors and customers who've shopped at clothing shop, located in the city of Surabaya. Characteristics of respondents were visitors and customers who've shopped at clothing shop ever get the welcome and service of the retail stores and have an educational background at least Senior High School. The target population is the consideration that the respondents can understand the related object of study and understand the questionnaire properly, so researchers will get answers more reliable and accurate.
Sample is part of a population that is expected to represent the population in the study (Zikmund, 2009: 68). In this study, the samples are people who have visited and shopped at clothing shop in Surabaya. The technique used in this research is non probability sampling, a sampling technique in which the sample units selected on the basis of personal judgment or convenience, and the probability of any particular member of the population that have been unknown or unrecognized (Zikmund, 2009: 391). Types of non-probability sampling are used to combine two ways to search for and obtain the respondents. Purposive sampling is used in this study because there are certain requirements that are given to respondents.
For sampling, there is a division of segmentation criteria based on market segmentation. Demographic factor is selected in this study to adjust the segmentation. According to Schiffman and Kanuk (2005) stated that sociodemographic factor can be determined as age, sex (gender), marital status, income, education and occupation. This research chose gender characteristic such as men and women from demographic factors as the latent segment.
Validity and reliability test do perform so that the data obtained is more reliable and accurate. A tool to measure the validity test, using SPSS for windows to test the significance of the total must be below 5%. Likewise for reliability using SPSS for windows, with a view Cronbach alpha > 0.6
ISBN (Indonesia): 978-602-73852-0-7 1055
(SEM) is a technique that Allows separate relationships for each of a set of dependent variables. Estimation techniques in this study using maximum likelihood which is the default of AMOS. This technique iterates repeatedly and is the most popular technique used in the study SEM.
Hair et al (2010: 672) states that the requisite number of Good fit index at least use 3-4 index from absolute and incremental index in order to do further testing of the research model. Therefore, this study is using five indexes as a measure of eligibility. In his book, Hair gives some indexes that are used to test the suitability of the model is accepted or rejected:
1. CMIN/DF (Normed Chi-square)
CMIN/DF is the minimum difference, statistic of chi-square (χ2) divided by the degree of freedom/DF so that called relative χ2. Value ratio of CMIN/DF which getting closer to 1 shows that the model is a good model. CMIN/DF which has a value of > 2 shows a model of a poor match/inadequate fit (Byrne, 1989: 55 in Arbuckle, 2007: 598)
2. GFI (Goodness of Fit Index)
GFI is a suitability index which calculates the weighted proportion of the variance in the sample of covariance matrix. GFI produces statistic fit that is less sensitive to sample size. GFI value is in the range of 0 to 1 (Hair et al., 2010: 667). GFI is acceptable if ≥ 0.90 (good fit). Higher value of GFI shows the value is getting better (better fit).
3. RMSEA (The Root Mean Square Error Approximation)
RMSEA is an index that is often used in the measurement to compensate the tendency of the Chi-Square (χ2) statistic which is for rejecting a model with a large sample size or the number of observed variable are many. Therefore, RMSEA can indicate how well a model with the population, not only with the sample used in the estimation. RMSEA values over time might indicate that the model is getting better (Better fit). Cut off value at the RMSEA can be accepted on the value of 0.05 to 0.08 (Hair et al., 2010: 667).
4. CFI (Comparative Fit Index)
CFI is the fit index improvement of NFI (Normed Fit Index). Acceptable value is located between 0 and 1 (Hair et al., 2010: 669). ≥ 0,90 CFI good value. Higher value of CFI shows the value is getting better (better fit).
5. Incremental Fit Index (IFI)
Hair et al. (2010) quoted by Ferdinand (2002: 47) argues that the appropriate sample size is between 100-200. When the sample size is too large, for example more than 400, then the method becomes very sensitive and it is difficult to obtain measures of goodness of fit. So Hair et al. in quoted by Ferdinand (2002: 47) suggests that the minimum sample size is as much as 10 observations for each estimated parameter. So for this study used as a sample:
n = number of indicators x (multiplied by) 10
Based on this formula, the minimum number of samples obtained as follows: n = 17 x 10 = 170 respondent
Therefore, the minimum sample size that should be used is as many as 170 respondents, but in this study determined the number of samples that will be used as much as 204 respondents. The entire sample of 204 is considered sufficient and meets the requirements raised by Hair et al. (2010) quoted by Ferdinand (2002).
According to (Hair et al., 2010: 710), the value of construct reliability (CR) that received is ≥ 0,70. And the high value of average variance extracted (AVE) indicates that the indicator has represented latent constructs which are well developed. According to Hair et al., (2010: 709) the value of average variance extracted that received is ≥ 0,50. At last, SEM hypothesis is tested with structural models. In hypothesis testing using α = 5% for the questionnaire will be distributed with the help of others, so that possible bias in the questionnaire. Thus, the hypothesis can be accepted if the value of t ≥ 1.96.
RESULT AND DISCUSSION
Validity is the extent to which a measurement/set of measurements can accurately measure the concept which under studied, here are the results of validity testing:
Table 1. Validity Test Results of Affective Satisfaction Variable Statement
No. Statement Pearson Correlations Sig. Info.
ISBN (Indonesia): 978-602-73852-0-7 1057
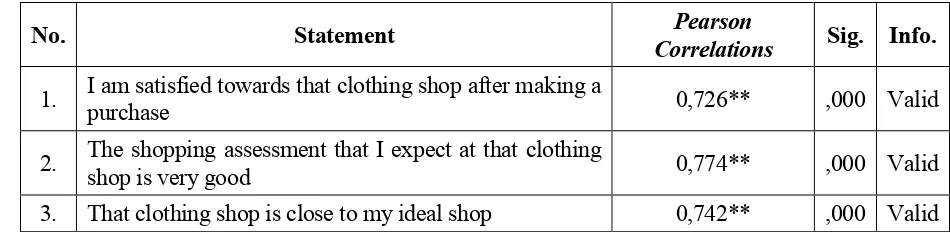
Table 2. Validity Test Results of Cognitive Satisfaction Variable Statement
No. Statement Correlations Pearson Sig. Info.
1. I am satisfied towards that clothing shop after making a purchase 0,726** ,000 Valid
2. The shopping assessment that I expect at that clothing shop is very good 0,774** ,000 Valid 3. That clothing shop is close to my ideal shop 0,742** ,000 Valid Source: SPSS result, processed
A total of 3 items to measure cognitive satisfaction in Table 2, has met the requirements to pass the validity test because of the significant results of below 0.05 and in terms of factor
analysis are also eligible, which are above 0.5. Therefore, some of the items on cognitive
satisfaction variables can be said to qualify the validity.
Table 3. Validity Test Results of Behavioral Loyalty Variable Statement
No. Statement Pearson Correlations Sig. Info.
1. I often visit that clothing shop 0,828** ,000 Valid
2. I often make purchases at that clothing shop 0,872** ,000 Valid Source: SPSS result, processed
The validity of the test results for some of the items that measure variables behavioral loyalty in Table 3 shows that all the items have significant numbers below 0.05. As well as the validity of test methods using factor analysis also shows the numbers of qualified that some items can be declared valid, which are above 0.5.
Table 4. Validity Test Results of Attitudinal Loyalty Variable Statement
No. Statement Correlations Pearson Sig. Info.
1. I feel committed to that clothing shop 0,813** ,000 Valid 2. I have a close relationship with that clothing shop 0,912** ,000 Valid
Source: SPSS result, processed
Table 5. Validity Test Results of Word-of-Mouth Variable Statement
No. Statement Correlations Pearson Sig. Info. 1. I recommend that clothing shop to my family and friends 0,777** ,000 Valid 2. If my family and friends ask my advice, I tell them to go to
that clothing shop 0,803** ,000 Valid
3. I encourage my family and friends to buy products in that
clothing shop 0,747** ,000 Valid
4. I tell other people about the advantages of that clothing shop 0,618** ,000 Valid 5. I tell other people that that clothing shop is better than others 0,726** ,000 Valid 6. I tell them that that clothing shop treats me better than the
others 0,741** ,000 Valid
Source: SPSS result, processed
A total of 6 items to measure word-of-mouth in Table 5, has met the requirements to pass the validity test because of the significant results of below 0.05 and in terms of factor
analysis are also eligible, which are above 0.5. Therefore, some of the items on
word-of-mouth variables can be said to qualify the validity.
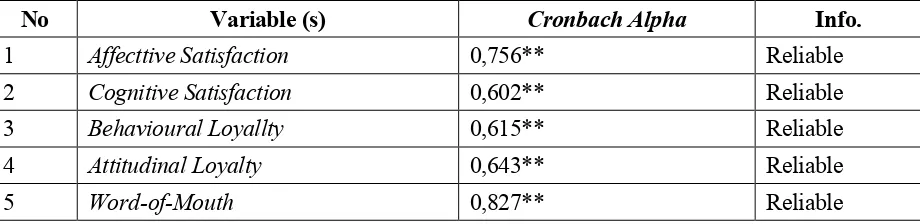
Table 6. Reliability Test Results
No Variable (s) Cronbach Alpha Info.
1 Affecttive Satisfaction 0,756** Reliable
2 Cognitive Satisfaction 0,602** Reliable
3 Behavioural Loyallty 0,615** Reliable
4 Attitudinal Loyalty 0,643** Reliable
5 Word-of-Mouth 0,827** Reliable
Source: SPSS result, processed From Table 6 it can be concluded that the variables of affective satisfaction, cognitive
satisfaction, behavioral loyalty, attitudinal loyalty and word-of-mouth declared reliable
because it has a Cronbach alpha value of more than 0.60. Thus, we can conclude the results of testing the validity and reliability of questionnaires that have been made to test the hypothesis have qualified.
ISBN (Indonesia): 978-602-73852-0-7 1059
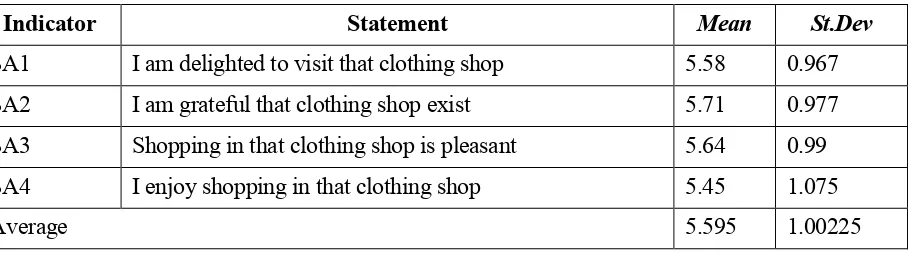
Table 7. Respondents Response related to Affective Satisfaction Indicator
Indicator Statement Mean St.Dev
SA1 I am delighted to visit that clothing shop 5.58 0.967 SA2 I am grateful that clothing shop exist 5.71 0.977 SA3 Shopping in that clothing shop is pleasant 5.64 0.99 SA4 I enjoy shopping in that clothing shop 5.45 1.075
Average 5.595 1.00225
Source: Primary data is processed by software SPSS 18.0 for Windows
Table 7 shows that the average value for affective satisfaction indicator totaled 5.595 where the value is more than 5, which are almost 6. Thus, it can be indicated that the shopping assessment of the respondents associated with pleasure and enjoyment that come in while shopping in one of the clothing shop at Surabaya that respondents often visited has high value. SA4 statement gets the lowest average value of the respondents‟
answers with a value 5.45, while for the statement SA3 gets the highest average rating of respondents‟ answers with a value 5.71.
Table 8. Respondents Response related to Cognitive Satisfaction Indicator
Indicator Statement Mean St.Dev
SC1 I am satisfied towards that clothing shop after making a purchase 5.69 1.021 SC2 The shopping assessment that I expect at that clothing shop is very
good 5.65 1.037
SC3 That clothing shop is close to my ideal shop 5.61 1.065
Average 5.65 1.041
Source: Primary data is processed by software SPSS 18.0 for Windows
Table 9. Respondents Response related to Behavioural Loyalty Indicator
Indicator Statement Mean St.Dev
LC1 I often visit that clothing shop 5.66 0.952
LC2 I often make purchases at that clothing shop 5.43 1.017
Average 5.54 0.984
Source: Primary data is processed by software SPSS 18.0 for Windows
Table 9 shows that the average value for behavioral loyalty indicator totaled 5.54 where the value is more than 5. So it can be indicated that the shopping assessment of the respondents associated with the intensity of visits and purchases of either the Clothing Store at Surabaya that respondents often visited has high enough for the value. LC2 statement gets the lowest average value of the respondents‟ answers with a value 5.43, while for the statement LC1 gets the highest average rating of respondents‟answers with a value 5.66.
Table 10. Respondents Response Related to Attitudinal Loyalty Indicator
Indicator Statement Mean St.Dev
LA1 I feel committed to that clothing shop 5.78 0.911 LA2 I have a close relationship with that clothing shop 5.45 1.065
Average 5.61 0.988
Source: Primary data is processed by software SPSS 18.0 for Windows
Table 10 shows that the average value for attitudinal loyalty indicator totaled 5.61 where the value is still more than 5. Therefore, it can be indicated that the shopping assessment of the respondents associated with satisfied with the commitment and relations of either the clothing shop at Surabaya that respondents often visited has high value. LA2 statement gets the lowest average value of the respondents‟ answers with a value 5.45, while for the statement LA1 gets the highest average rating of respondents‟ answers with a value 5.78.
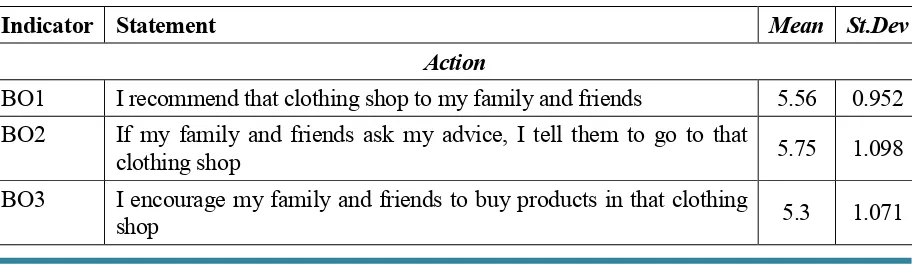
Table 11. Respondents Response related to Word-of-Mouth Indicator
Indicator Statement Mean St.Dev
Action
BO1 I recommend that clothing shop to my family and friends 5.56 0.952 BO2 If my family and friends ask my advice, I tell them to go to that
clothing shop 5.75 1.098
BO3 I encourage my family and friends to buy products in that clothing
ISBN (Indonesia): 978-602-73852-0-7 1061
Content
BO4 I tell other people about the advantages of that clothing shop 5.52 1.103 BO5 I tell other people that that clothing shop is better than others 5.5 1.057 BO6 I tell them that that clothing shop treats me better than the others 5.29 1.051
Average 5.48 1.055
Source: Primary data is processed by software SPSS 18.0 for Windows
Table 11 shows that the average value for word-of-mouth indicator totaled 5.48 where the value is more than 5. But BO6 statement gets the lowest average value of the respondents‟
answers which is 5.29, while for the statement BO2 gets the highest average rating of respondents answers with a value 5.75.
A. Measurement model
Here is a picture of the measurement model obtained from the processing of data using software AMOS 16.0.
Figure 2. Measurement Model Running Result of AMOS
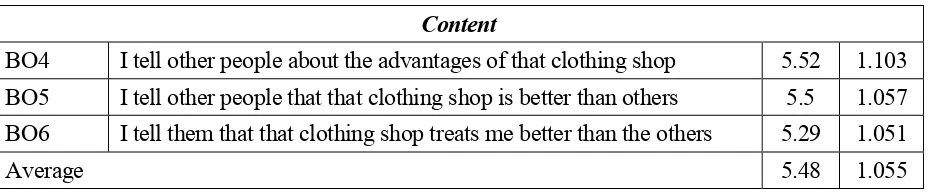
Table 12. Compatibility Test Results of Measurement Model
No. Compatibility Test Suitability Criteria Result Information
1 CMIN/DF CMIN/DF ≤ 2 1.583 Good fit
2 GFI GFI ≥ 0.90 0.915 Good fit
3 RMSEA RMSEA ≤ 0.08 0.054 Good fit
4 IFI IFI ≥ 0.9 0.969 Good fit
5 CFI CFI ≥ 0.90 0.968 Good fit
Source: Processing results AMOS 16.0, processed
CMIN / DF or normed Chi - Square is an index that is used to develop and test whether a model according to the data, sensitive to the number of samples. CMIN / DF showed a good level of suitability model if its value ≤ 3 (Hair et al., 2010: 666). In this study, CMIN / DF results at 1.583. These results indicate that the models tested meet the required criteria.
GFI is a suitability index for calculating the weighted proportion of the variance in the sample covariance matrix described by the covariance matrix of the estimated population. According to Hair et al., (2010: 667), closer to the value of 1 or ≥ 0.90, then the value of GFI is considered better. In this study, GFI value produced at 0.915 which is also meet the requires criteria
RMSEA used to determine if the level of error in the model were estimated in a population. Table 12 shows the value of RMSEA of compatibility test results showed almost good result where the value of RMSEA is 0.054 which is below than 0.08, so it can be said to be good fit. This means if the estimated error rate in the population models are not too high.
IFI is an index that indicates the suitability of the model, which is recommended by Bollen (1998) in Wijanto (2008: 57) is if the value is ≥ 0.90. IFI value closer to the value of 1 indicates a good level of suitability model. In this study produced IFI value of 0.969 so that it can be said that the models tested already meet the specified criteria.
CFI is a feasibility test model and is not sensitive to sample size and have Cut of Index ≥ 0.90. Acceptable value is located between 0 and 1, the higher the value it will show better fit (Hair et al., 2010: 669). Table 12 shows the CFI value of 0.968, it can be said that the model testing already good fit.
B. Validity and reliability test of measurement model
ISBN (Indonesia): 978-602-73852-0-7 1063
Table 13. Construct Reliability
Variable ( ∑Std.Loading) ( ∑Std.Loading)² ∑error Composite Reliability
SA 3.008 2.27188 1.72812 0.839635255
SC 2.329 1.808913 1.191087 0.819950424
LC 1.397 0.976565 1.023435 0.655993323
LA 1.558 1.214132 0.785868 0.755427557
BO 4.038 2.730124 3.269876 0.832959257
Source: Result of Excel 2007, processed According to Hair et al. (2010: 710) an reliability construct value which ≥ 0.70 suggest good reliability, however if the reliability construct value is between 0.60 and 0.70, it may be acceptable, provided that other indicators of a model's construct validity are good. Based on these test results, construct reliability values obtained on all variables are greater than 0.7 so that the variables used have generally been reliable, even the Behavioral Loyalty (LC) construct indicated at 0.655993323 which still acceptable.
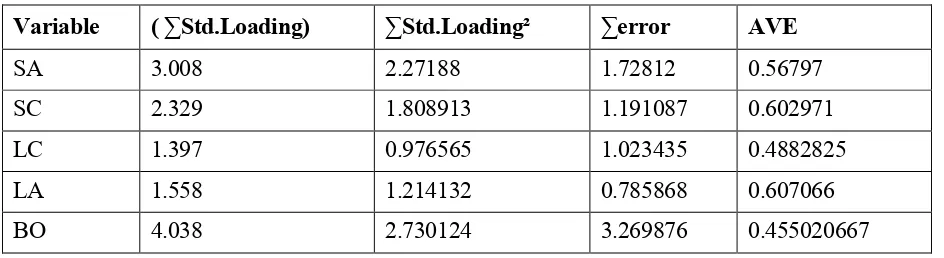
Table 14. Average Variance Extracted
Variable ( ∑Std.Loading) ∑Std.Loading² ∑error AVE
SA 3.008 2.27188 1.72812 0.56797
SC 2.329 1.808913 1.191087 0.602971
LC 1.397 0.976565 1.023435 0.4882825
LA 1.558 1.214132 0.785868 0.607066
BO 4.038 2.730124 3.269876 0.455020667
Source: Result of Excel 2007, processed
C. Structural model
C.1. Structural model (without segmentation)
Figure 3. Structural Model Running Result of AMOS
Source: AMOS 16.0
C.2. Structural model (men segment)
Figure 4. Structural Model Running Result of AMOS in Man Segments
ISBN (Indonesia): 978-602-73852-0-7 1065
C.3 Structural model (women segment)
Figure 5. Structural Model Running Result of AMOS in Women Segments
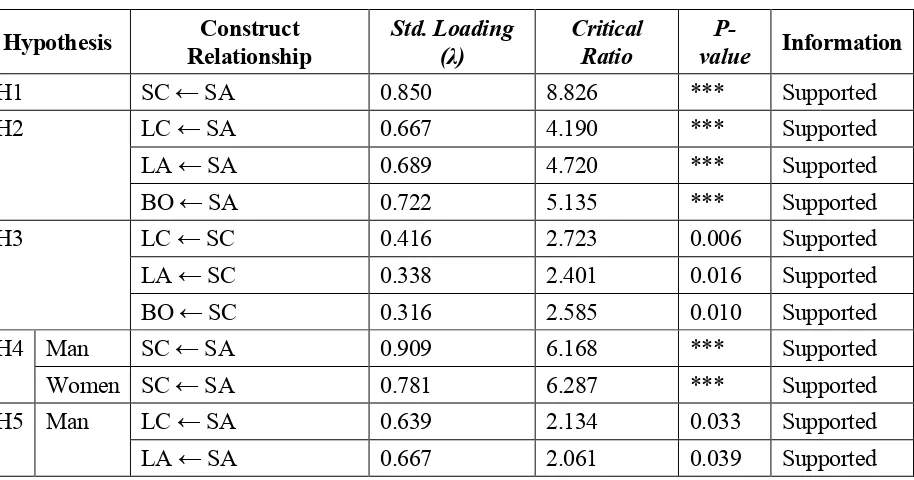
Source: AMOS 16.0 A construct can be said to have a significant effect on other constructs when the critical value ratio (CR) ≥ 1.96 (with a significance level of 5%). For more details, here is a translation table for the data processing of hypothesis testing.
Table 15. Hypothesis Testing
Hypothesis Relationship Construct Std. Loading (λ) Critical Ratio value P- Information
H1 SC ← SA 0.850 8.826 *** Supported
H2 LC ← SA 0.667 4.190 *** Supported
LA ← SA 0.689 4.720 *** Supported
BO ← SA 0.722 5.135 *** Supported
H3 LC ← SC 0.416 2.723 0.006 Supported
LA ← SC 0.338 2.401 0.016 Supported
BO ← SC 0.316 2.585 0.010 Supported
H4 Man SC ← SA 0.909 6.168 *** Supported
Women SC ← SA 0.781 6.287 *** Supported
H5 Man LC ← SA 0.639 2.134 0.033 Supported
BO ← SA 0.672 2.470 0.014 Supported
Women LC ← SA 0.688 3.792 *** Supported
LA ← SA 0.697 4.558 *** Supported
BO ← SA 0.758 4.405 *** Supported
H6 Man LC ← SC 0.520 1.744 0.081 Unsupported
LA ← SC 0.439 1.330 0.184 Unsupported
BO ← SC 0.345 1.307 0.191 Unsupported
Women LC ← SC 0.344 2.154 0.031 Supported
LA ← SC 0.263 1.983 0.047 Supported
BO ← SC 0.296 2.416 0.016 Supported
Source: Appendix 9 ***: significant with p-value < 0.05 or 5%
The amount of influence between variables is done by looking at the value estimate of each track. The larger the value estimate, shows that the greater the influence of variables that one with the other variables.
1. Customer affective satisfaction with the establishment has a positive impact on cognitive satisfaction.
2. Affective satisfaction has a positive impact on behavioral loyalty, attitudinal
loyalty, and word-of-mouth.
3. Cognitive satisfaction has a positive impact on behavioral loyalty, attitudinal
loyalty, and word-of-mouth.
4. The strength of the relationship between affective satisfaction and cognitive satisfaction not differs between consumer segments.
5. The strength of the relationship between affective satisfaction towards behavioral
loyalty, attitudinal loyalty and word-of-mouth are not differs between consumer
segment.
6. The strength of the relationship between cognitive satisfaction towards behavioral
loyalty, attitudinal loyalty and word-of-mouth are differs between consumer
segment.
CONCLUSION AND RECOMMENDATION