Other uses, including reproduction and distribution, or selling or
licensing copies, or posting to personal, institutional or third party
websites are prohibited.
In most cases authors are permitted to post their version of the
article (e.g. in Word or Tex form) to their personal website or
institutional repository. Authors requiring further information
regarding Elsevier’s archiving and manuscript policies are
encouraged to visit:
Contents lists available atScienceDirect
Accident Analysis and Prevention
j o u r n a l h o m e p a g e :w w w . e l s e v i e r . c o m / l o c a t e / a a p
Estimation of the social costs of home injury: A comparison with estimates for
road injury
Michael D. Keall
a,∗, Jagadish Guria
b, Philippa Howden-Chapman
a, Michael G. Baker
aaHe Kainga Oranga/Housing and Health Research Programme, Department of Public Health, University of Otago, Wellington, New Zealand bNew Zealand Institute of Economic Research, P.O. Box 3479, Wellington, New Zealand
a r t i c l e
i n f o
Article history: Received 18 March 2010
Received in revised form 9 November 2010 Accepted 29 November 2010
Keywords: Home injury Road injury Social cost
Value of statistical life Injury pyramid Cost–benefit analysis
a b s t r a c t
Home injury is thought to constitute a major health burden in most developed countries. However, efforts to address this burden have been hampered by reluctance from outside agencies to interfere with the home environment of individuals, even if it benefits the occupant’s safety. This paper outlines cost–benefit evaluation methods established in the transport safety domain applied to home safety to estimate the social cost of unintentional home injury in New Zealand. Estimates of costs imposed on society by home injury can provide an important motivator for initiating research and programmes to reduce home injury risk. Data sources used included mortality data, hospitalisation data and data on minor injuries that required medical treatment, but not hospital admission. We estimated that unintentional home injuries in New Zealand impose an annual social cost of about $NZ 13 billion (about $US 9 billion), which is about 3.5 times the annual social cost of road injury. These estimates provide a rational evidence base for decisions on housing-focused safety regulation or interventions that always carry some cost, and therefore need to be weighed against the benefits of injuries potentially prevented.
© 2010 Elsevier Ltd. All rights reserved.
1. Background
The home is an important setting internationally for injury. Studies show that in England and Wales, there were 3500 deaths from injury in and around the home in 2002 (ONS, 2002), almost 70% of non-transportation deaths; in the US in 2007, an estimated 44% of reported medically treated injuries occurred in and around the home (Chen et al., 2009). As a setting for injury, the home is particularly important for young and older people. For example, in New Zealand between 1989 and 1998, 53% of injury deaths and 55% of injury hospitalisations for children aged 0–4 years occurred in the home (IPRU, 2002).
Injuries occurring at home reflect the wide range of activities undertaken in that setting. For example, a New Zealand study of 1000 households found significant numbers of medically treated burns, falls, insect bites/stings, strain due to lifting, injuries from home maintenance, children playing, etc. (Keall et al., 2009). In fact, almost half of these home injuries actually occurred outside the house, in the yard or on steps and paths leading to the house (Keall et al., 2009). The comparable proportion of home injuries that occurred outside the house, as estimated from the US National
∗Corresponding author. Tel.: +64 4 918 6794; fax: +64 4 389 5319.
E-mail addresses:[email protected](M.D. Keall),[email protected] (J. Guria),[email protected](P. Howden-Chapman), [email protected](M.G. Baker).
Health Survey 2007, was 38% (Chen et al., 2009). The latter survey also showed falls were the leading cause of medically treated injury generally, and about 60% of falls occurred in the home (Chen et al., 2009).
A rational basis for allocating resources to reduce injury is cost–benefit analysis (Guria and Mara, 2000), which is widely used for evaluating proposed regulations and policies and has also been used in the housing domain to evaluate costs of housing interven-tions compared to associated health benefits (Chapman et al., 2009; Preval et al., 2010). Quantifying the benefits of reducing mortal-ity risks requires a monetised value of safety, which can be used to compare the benefits with the economic costs of enacting the policy. Such quantification commonly uses the value of a statisti-cal life (VOSL). In New Zealand and in many other countries VOSL is estimated from surveys based on residents’ willingness to pay for a small society-wide risk reduction to prevent one premature death. Willingness to pay for reduction in morbidity risk can be esti-mated as a proportion of the VOSL (Guria et al., 2003; Guria, 1993; Jones-Lee and Loomes, 1995; Miller and Guria, 1991). These mon-etisation approaches have benefited from the considerable research resources dedicated to transport and transport safety, out of which context most benefit–cost analyses with respect to injury preven-tion arise. Even though VOSL is estimated based on scenarios of changes in transport risk, it is valid to use the same value in other settings, as is being done in the UK (Mason et al., 2009). This paper describes an application of monetisation methods to the home safety area to estimate levels of investment in home safety that
0001-4575/$ – see front matter© 2010 Elsevier Ltd. All rights reserved.
would produce benefits that exceed their costs. We also construct injury pyramids and compare overall home injury social costs with those arising from road traffic injury.
The estimates have been made in the New Zealand setting, which therefore reflect the willingness to pay to avoid injury of that population. Nevertheless, the values should have some valid-ity for other western countries. An advantage of the New Zealand setting is that there exist reasonably complete data on injuries, including relatively minor injuries due to the effectiveness of the state-owned universal no-faults injury compensation insurer, the Accident Compensation Corporation (ACC). Under this scheme, the costs of medical services associated with an accident-related injury are largely met by the state, whatever the circumstances of the injury. Compensation for loss of income is provided under the same scheme regardless of whether the injury is work-related or not. Therefore victims of injury have little incentive to misrepresent the setting or nature of the injury event when making a claim. As a result, the ACC data base of injury claims has excellent coverage of the population, even if the administrative data collected have deficiencies in a surveillance role.
2. Methods
This section describes the data sources for assessing counts of home injury and the methods and assumptions used to assign costs to different severity levels of injury. Evaluating the benefits and costs of different injury prevention approaches requires generally straightforward calculations. The example we present below is that of cost–benefit calculations applied to structural improvements to the home as an injury prevention measure.
2.1. Data
Data sources included mortality and overnight hospital admis-sion data from the New Zealand Health Information Service (NZHIS), and Accident Compensation Corporation (ACC) data for minor injuries. The hospitalisation counts excluded readmission for the same accident (multiple admissions for a person with the same accident date), and also excluded self-harm, assaults and trans-port accidents. The location of the accident was missing for 21% of the non-transport hospitalisations and 13% of the non-transport deaths. Injuries and deaths without a location specified were not used in the analysis. A detailed study of ACC-reported injuries classified as occurring at home showed that about 17% had been misclassified as occurring in the home setting (Keall et al., 2009). We did not adjust injury counts accordingly as other settings to which ACC-reported injuries were coded may well have included a similar proportion of home injuries. Injuries in the home setting are likely to include a small proportion of occupational injuries where the workplace was also the injured person’s home. “Serious” injuries in this analysis are considered equivalent to overnight or longer hospitalisations. The “minor” injuries were counts of injuries requiring medical treatment, but not hospitalisation, as recorded by the state universal no-fault injury insurer (ACC). ACC data included both serious and minor injuries. These data also contained a small proportion of intentional injuries, which are not separately coded in the ACC system and can only sometimes be discriminated from unintentional injuries by an examination of the text description of the injury event. In contrast, hospitalisation and mortality data have codes to indicate assault or self-harm and these injuries could therefore be excluded from the analysis. Because of the social and legal unacceptability of intentional injury, the hospitalisation and mortality data will also include a small proportion of injuries that were not unintentional, even when data with assault and self harm codes are excluded.
We constructed pyramids for road injury and home injury to provide a comparison of the proportions of injuries occurring at different severity levels for these two settings. The road injury pyramid used 2007 road injury data from police reported crashes, hospitalisation data and ACC data for new claims from the Motor Vehicle Account.
2.2. Estimation of costs
To estimate the benefit of a home safety improvement in terms of injuries prevented, there are two main steps: (i) estimate the social cost per injury; (ii) estimate the number of injuries saved per year as a consequence of the home improvement. It was assumed that a home improvement would reduce the numbers of fatalities, serious injuries and minor injuries. The total benefit of the improve-ment can then be estimated to be the present value of the social costs of injuries prevented over the lifetime of the improvement.
Since all the benefits accrue over time, the flows need to be con-verted to present (discounted) values using a discount rate. We have used a 5% rate along with an 8% rate as a sensitivity analysis variant, provided because views vary concerning the most appro-priate rate. It can be argued that there should be more weight placed on the 5% rate because the housing context is one of “social” invest-ment, as the remediation of injury hazards yields a mixture of safety and esthetic benefits over time. The New Zealand Treasury until recently used a rate of 10%, but now suggests a “standard” rate of 8% and a rate for building investments of 6% (Chapman et al., 2009). Put simply, the discount rate indicates the way that an injury pre-vented in one year in the future is regarded less importantly today. If a discount rate of 8% is used and the lifespan of an improvement is 15 years, then the present value of all benefits accrued is about 8.56 times the benefit per year. If the present value of benefits is greater than the cost of a particular housing improvement, then the improvement is regarded as cost beneficial.
2.3. Estimating average social cost per injury
The social cost of a home injury includes mainly the costs of loss of life and life quality, medical costs and loss of output. The value to society of loss of life is measured by the Value of Statistical Life (VOSL). The loss of life quality on average due to serious and minor injuries is estimated as 10% and 0.4% of the VOSL respectively (Ministry of Transport, 2008). A VOSL that has been used in the NZ transport sector is $(NZ) 3.352 million at June 2008 prices. Prices shown in this paper are in New Zealand dollars. In February 2010, the approximate exchange rate was $(NZ) 1.00 = $(US) 0.70.
For losses of life quality and output, we have used the social costs per fatal, serious and minor injury as used for transport safety evaluations (Ministry of Transport, 2008). While there may be differences between traffic injuries and home injuries within the serious and minor injury categories in terms of average injury severity, the average values for losses of life quality and output were derived for a wide range of severity levels. More precise estimates, although desirable, are not feasible without conducting further willingness to pay studies.
The VOSL includes the loss of output due to a premature death. Therefore we do not add any further loss of output, as is the practice in estimating social costs in the transport sector. However, some injuries do not have any long-term impairment. The loss of output during the temporary incapacitation for such injuries needs to be added to the cost of loss of life quality. This cost was estimated by the Ministry of Transport for traffic injuries as $1400 and $300 respectively on average per serious and minor injury (Ministry of Transport, 2008).
Fig. 1.Injury pyramids for home setting for the years 2003–2005 and for roads for the year 2007.
Table 1
Number of deaths due to home injuries in NZ (excluding assaults, self-harm and transport accidents).
Year Number of deathsa
2002 255
2003 262
2004 260
2005 238
2006 239
aSource: NZ mortality data (February 2010).
of medical treatment and rehabilitation were estimated based on costs estimated for workplace injuries, with the reservation that home injuries may not have the same severity distribution as work-place injuries. The lifetime medical cost is estimated by ACC only for workplace injuries. We compared the first year total cost for workplace and home injuries. In the absence of more precise infor-mation, we assume that the relativity between the first year total costs in these two categories of injuries would hold for the relativ-ity of lifetime medical costs between these two injury categories. While we have estimated the value of loss of life quality sepa-rately for serious and minor injuries, we have estimated the lifetime medical costs averaged over all non-fatal injuries.
3. Results
For workplace injuries, the average first year total cost (medical and other costs) per injury claim in 2008 was estimated as $1165. The average first year total cost per ACC-reported home injury was about $550 at June 2008 prices. This is about 47% of the average total cost per workplace injury. The average lifetime medical cost per workplace injury at 2008 prices was estimated as $891. Assuming the relativity between first year total cost and lifetime medical cost per injury observed for workplace injuries holds for home injuries, the estimated lifetime medical cost per home injury at 2008 prices can be estimated to be about $421 on average.
Table 2
Estimated number of serious and minor home injuries in New Zealand.
Yeara Number of serious injuriesb Number of minor injuriesc
2003 16,270 372,010
2004 15,645 456,778
2005 15,958 533,876
2006 17,088 595,167
2007 17,598 649,187
aFor serious injuries, this is the calendar year; for minor injuries, this is July of
given year until the following June.
bNZHIS data on hospital admissions from home injury but ignoring multiple
admissions for the same injury date.
cACC new claims data for injuries occurring in the home, minus the number of
hospitalisations.
Table 1shows the number of fatalities from injury in the home, excluding assaults, suicides and transport accidents.
Table 2 shows counts of unintentional injuries at home that resulted in overnight hospitalisations, used as an estimate of the number of serious injuries, and Accident Compensation Corpo-ration (ACC) data used to derive counts of minor injuries. As hospitalised injuries are theoretically included in the ACC data, the counts of hospitalised injuries were subtracted from the counts of ACC-reported injuries to estimate the number of minor injuries.
Fig. 1summarises the information shown in the previous tables for the years 2003–2005 for home injury and compares the same information for New Zealand road injury using 2007 data (Ministry of Transport, 2008). It shows rounded figures to simplify the pre-sentation of relationships between the counts at the three severity levels: for each home injury fatality, there were on average 63 hospitalised home injuries and 1960 minor injuries; for each road injury fatality, there were on average 10 hospitalised injuries and 106 minor injuries. For home injuries, each fatal injury only makes up about 0.05% of all home injuries but the cost associated with fatal injuries makes up about 6% of the total social cost, when the social costings as shown inTable 3are used. Despite the large num-ber of minor injuries in the home, they only constitute about 50% of the total social cost of home injury.
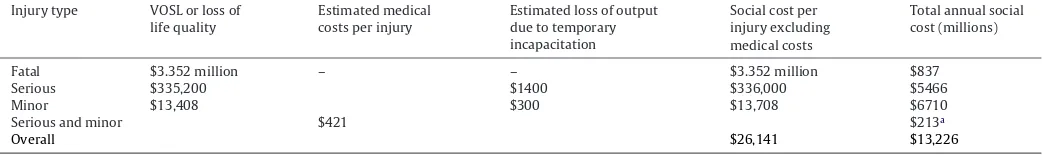
Table 3
Estimated social costs for home injury at 2008 prices (NZ dollars), together with weighted average social cost for a single home injury based on data 2003–06. Overall costs are weighted average per home injury per year and total aggregated annual social costs (last column).
Injury type VOSL or loss of life quality
Estimated medical costs per injury
Estimated loss of output due to temporary incapacitation
Social cost per injury excluding medical costs
Total annual social cost (millions)
Fatal $3.352 million – – $3.352 million $837
Serious $335,200 $1400 $336,000 $5466
Minor $13,408 $300 $13,708 $6710
Serious and minor $421 $213a
Overall $26,141 $13,226
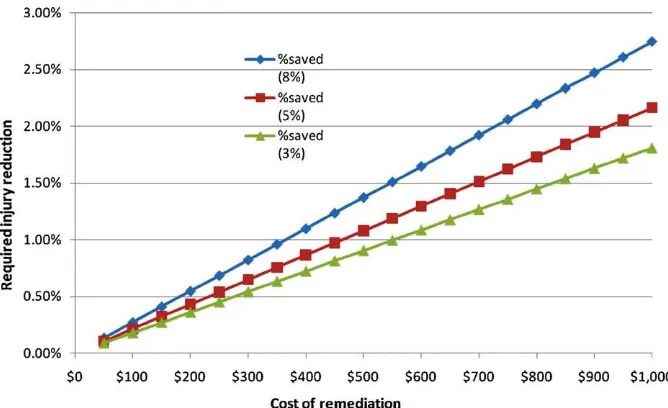
Fig. 2.Injury reduction required to justify specified costs of home injury hazard remediation at 8%, 5% and 3% discount rates.
Using the values described above for loss of life and life qual-ity, loss of output and medical costs, our estimate of social cost per home injury on average is about $26,141 at June 2008 prices (seeTable 3). This average is estimated from the total social cost of home injury in New Zealand, a weighted sum of the social costs esti-mated for the different severities of injuries shown in the rightmost column ofTable 3, divided by the total number of injuries.
Also shown inTable 3is the estimated total annual social cost of home injury in New Zealand, over $13 billion at 2008 prices. The average social cost of a road injury was estimated to be $77,500 and the total social cost to be $3.84 billion (Ministry of Transport, 2008), consistent with a much higher average severity of injury, but much fewer injuries overall. As an indication of the relative severity of overnight hospitalisations for road and home injury, we compared the distributions for length of stay in hospital for the years 2003–2005. Mean length of stay was higher for road injury, 5.8 days, than for home injury, 4.4 days, but the distributions were highly skewed. The 75th percentiles of the distributions were iden-tical at 6 days, but the higher percentiles were somewhat higher for road injury.
3.1. An example of cost–benefit analysis
An important unknown in the cost–benefit calculation is the proportion of injuries that may be prevented by a measure such as a structural injury hazard remediation. The social costs of the injuries prevented are the benefits identified in the benefit–cost analysis. In practice, the proportion of injuries prevented by some measure can be extremely difficult to estimate robustly. For this reason, it can be useful to consider the levels at which the benefits would equal the costs, a common threshold for deciding whether an injury prevention measure is worthwhile or not.Fig. 2shows various costs of injury hazard remediation in the horizontal axis, with the level of injury reduction required for a benefit–cost ratio of 1 (with benefits equalling costs) indicated for three discount rates: 3%, 5% and 8%. There were 1.5 million New Zealand households according to the 2006 Census (Statistics New Zealand, 2007), so we estimated from
Tables 1 and 2that there were approximately 0.14 home injuries per household annually. The required injury reduction shown in
Fig. 2is calculated to be:
cost of remediation per home
20×present value of annual home injuries per home.
As noted above, the total benefit of the remediation was estimated to be the present value of the social costs of injuries prevented over the lifetime of the remediation, estimated to be 20 years in this example (the 20 in the denominator of the above equation). Provision of a handrail for steps or stairs is an example of such a remediation.Fig. 2shows that, at the conservative 8% discount rate, about 1% of injuries need be prevented by an intervention costing $370 for that intervention to be considered cost–beneficial. Of course, more durable improvements would yield greater overall benefits and higher benefit–cost ratios.
4. Discussion
A previous New Zealand study looked at associations between structural home injury hazards that were systematically enumer-ated in a sample of homes and the rate of injuries occurring in homes with different numbers of hazards (Keall et al., 2008). For each additional home injury hazard enumerated, it was estimated that there was an associated increase in the odds ratio of a home injury occurrence of 22% (with 95% CI: 6–41%). This result suggests that addressing structural injury hazards in the home may be effec-tive in reducing home injury, but has the limitation that it is just a measure of association. In fact, to date there have been no studies of adequate size and quality to provide evidence of the effectiveness of structural home hazards remediation (Lyons et al., 2006). If the lower confidence limit from the previously cited NZ study (6%) is used as a lower bound for an estimated reduction in home injury rates per additional injury hazard, then the cost–benefit equation illustrated inFig. 2indicates that the expenditure of more than $2000 per house would be justified.
prices (Ministry of Transport, 2008). The average social cost we pre-sented for home injury was for all injuries occurring at home, for all mechanisms and all age groups. A related issue is that different interventions have different effects on particular severity levels. For example, provision of window guards for second storey and higher windows would have a greater impact on hospitalised injuries of young children than on minor injuries, due to the severity of the impacts of falls from such heights. Cost–benefit analysis of such an intervention should ideally use higher benefits that accrue from preventing higher severity injuries than a simple average social cost.
There are also limitations in the way that injury costs have been estimated. While there may be differences between traffic injuries and home injuries within the serious and minor injury categories in terms of average injury severity, the average values for losses of life quality and output were derived for a wide range of severity levels. Similar comments apply to the relative severity of home and workplace injuries. More precise estimates, although desirable, are not feasible without conducting further Willingness to Pay studies. Lastly, the estimated total social costs of injury are highly depen-dent on the VOSL estimates that have been used. Nevertheless, the use of the same metric across both the housing and road injury settings does at least allow comparability, and the same means of comparison could be extended to other injury settings.
The total social cost of home injury has not been calculated before for New Zealand and has rarely been published for other jurisdictions. One exception is an estimate of total social costs of unintentional home injury in the US (Zaloshnja et al., 2005). That study estimated an annual 1998 cost of at least $217 billion, of which about 16% were costs of fatal injuries. The lower proportion of our estimate due to fatal injuries (only 6%) may be at least par-tially a result of our inclusion of the large number of minor injuries, whose data were derived from the ACC system. Other jurisdictions may have similar levels of home injury rates of lower severity, but adequate surveillance is lacking for reporting these injuries.
As noted above, the home environment is considered a pri-marily private space in which individuals are considered free to determine aspects of their environment, even those that are poten-tially detrimental to their safety. There are limits to this freedom, mainly when there are consequential externalities such that the health and safety of other people are seriously threatened. The will-ingness to pay to reduce private domain risks has been shown to be considerably higher than that for public domain risks by vari-ous studies (Svensson and Vredin-Johansson, 2010). The work of Paul Slovic and colleagues shows that those who are vulnerable are understandably more risk averse than those with more material resources and may be more attached to safer places, such as their homes, where they can access resources through local networks (Slovic, 1987).
Our estimate that the social costs of home injury are about 3.5 times the social costs of road injury should motivate efforts to reduce this injury burden, but does not necessarily imply that 3.5 times the resources currently devoted to road injury preven-tion should be allocated to home injury prevenpreven-tion. Expenditure on preventive measures is justified in terms of the injuries able to be prevented rather than the sheer size of the injury burden. It is unlikely that the home injury setting is as amenable to injury pre-vention efforts as the road injury setting. A major barrier to progress in this area is the very limited evidence base of effective measures to reduce home injury (Keall et al., forthcoming). Research to iden-tify effective prevention measures is absolutely crucial to reduce the disturbingly high social cost imposed on society.
To conclude, we have outlined the methods and the results of a study estimating both the injury pyramid and the social costs of home injuries using social cost estimates established in the transport injury field. We consider that such estimates form an important part of any evaluation of injury prevention campaigns, policies and interventions as they provide a rational basis for direct-ing resources. There is currently a lack of emphasis placed on benefit–costs analyses in health research, which limits the ability of governments and agencies to develop sound policy (Drummond et al., 2008). The disturbing magnitude of the annual social cost of home injuries, which we estimate to be about $(NZ) 13 billion, must be a motivating factor for injury prevention efforts.
Acknowledgements
Thanks to ACC for providing funding for the Taranaki Home Injury Hazards Study, of which the current analysis formed a part, and to Jane Zhang for extracting hospitalisation and mortality data for this project. The opinions expressed in this paper are those of the authors and do not necessarily represent those of any other agency.
References
Chapman, R., Howden-Chapman, P., Viggers, H., O’Dea, D., Kennedy, M., 2009. Retrofitting houses with insulation: a cost–benefit analysis of a randomised community trial. Journal of Epidemiology & Community Health 63, 271–277. Chen, L.H., Warner, M., Fingerhut, L., Makuc, D., 2009. Injury episodes and
cir-cumstances: National Health Interview Survey, 1997–2007. Vital and Health Statistics. Series 10, 241. National Center for Health Statistics.
Drummond, M., Weatherly, H., Ferguson, B., 2008. Economic evaluation of health interventions. British Medical Journal (BMJ) 337, a1204.
Guria, J., Jones, W.R., Jones-Lee, M., Keall, M.D., Leung, J., Loomes, G., 2003. The value of statistical life and prevention of injuries in New Zealand. Land Transport Safety Authority.
Guria, J., Mara, K., 2000. Monitoring performance of road safety programmes in New Zealand. Accident Analysis & Prevention 32, 695–702.
Guria, J.C., 1993. The expected loss of life quality from traffic injuries requiring hospitalisation. Accident Analysis & Prevention 25, 765–772.
IPRU, 2002. IPRU Factsheet No. 27: injuries in the home to children aged 0–4 years. Jones-Lee, M., Loomes, G., 1995. Scale and context effects in the valuation of transport
safety. Journal of Risk and Uncertainty 11, 183–203.
Keall, M.D., Baker, M., Howden-Chapman, P., Cunningham, M., 2008. Association between the number of home injury hazards and home injury. Accident Analysis & Prevention 40, 887–893.
Keall, M.D., Guria, J., Kamalesh, V., Baker, M.G., Howden-Chapman, P., Cunningham, M., 2009. Taranaki Home Injury Hazards Study: Final Report. University of Otago, Wellington.
Keall, M.D., Ormandy, D., Baker, M.G., forthcoming. Housing conditions and home injury, In: World Health Organisation (Ed). The Environmental Burden of Disease associated with Inadequate Housing. WHO Regional Office for Europe Copen-hagen.
Lyons, R.A., Sander, L.V., Weightman, A.L., Patterson, J., Jones, S.A., Lannon, S., Rolfe, B., Kemp, A., Johansen, A., 2006. Modification of the home environment for the reduction of injuries. Cochrane Database of Systematic Reviews 4.
Mason, H., Jones-Lee, M., Donaldson, C., 2009. Modelling the monetary value of a QALY: a new approach based on UK data. Health Economics 18, 933–950. Miller, E.J., Guria, J., 1991. The Value of Statistical Life in New Zealand:
Mar-ket Research on Road Safety. Land Transport Division, Ministry of Transport, Wellington.
Ministry of Transport, 2008. The Social Cost of Road Crashes and Injuries June 2008 update. Ministry of Transport, Wellington.
ONS, 2002. Mortality statistics: Injury and poisoning. England and Wales 2002 (Series DH4).
Preval, N., Chapman, R., Pierse, N., Howden-Chapman, P., 2010. Evaluating energy, health and carbon co-benefits from improved domestic space heating: a ran-domised community trial. Energy Policy 38, 3965–3972.
Slovic, P., 1987. Perceptions of risk. Science 236, 280–285.
Statistics New Zealand, 2007. 2006 Census results. Statistics New Zealand, Welling-ton.
Svensson, M.Y., Vredin-Johansson, M., 2010. Willingness to pay for private and public road safety in stated preference studies: why the difference? Accident Analysis & Prevention 42, 1205–1212.