Petrophysical Properties Analysis of Reservoir Rock Using
Core Analysis and Interpretation Log Data Method To
Estimated The Water Saturation (Sw) at OD-1 and OD-2
Wells in The X-Area
Ordas Dewanto
1,a), Bagus Sapto Mulyatno
1,b), Sri Rizky
1,c), Alimuddin
1,d)1 Geophysical Engineering, Lampung University
The technology developments of reservoir characterization show importance of understanding the relationships between petrophysical properties of rocks, reservoir parameters and seismic wave parameters. The goal of this study is the evaluation of reservoir condition by analyzing petrophysical properties change in reservoir rock to see the amount of Sw oil and gas in OD1 and OD2 wells by using log interpretation and core analysis method. The porosity () is determined by the results of cross-plot between density log (RHOB) and porosity log (NPHI) when Sw was simply determined by using the Archie equation. The core analysis data showed value of tortuosity factor a=1, and saturation exponent n=2 as a parameter in Sw-Archie equation. Porosity value of reservoir rock in OD1 well is 5.5% to 20%, while OD2 well is 4% to 36%. This study used pickett plot method as the determination of water resistivity (Rw, Rt, Ro) on water bearing area. The results of this research shows OD1 well with =35%, Rw=0.11m and cementation factor m=2 obtained Rt=1m and Sw=100%, Rt=1.2m and Sw=90%, Rt=1.6m and Sw=80%, Rt=4m and Sw=50%, Rt=11m and Sw=30%. While on OD2 well with =42%, Rw=0.13m and cementation factor m=2.3 obtained Rt=1m and Sw=100%, Rt=2m and Sw=70%, Rt=5m and Sw=45%, Rt=20m and Sw=22.4% and so on. If there is a petrophysical parameters (, Rt, Rw, m or a) change, there will be also a change in the fluid saturation (Sw). The conclusion is the changes in the petrophysical properties of rocks affects Sw and Sw distribution is very important to predict the oil and gas reserve in the reservoir rock.
INTRODUCTION
show good agreement for porosity and fluid saturation between the model and the measurement results. The distribution of rock porosity and fluid saturation that filling the reservoir rock is considered two things that are very important in the construction of a reservoir model.
This research generally has the objective evaluation of the condition of a reservoir in order to predict the fluid and gas reserves and the amount of fluid produced. The specific purpose of this study is to estimate porosity and fluid saturation through identifying and analyzing the changes in the physical properties of the reservoir rock.
The determination of rock physics is done by two methods, core analysis in the laboratory and log data interpretation. One alternative in determining the physical properties of rocks carried by acoustic waves propagate in rocks. Core analysis data resulting from the measurement and analysis of reservoir rocks in the lab is the information that is needed to determine the physical properties of rock very specific, which in this study is used to predict the performance of the reservoir rock. Analysis of reservoir rock used in this research is the analysis of core routine and special core.
Well log analysis generates porosity (), water saturation (Sw) and several other petrophysical parameters for the interval in question. Although the interpretation of the logs themselves can be regarded as susceptible to uncertainty, but the results are considered as a reference to truth and used to process the correlation of the results of data analysis core.
The first step is determining the potential layers to see the gamma ray log is small, these characteristics indicate permeable layer. The second stage determines the productive layer, this layer characteristics detected by the separation log NPHI and RHOB supported by log LLD. The third phase determines Sw and on the layer and productive potential. Porosity is determined based on the cross-log plot RHOB and NPHI, and is determined by the equation Archie Sw. With the help of core analysis of data obtained by a = 1 (tortuosity factor), and n = 2 (exponent saturation) as the parameter Sw-Archie.
The benefits of this research are: first, obtaining a practical methodology for preparing the results of acoustic measurements on core samples of rock to estimate the usefulness of fluid saturation and porosity; second, of the results of these measurements with the help of well log data and mathematical modeling, acquired a systematic method to prepare the laboratory test results that can be considered ready for use in the output seismic; Third, the results of these measurements can be used as supporting data for the evaluation of the condition of a reservoir in order to predict the fluid and gas reserves and the amount of fluid produced.
LITERATURE REVIEW
Reservoir characterization technology developments indicate the possibility of seismic survey results were used to determine the distribution of fluid saturation in the reservoir. This implies the need to understand the relationships between petrophysical properties of rocks, reservoir parameters and seismic wave parameters which can either be done by recording log data interpretation and analysis in the field of rock core in the three laboratories. Based on these requirements, this study presents an attempt to improve the acoustic measurements on rock core samples in the laboratory and recording log data interpretation, to determine the hydrocarbon content and predicting oil and gas reserves in the reservoir rock. As well as the previous research, for example, King (1966) presents a general concept of the use of four-dimensional seismic surveys, as a means to monitor changes in fluid saturation in the reservoir due to the processes of exploitation. Another example is Munadi et al (1995 & 1996) examines the feasibility of using elastic rock properties, derived dynamically from the results of the seismic survey, to achieve that goal. This implies the need to understand the changes in the physical properties of rock and acoustic signals that can either be done in the laboratory. By the results of such research, with the help of well log data and mathematical modeling, it expected to form a systematic method to prepare the results of laboratory testing with the aim to estimate the fluid saturation and porosity in accordance with the conditions of the relevant reservoir.
The emergence of the idea of the study also came from some earlier research, which is a bit much to have a relationship with the research conducted. Previous research which associated with this research are:
Kusumastuti (1994) in his research on The Relation Speed Acoustic Waves With Porosity In The Reservoir Rock, gives the conclusion that the acoustic wave velocity measurements in rocks with overburden pressure variation showed a good relationship. The higher the overburden pressure, the speed is higher.
Wang (1992) and Munadi, Triharjanto and Rubiyanto (1995) provides an overview of the physical properties of the seismic data into a new hope in enhancing the success of the exploration. One year later Munadi, Hermansyah and Widarsono (1996) conclude that the gas saturation estimation of seismic data is one of the conceptual approaching.
Widarsono and Saptono (1997) in his study of Support In The estimated porosity and fluid saturation from seismic surveys, give some conclusions that the method of acoustic measurements in the laboratory has several advantages over methods of logs, among other, in terms of measurement accuracy dynamic parameters are required. In addition it also concluded that the magnitude inkompresibilitas and rigidity rock in dry conditions has been shown to play an important role in determining water saturation and porosity.
Dewanto (2001) in his research on Analysis of the Relationship Between Porosity on Thermal Conductivity Rock Results Measurement and Calculation, and Dewanto (2003), in her research on Analysis of Acoustic Velocity and Porosity Relationship in Reservoir Rock giving some conclusions, first: the price of porosity rocks have price variations, due to temperature differences and heat in these rocks, second; the price of the thermal conductivity of rocks is influenced by pressure, thus increasing the depth of the greater heat conductivity of rocks. Furthermore Dewanto et al (2004) conducted research on the influence of the physical properties of reservoir rocks, and in 2005 Surtono re-examine more in one of the physical properties of rock that is the bulk modulus in the laboratory.
Research in 2007 is a continuation of research Dewanto (2006) on The Analysis of The Effects of Physical Properties Changes Using Laboratory Measurements to Estimate Porosity and Water Saturation. This research studied more deeply about the changes in physical properties of rocks obtained from measurements in the laboratory and results log interpretation. Furthermore, the results of both methods are associated with fluid saturation and porosity, and analyzed more deeply. By analyzing some of the changes in physical properties of rocks, obtained from acoustic measurements on samples rock core, with the help of well log data and mathematical modeling, is expected to form a systematic methods to prepare the results of laboratory testing with the aim to estimate the fluid saturation and reservoir porosity in accordance with the relevant conditions.
Contributions to science and national development: first, the results of this study can be used as the basis for a theory of applied science in industrial scale; second, systematic method that can be used in the oil and gas companies primarily in predicting fluid reserves of oil and gas; Third, the method used in this study is expected to make fundamental discoveries of new methods, especially in the world of hydrocarbon exploration.
METHODOLOGY
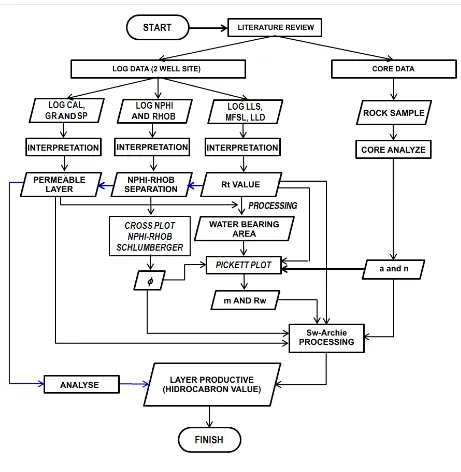
Figure 1. Research Flow Chart
DISCUSSION AND RESULTS
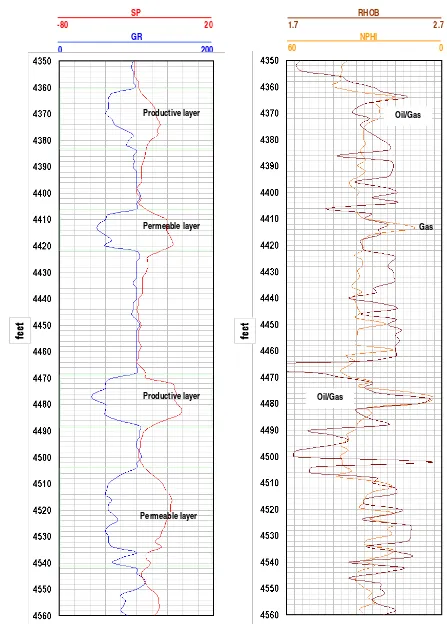
Interval is an area that has a porous permeable layer or an interval estimated as productive layers are layers containing hydrocarbons (oil and gas). By looking at the graph and log GR SP log, can be determined permeable and non-permeable layer. If the SP log graph points to the right (large value), GR log graph pointing to the left (precious little), then this area is an interval of porous (permeable layer), while the non-permeable layer has properties opposite.
At Wells OD-1 interval porous contained at a depth of 5805 ft to 5830 ft, 5970 ft to 6300 ft, 6320 ft to 6460 ft, 6540 ft to 6620 ft, 6665 ft to 6815 ft, and 6865 ft to 7000 ft. While on Well-second intervals there are porous at a depth of 4360 ft to 4384 ft, 4408 ft to 4422 ft, 4468 ft to 4488 ft and 4504 ft to 4542 ft. Conditions on the walls of the well wells and wells OD-1 OD-2, which is the layer of shale (shale interval showed) caliper value worse than the
bit-size, then the well dilated and the state of the well is not compact. While on a layer of sand (sand interval shows), the walls of the well is not so wide, because the price approaching caliper-size bits. So the state of the wall of the well in the area of sand fairly compact / hard (well). Tools bed-boundary indicators used in this research that the GR logs and SP logs. For GR log, it looked firmly at each boundary layer and deflection toward shale. As for the SP log, the deflection leading to the sand, so they form a separation (the opposite of the porous separation) on each bed-boundary (the bed-boundary layer).
Interval depicting porous permeable layer, non-permeable and productive layer on Well OD-1 can be seen in Figure 1B and 2. While at Wells OD-2 is shown in Figure 3 and 4. In the picture also depicts the condition of the well wall and tools indicator of bed-boundary (the boundary layer).
Porosity ()
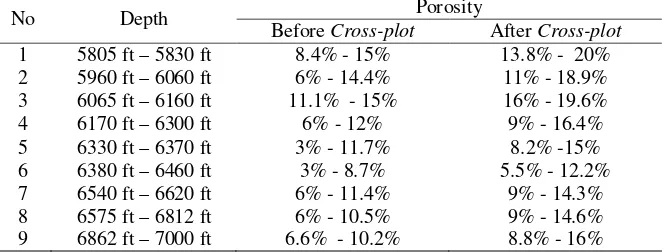
Porosity determination is done by NPHI log, RHOB log, and log Sonic cross-plot, with the help of Chart Schlumberger CP-1b. The results of the cross-plot is used as the basis for determining the value of porosity () at depth and a certain thickness. OD-1 wells and wells OD-2 has a porosity varying prices for each interval. The results of data processing using cross-plot method Chart Schlumberger CP-1b are shown in Table 1 for wells OD-1 and Table 2 for wells OD-2. Porosity values after the cross-plot using Schlumberger Chart CP-1b between 5.5% to 20%. This is consistent with the theory that explains that prices in general porosity ranging from 5% to 40%, this intervals or permeable interval, where the sand show graphs constant, while NPHI and RHOB clustered as well as having a low porosity. This area also shows a low resistivity at the LLD chart.
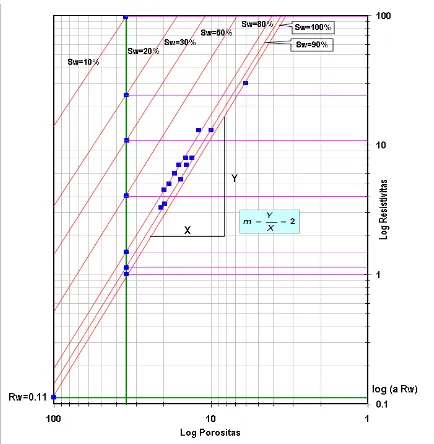
For resistivity obtained by observing the charts on resistivity logs, namely price and LLS Rt. All data are indicated by resistivity log generally include curves and curves GR SP. Then after a straight line drawn through the same point or a line, the price can be searched using the formula log Rt= -m log +log (a Rw) was a valuable reference for 100% porosity.
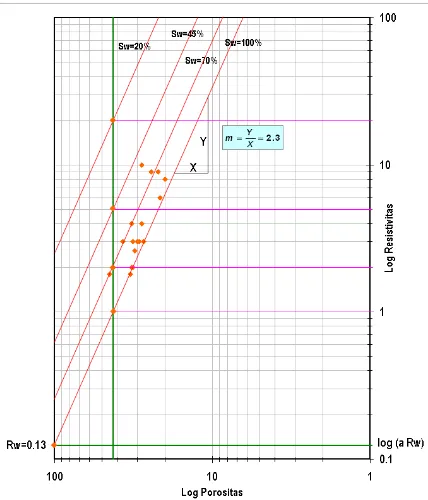
Estimated value of Rw the OD-1 well is determined by using the data shown in Table 3. These data are located in water bearing area, ie in the depth interval 6070 ft to 6290 ft. To find out the price of Rw in this method is to first determine the actual porosity (porosity after cross-plot), by plotting NPHI log, RHOB log, and Sonic log. Then, after a cross plot porosity associated with the resistivity price, so didapatlah graph porosity and resistivity which can be seen in Figure 5 and Figure 6. For the determination of the value of Rw and Sw on Well OD-1, using methods Pickett Plot, can be seen in Figure 5.
Well known from the data log-1, f = 1.1 g / cc, the results of cross-plot porosity with Rt (LLD) using CP-1d Shlumberger Chart shown in Figure 5. The value of m = 2 is obtained from a straight line that has Sw = 100%, determined by a formula gradient m = y / x. Furthermore, determining the value of Rw, namely by as follows:
At the Well log data OD-2, f = 1.1 g / cc, the results of cross-plot porosity with Rt (LLD) using CP-1d Shlumberger Chart shown in Figure 4.35. The value of m = 2.3 is obtained from a straight line that has Sw = 100%, determined by a formula gradient m = y / x. Next determine the Rw value by:
)
Archie water saturation models is the basis of the calculation of water saturation. This model is typically used in the rocks free of clay minerals. As unity in determining water saturation turtuositas a parameter, cementation factor m, and the saturation exponent n is a part that cannot be separated. These parameters have been determined at the time of rock core analysis lab results in the form of data core.
Based on the value of Sw obtained from Pickett Plot method on both well log, showed the price almost equal to the price Sw on calculations using the Archie equation. Due to the content of shale permeable layer of small amounts, so Sw Archie formula used as the method widely used by experts log interpretation. The method of determining the value of Sw on Well OD-1 is shown in Figure 5, and the elaboration briefly shown in Sw Determination well 1 attachment. For wells 2 method of determining the value of the same as well Sw OD-1, shown in Figure 6, and the elaboration briefly shown in Determination Sw Well OD-2 attachment.
Hydrocarbon Bearing Layer
At Wells OD-1 intervals contain hydrocarbons into the permeable layer and an interval productive area. Permeable layer containing hydrocarbons at 5805 ft to 5830 ft, 5960 ft to 6060 ft, 6065 ft to 6160 ft, 6170 ft to 6300 ft, 6330 ft to 6370 ft, 6380 ft to 6460 ft, 6540 ft to 6620 ft, 6675 ft to 6812 ft and 6862 ft to 7000 ft.
The hydrocarbon type at 5805 ft to 5830 ft is oil, because at a depth of 5805 ft, the value of the density (RHOB) experienced a sharp decline and constant to a depth of 5830 ft, with a porosity (NPHI) is low, and is in the region porous interval. If RHOB and NPHI do cross-plot, the type of lithology shows limestone and sandstone. While 5960 ft to 6060 ft is gas because the value of the density (RHOB) suddenly dropped the price of changing to a depth of 6060 ft. Price porosity in this interval is not too high and it is located in the permeable layer, while the prices of its high LLD with state NPHI and RHOB form of separation is quite wide. At 6065 ft to 6160 ft, the hydrocarbon type is oil, because the density price smaller but do not change drastically. While the price of NPHI low and LLD (Rt) is small, and is located on a permeable area. 6170 ft to 6300 ft is water bearing area. At certain depths density suffered a sharp drop, while the price is low and relatively high porosity. Type hydrocarbon oil is expected in this area. 6540 ft to 6630 ft is permeable layer with the type of hydrocarbon is gas as the density prices is uneven and capricious, and formed a wide separation, while the price of LLD (Rt) is quite large. At 6675 ft to 6812 ft, the type of hydrocarbon is oil, because the value of the density (RHOB) suddenly drop and constant, while prices LLD is quite small. In the area of porosity (NPHI) is low and it is located on a permeable layer that is productive.
RESUME
1. OD-1 wells and wells OD-2 is a two wells were equally productive, it can be seen from some of the second interval of the well has a productive permeable layer containing hydrocarbons. The analysis showed that the OD-1 well is estimated hydrocarbon reserves greater than the OD-2 wells.
2. Well OD-1 has a thickness of the layer containing the oil and gas greater or more than the OD-2 wells. Throughout the depth of 5800 ft to 7000 ft on Well OD-1, is dominated by several productive layers containing hydrocarbons (oil and gas). As for the OD-2 wells, only two productive layers containing hydrocarbons (oil and gas), and also the condition of a thin layer (not too thick or large).
3. Description Well OD-1 as mentioned above, resulted in a decision that hydrocarbon reserves are expected to be ready for production is well OD-1, it is supported also by the value of fluid saturation and porosity are good, that Sw = (30% to 90 %), = (15% to 40%).
REFERENCES
1. Achmad dan Fitriani., 2013, Study Of Petrophysical, Fluids Properties, And Hydrocarbon Potential In Well FA On Prabumulih Field PT. Pertamina Ep Region Sumatera, Unsri, Palembang.
2. Amadei, B., Savage, W.Z. & Swolfs, H.S., 1987, GravitationalStresses in Anisotropic Rock Masses. Int. J. Rock Mech. Min. Sci. and Geomech. Abst., 24:5-14.
3. Darling., Toby., 2005, Well Logging and Formation Evaluation, Oxford: Elsevier Publishing Company. 4. Darman, H., Sidi, F.H., 2000, An Outline of the Geology of Indonesia, IAGI Vol 20th, Indonesia, Page
45-67.
5. Dewanto, O., 2002, correlation Analysis Porosity Rock Against Thermal Conductivity Measurement and Calculation on Oil Well, Science Jurnal and Technology Unila ISSN 0853-733X Vol. 8 No. 2, years 2002 page. 27-41.
6. Dewanto, O., 2002, Analysis of Acoustic Waves Creep Speed Relations with the rock porosity Reservoir,
Science Jurnal and Technology Unila ISSN 0853-733X Vol. 8 No. 3, year 2002.
7. Dewanto, O., 2004, Analysis of Effect of Changes in Physical properties of rocks against Speed Acoustic Wave Rock Reservoir, Proceedings of the Seminar on Scientific Research Results with science and technology Development and Application Scene Welcoming the Era of Globalization, Universitas Lampung. I Edition, September 2004, ISBN 979-8287-65-7.
8. Dewanto, O., 2006, Analysis of Effect of Changes in Physical Properties of Hydrocarbon Maturation rocks to level the reservoir rock, Science Jurnal and Technology Unila ISSN 0853-733X, Vol. 12 No.2, Augustus 2006, p.113-120.
9. Diaz, M., Prasad., et al., 2002, Effect of Glauconite on the Elastic Properties Porosity and Permeability of Reservoirs Rocks, AAPG Annual Meeting, Houston, Texas on article.
10. Dresser Atlas, 1982, Well Logging and Interpretation Techniques, The Course For Home Study, Dresser Industries Inc., p. 22-32, 39-94, 102-129, 165-178.
11. Dwiyono, Imam F., and Sarju, W., 2014, Compilation Methods Water Saturation in Formation Evaluation.
Proceedings of the National Seminar on Earth 7 UGM, Yogyakarta.
12. Ellis, D V., and Singer, J M., 2008, Well Logging for Earth Scientist 2nd Edition, Springer, Netherlands. 13. Fahdie, M., et al., 2015, Well Formation Evaluation GJN for Determination of Initial Gas Reserves ( OGIP
) in the field " X " , National Seminar Scholars, Faculty of Earth and Energy Technology, Trisakti University.
14. Harsono, A., 1993, Log Evaluation, Schlumberger Data Services, Mulia Center L.17, Kuningan, Jakarta, p.19-21.
15. King, M.S., 1966, Wave Velocitities in Rocks as a Function of Changes in Overburden Pressure and Pore Fluid Saturants, Geophysics, 31.
16. King, M.S., 1970, Static and Dynamic Elastic Moduli of Rocks Under Pressure, Proc. 11th US Symp. On Rock Mechanics, Berkeley, California, p. 329-351.
18. Munadi, S., Triharjanto, B. & Rubiyanto, D., 1995, Estimation of Petrophysical Properties From Seismic Data : A New Hope Improvement Success Exploration, Proceeding Science Industrion VIII PPPTMGB “LEMIGAS”, Jakarta, 13-14 June, p. 9-19.
19. Munadi, S., Hermansyah, & Widarsono, B., 1996, Estimated Oil and Gas Saturation From seismic data : A conceptual approach, PIT XXI HAGI, Jakarta, Oktober.
20. Munadi, S., 2000, The Physics Aspect exploration Seismology, Geofisika UI, Jakarta, p.24-41.
21. Nuryanto, A., and Bagus, J S., 2014, Formation evaluation using Data Log and Core Data On Fields " X " East Java Basin Northern Section, Jurnal Sains and Seni Pomits Vol. 3, No. 2 Jurusan Fisika, FMIPA, Institut Teknologi Sepuluh Nopember (ITS), Surabaya.
22. Prawoto, A A., dkk., 2015, Hydrocarbon Potential Formation Air Benakat , Fields ' Ca ' , South Sumatra Basin, Bulletin Of Scientific Contribution, Volume 13, No 1, Fakultas Teknik Geologi Universitas Padjadjaran.
23. Putri, A., 2015, Analysis of Productive Zones determination and calculation of the initial oil reserves using data Logging on APR Field, Seminar Nasional Cendekiawan.
24. Rider, M., 2002, The Geological Interpretation of Well Logs. Second Edition,Sutherland, Skotlandia. 25. Schlumberger., 2007, Users Manual Interactive Petrophysics 3.4, PGL-Senergy, Scotland.
26. Telford, W.M.L.P. Geldart and Sheriff, R.E., 1990, Applied Geophysics, Second Edition, Cambridge University Press. Chap 4. p.147.
27. Wang, Z. & Nur, A., 1992, Elastic Wave Velocities in Porous Media: A Theoretical Recipe. in Seismic and Acoustic Velocities in Reservoir Rocks, Vol. 2: Theoretical Model, Chapter 1, SEG, Tulsa-USA, p.1-35. 28. Widarsono, B. & Saptono, F., 1997, The estimated porosity supports and fluid saturation of Seismic
ATTACHMENT
RHOB
1.7 2.7
NPHI
60 0
Oil
Gas
Oil
Oil
Gas
Oil Fluida?
Fluida?
Fluida? SP
-80 20
GR
0 200
Productive layer
Productive layer
Permeable layer
Productive layer
Productive layer
Permeable layer
0.2 LLS 2000 0.2 LLd 2000
Oil
Gas
Oil
Oil
Fluida?
Fluida?
Gas
Oil
Fluida?
-80 SP 20 0 GR 200
10 CAL 20
Permeable layer Permeable layer
Productive layer Productive layer
Productive layer
Productive layer
RHOB
1.7 2.7
NPHI
60 0
gas
Oil
SP
-80 20 GR
0 200
Productive layer
Permeable layer
Permeable layer Productive layer
FIGURE 3. The result of processing and interpretation log data in well OD-2: Gamma Ray (GAPI), SP (MV), RHOB (G/C3), NPHI (V/V)
Oil/Gas
Oil/Gas
0.2 LLS 2000
0.2 LLd 2000
Oil Gas -80 SP 20
0 GR 200
10 CAL 20
10 BS 20
Productive layer
Permeable layer
Productive layer
Permeable layer
Permeable layer
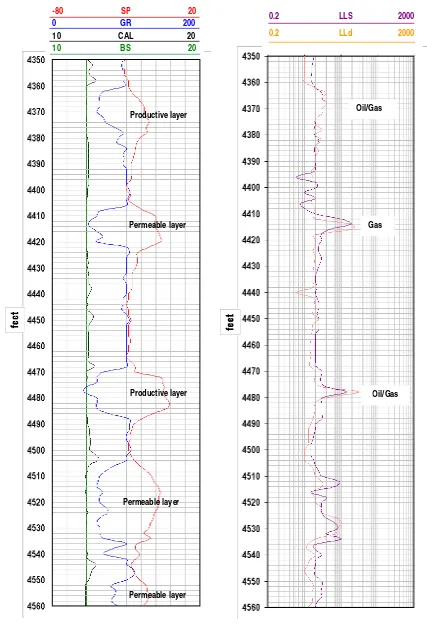
FIGURE 4. The result of processing and interpretation log data in well OD-2: Gamma Ray (GAPI), SP (MV), CAL (IN), BS (IN), LLS (ohm-m), LLd (ohm-m)
Oil/Gas
Gas
TABLE 1. well OD-1 porosity, before and after cross-plot using Chart Schlumberger CP-1b
TABLE 2. well OD-2 porosity, before and after cross-plot using Chart SchlumbergerCP-1b