DIVERSITY-BASED ATTRIBUTE WEIGHTING FOR K-MODESCLUSTERING
M Misbachul huda, Dian Rahma Latifa Hayun, and Annisaa Sri I.
Informatics Engineering, information Technology Department Institut Teknologi Sepuluh Nopember Surabaya, East Java, Indonesia
E-mail: [email protected], [email protected] Abstract
Categorical data is a kind of data that is used for computational in computer science. To obtain the information from categorical data input, it needs a clustering algorithm. There are so many clustering algorithms that are given by the researchers. One of the clustering algorithms for categorical data is k-modes. K-modes uses a simple matching approach. This simple matching approach uses similarity va-lues. In K-modes, the two similar objects have similarity value 1, and 0 if it is otherwise. Actually, in each attribute, there are some kinds of different attribute value and each kind of attribute value has different number. The similarity value 0 and 1 is not enough to represent the real semantic distance between a data object and a cluster. Thus in this paper, we generalize a k-modes algorithm for catego-rical data by adding the weight and diversity value of each attribute value to optimize categocatego-rical data clustering.
Keywords: categorical data, diversity, K-modes, attribute weighting.
Abstrak
Data Kategorial merupakan suatu jenis data perhitungan di ilmu komputer .Untuk mendapatkan infor-masi dari input data kategorial diperlukan algoritma klastering. Ada berbagai jenis algoritma klas-tering yang dikembangkan peneliti terdahulu. Salah satunya adalah K-modes. K-modes menggunakan pendekatan simple matching. Pendekatan simple matching ini menggunakan nilai similarity. Pada K-modes, jika dua objek data mirip, maka akan diberi nilai. Jika dua objek data tidak mirip, maka diberi nilai 0. Pada kenyataannya, tiap atribut data terdiri dari beberapa jenis nilai atribut dan tiap jenis nilai atribut terdiri dari jumlah yang berbeda. Nilai similarity 0 dan 1 kurang merepresentasi jarak antara sebuah objek data dan klaster secara nyata. Oleh karena itu, pada paper ini, kami mengembangkan algoritma K-modes untuk data kategorial dengan penambahan bobot dan nilai diversity pada setiap atribut untuk mengoptimalkan klastering data kategorial.
Kata Kunci: data kategorial, diversity, K-modes, pembobotan atribut.
1. Introduction
Computer science is always related to the data. All computational processes need data not only small data but also big data. There are two data types, they are numeric data and categorical data. Arithmetic process can be given to numeric data but it cannot be given to categorical data. Catego-rical data is used in some systems or applications. For example, categorical data in intrusion detec-tion systems, populadetec-tion data and customer infor-mation in online shopping. Example of categorical data in intrusion detection system is IP address. IP address in each data must be different and it can-not be arithmetically compared. It will be in popu-lation data and customer information, too. Popu-lation data has such categorical data like gender, blood type and home address. Costumer informa-tion, in online shopping, has such categorical data.
For example: the phone number and the used ba-nk. The categorical data clustering considers the similarity or dissimilarity between data. Similarity or dissimilarity can be considered by distance bet-ween the two data object. The shorter the distance between objects, the more similar the objects. Si-mple matching approaches can be used to calcu-late the distance. Example of simple matching ap-proach for categorical data is k-modes [7]. In in-trusion detection system, there is such new intru-sion that has not been known earlier. It needs a clustering algorithm to cluster and detect the new intrusion. Clustering is used to cluster population data and customer data to obtain the information needed, too.
The study [7], k-means and k-modes are joi-ned together to cluster numeric and categorical data. K-means is a clustering algorithm for nume-ric data. K-means clusters the data type that can
be arithmetically compared. Categorical data is a kind of data that cannot be arithmetically compar-ed each other. K-means cannot be uscompar-ed to cluster categorical data. To overcome the categorical da-ta, it uses k-modes algorithm. K-modes algorithm uses a simple matching approach to the process of matching dissimilarity clustering of data, replac-ing the means to modes. In k-means, to update a cluster centroid, it is used means formulae. On the other hand the k-modes, modes updating on the clustering process is determined by the frequency of occurrence of data so as to minimize the cost function.
In [3], K-modes algorithm is supposed to ha-ve some deficiencies. In K-modes, the two similar objects have similarity value 1, and 0 if it is oth-erwise. According to [3], a simple matching app-roach 0 and 1 are not good enough to represent the real semantic distance between a data object and a cluster. Thus, in [3] the authors proposed a range between 0 and 1 which represents the wei-ght of similarity. In [8], focused on optimizing the k-modes algorithm for clustering categorical data with the new dissimilarity approach using the rou-gh set membership. According to the research, the shortcoming of the simple matching approach is having a weak intra-similarity. To solve the issue, the dissimilarity approach (frequency-based) bet-ween the two objects in [8] takes into account to the distribution of universal attribute values. The study [1] explains that sometimes the occurrence of low frequency data and high frequency data ha-ve the same oha-verlap similarity value. With these problems, the study [1] approach takes into acco-unt to the similarity of the frequency distribution of the different attributes value to define the simi-larity between two categorical attribute values.
In addition, the dissimilarity approach taking into account the frequency distribution of differ-ent attribute values can also be applied to the opti-mization of categorical data dissimilarity [1]. For example, there are two data, AAABB and ABC-DD. If using the k-modes algorithm [8], both dis-similarity values are equal to 1. As we can see, the diversity level between the first data and the se-cond data is different because the quantity of each letter is different. Thus, in this paper, the research focuses on the k-modes clustering with diversity-based attribute weighting and the research contri-bution is distance values diversity to optimize the categorical data dissimilarity.
2. Methods
Categorical Data
Categorical variables represent types of data whi-ch may be divided into groups. Analysis of
cate-gorical data generally involves the use of data ta-bles. A two-way table presents categorical data by counting the number of observations that fall into each group for two variables, one divided into ro-ws and the other divided into columns.
There is no intrinsic ordering to the catego-ries in categorical data. For example, gender is a categorical variable having two categories (male and female) and there is no intrinsic ordering to the categories. Hair color is also a categorical va-riable having a number of categories (blonde, bro-wn, brunette, red, etc.) and again, there is no agreed way to order these from highest to lowest.
So that, computing the similarity and the dis-similarity between categorical data instances is not straightforward owing to the fact that there is no explicit notion of ordering between categorical values. To tackle this, there are some data-driven similarity measures that have been proposed for categorical data. In this section, we will describe the categorical data characteristics.
But first, we will define the notation used in later explanation. Let’s consider for a categorical data set D containing N objects, defined over a set of l attribute where 𝐴𝐴𝑖𝑖 denotes the ith attribute.
And let the ni be the number of values in each
at-tribute𝐴𝐴𝑖𝑖. The next notation used are following: 𝑓𝑓𝑖𝑖(𝑥𝑥) = the frequency of value 𝑥𝑥 lies on attribute cally invariant to the size of the data. Number of attributes, l. In [1] experiment showed that the nu-mber of attributes does affect the performance of the outlier detection algorithm.
The frequency of values taken by each attri-bute, ni. A data set may contain attributes that take
some values and attributes that only take a few va-lues. A similarity measure may ignore another at-tribute while finding the more importance attri-bute.
Similarity and Dissimilarity Measure for Cate-gorical Data in K-Modes
The classical theory of clustering in k-Modes, eit-her an element belongs to a cluster or it does not. The corresponding membership function is the characteristic function of the cluster that takes values 1 and 0. Suppose that there are 𝑥𝑥,𝑦𝑦 ∈ 𝐷𝐷, then the simple matching dissimilarity measure in k-Modes is defined following equation(3).
𝐷𝐷𝐷𝐷𝐷𝐷(𝑥𝑥,𝑦𝑦) = � 1,𝐷𝐷𝑓𝑓𝑥𝑥 ≠ 𝑦𝑦
0,𝑜𝑜𝑜𝑜ℎ𝑒𝑒𝑒𝑒𝑒𝑒𝐷𝐷𝐷𝐷𝑒𝑒 (3) With this concept, the distance between two objects computed often results in cluster with we-ak intra-similarity and disregards the similarity embedded in the categorical values [1].
Then, a new dissimilarity measure between the mode of a cluster and an object is introduced for the k-Modes Algorithm. To obtain such a clus-ter having the strong intra-similarity, the rough membership is used. It takes values between 0 and 1.
Taking account of the frequency of mode components in the current cluster, Ng et al. [2] in-troduced a valuable dissimilarity measure into the k-Modes clustering algorithm. Let 𝑃𝑃 ⊆ 𝐴𝐴 and 𝑎𝑎 ∈ 𝑃𝑃, then the Ng dissimilarity measure 𝐷𝐷𝐷𝐷𝐷𝐷𝑃𝑃(𝑧𝑧𝑙𝑙,𝑥𝑥𝑖𝑖) between a categorical object 𝑥𝑥𝑖𝑖 and the mode of a cluster 𝑧𝑧𝑙𝑙 with respect to P is defined as the following equation(4).
𝐷𝐷𝐷𝐷𝐷𝐷𝑃𝑃(𝑧𝑧𝑙𝑙,𝑥𝑥𝑖𝑖) = � 𝐷𝐷𝐷𝐷𝐷𝐷𝑎𝑎(𝑧𝑧𝑙𝑙,𝑥𝑥𝑖𝑖), 𝑎𝑎∈𝑃𝑃
where,
𝐷𝐷𝐷𝐷𝐷𝐷𝑎𝑎(𝑧𝑧𝑙𝑙,𝑥𝑥𝑖𝑖) = �1,𝐷𝐷𝑓𝑓1− 𝑚𝑚𝑓𝑓(𝑧𝑧𝑙𝑙,𝑎𝑎)≠ 𝑓𝑓(𝑥𝑥𝑖𝑖,𝑎𝑎), 𝑎𝑎,𝑜𝑜𝑜𝑜ℎ𝑒𝑒𝑒𝑒𝑒𝑒𝐷𝐷𝐷𝐷𝑒𝑒
where, 𝑚𝑚𝑎𝑎=
|{𝑥𝑥𝑖𝑖|𝑓𝑓(𝑥𝑥𝑖𝑖,𝑎𝑎) =𝑓𝑓(𝑧𝑧𝑙𝑙,𝑎𝑎),𝑥𝑥𝑖𝑖∈ 𝑐𝑐𝑙𝑙 }|
|𝑐𝑐𝑙𝑙| (4)
And |𝑐𝑐𝑙𝑙| is the number of objects in the lth cluster. For the k-Modes algorithm with Ng’s dis-similarity measure [2], the simple matching dissi-milarity measure is still used in the first iteration. So, Cao et al. in [3] proposed a new dissimilarity measure by using 𝑆𝑆𝐷𝐷𝑚𝑚𝑎𝑎(𝑥𝑥,𝑦𝑦) defined in equation (5).
𝑆𝑆𝐷𝐷𝑚𝑚𝑎𝑎(𝑥𝑥,𝑦𝑦) = 𝑓𝑓
(𝑥𝑥,𝑎𝑎)≡ 𝑓𝑓(𝑦𝑦,𝑎𝑎)
∑𝑧𝑧∈𝐷𝐷𝑓𝑓(𝑥𝑥,𝑎𝑎)≡ 𝑓𝑓(𝑧𝑧,𝑎𝑎) (5)
From the equation(5) formula [3] introduced that the new dissimilarity measure is defined as the following equation(6).
𝑁𝑁𝐷𝐷𝐷𝐷𝐷𝐷𝑃𝑃(𝑧𝑧𝑙𝑙,𝑥𝑥𝑖𝑖) = ∑𝑎𝑎∈𝑃𝑃𝑁𝑁𝐷𝐷𝐷𝐷𝐷𝐷𝑎𝑎(𝑧𝑧𝑙𝑙,𝑥𝑥𝑖𝑖) (6)
where,
𝑁𝑁𝐷𝐷𝐷𝐷𝐷𝐷𝑎𝑎(𝑧𝑧𝑙𝑙,𝑥𝑥𝑖𝑖) = 1− 𝑆𝑆𝐷𝐷𝑚𝑚𝑎𝑎(𝑧𝑧𝑙𝑙,𝑥𝑥𝑖𝑖) ×𝑚𝑚𝑎𝑎
As opposed to Ng’s dissimilarity measure, the similarity 𝑆𝑆𝐷𝐷𝑚𝑚𝑎𝑎(𝑧𝑧𝑙𝑙,𝑥𝑥𝑖𝑖) between object 𝑥𝑥𝑖𝑖and cluster 𝑧𝑧𝑙𝑙 is included in the proposed measure 𝑁𝑁𝐷𝐷𝐷𝐷𝐷𝐷𝑎𝑎(𝑧𝑧𝑙𝑙,𝑥𝑥𝑖𝑖). In [3] introduced a weighted
k-modes clustering algorithm, by considering that the similarity value between two objects is not al-ways 1, but it can be a value between 0 and 1. A pair of object 𝑥𝑥𝑖𝑖,𝑥𝑥𝑗𝑗 is considered more similar th-an the second pair(𝑥𝑥𝑠𝑠,𝑥𝑥𝑡𝑡), if and only if 𝑥𝑥𝑖𝑖and 𝑥𝑥𝑗𝑗 exhibit a less common attribute value match in the population. In other words, similarity among obje-cts could be decided by the un-commonality of their attribute value matches. Based on that, in [3] defined the “More Similar Attribute Set” of an at-tribute value 𝑎𝑎𝑗𝑗(𝑟𝑟) as the following equation(7).
𝑀𝑀�𝑎𝑎𝑗𝑗(𝑟𝑟)
�= {𝑎𝑎𝑗𝑗(𝑡𝑡)|𝑓𝑓�𝑎𝑎𝑗𝑗(𝑡𝑡)|𝐷𝐷� ≤ 𝑓𝑓(𝑎𝑎𝑗𝑗(𝑟𝑟)|𝐷𝐷)} (7) where 𝑓𝑓(𝑎𝑎𝑗𝑗(𝑡𝑡)|𝐷𝐷) is the frequency count of attribute
𝑎𝑎𝑗𝑗(𝑡𝑡) in the data set D. This is the set of attribute
values with lower or equal frequencies of occu-rrence than that of 𝑎𝑎𝑗𝑗(𝑟𝑟). Note that a value pair is
more similar if it has lower frequency of occur-rence. The weighting function in [3] is defined as equation(8).
𝜔𝜔�𝑎𝑎𝑗𝑗(𝑟𝑟)
�= 1− ∑ 𝑓𝑓(𝑎𝑎𝑗𝑗
(𝑡𝑡)
|𝐷𝐷)(𝑓𝑓�𝑎𝑎𝑗𝑗(𝑡𝑡)�𝐷𝐷�−1)
𝑛𝑛(𝑛𝑛−1) 𝑎𝑎𝑗𝑗(𝑡𝑡)
∈𝑀𝑀(𝑎𝑎𝑗𝑗(𝑟𝑟))
(8) where n is the frequency of objects in the data set D. If above function is used, less frequent values will make more contributions to the similarity va-lue.
Diversity Index and Variable Uniqueness
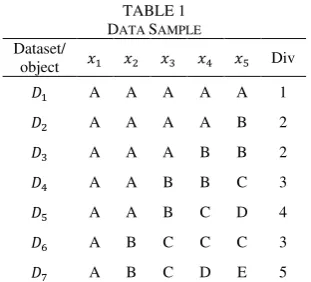
TABLE 1
concept used is using individual Simpson diver-sity index (will be explained in the next part). By using this information, it is noted that this algo-rithm cannot detect the diversity of data in data set. Let us see Table 1 as the data sample of coun-ting the dissimilarity between two objects. Let the number of attribute in the given data set is only 1, and the number of data set is 7. The number of object in a dataset is 5. From the table we have the diversity value (Div) as variable uniqueness sho-wn in the table.
The value of Div show us the number of dis-tinct value in a dataset. We assume that by using this Div value it will increase the dissimilarity between clusters based on the diversity of attribu-te value.
From the Table 1, we will get 1 as the value of dissimilarity because each data is different. But, as we can see in the real in each data, there are some similar data in it. But, they have differ-rent diversity. For AAAAA, the diversity value is 1 because there’s just a single object data. But for ABCDE, the diversity value is 5 because actually there are 5 different data. Based on this diversity, we propose a new method to count the dissimi-larity measure to count the distance between two distinct objects. We use this diversity value to de-crease the inter-similar cluster value.
Diversity index is formerly a concept in bio-logical area. It is a mathematical measure of spe-cies diversity in a community. Diversity indices provide more information about community com-position than simply species richness (i.e., the number of species present); they also take the re-lative abundances of different species into account [4]. Diversity indices provide important informati-on about rarity and comminformati-onness of species in a community. The ability to quantify diversity in th-is way th-is an important tool for biologth-ists trying to understand community structure.
One of the commonly used diversity index measures is Simpson Diversity Index (SDI). The basic concept of SDI represents the measurement of dissimilarity by frequency based. Simpson's
Di-versity Index is a measure of diDi-versity. In ecolo-gy, it is often used to quantify the biodiversity of a habitat. It takes into account the number of speci-es prspeci-esent, as well as the abundance of each spe-cies. Simpson's Index (D) measures the probabi-lity that two individuals randomly selected from a sample will belong to the same species (or some category other than species). The formula is defi-ned as below.
𝐷𝐷= ∑ 𝑛𝑛(𝑛𝑛 −1)
𝑁𝑁(𝑁𝑁 −1) (9)
where n is the total number of organisms of a par-ticular species, and N is the total number of orga-nisms of all species. Simpson's Index gives more weight to the more abundant species in a sample. The addition of rare species to a sample causes only small changes in the value of D [5]. In clus-tering theory, the property n can be defined as the number of object 𝑥𝑥𝑖𝑖 in a dataset D, and the pro-perty N can be defined as the number of all ob-jects in data set D.
Diversity-based Attribute Weighting for K-Modes Clustering
Taking into account of the intra and inter cluster information, we introduce the new dissimilarity measure in the equation(10).
𝐷𝐷𝐷𝐷𝐷𝐷𝑃𝑃�𝑥𝑥𝑖𝑖,𝑦𝑦𝑗𝑗�=𝑆𝑆𝐷𝐷𝑆𝑆𝑖𝑖
This formula is derived from the basic concept of probability count of object 𝑥𝑥𝑖𝑖 as
In order to count the dissimilarity between two objects 𝑥𝑥𝑖𝑖,𝑦𝑦𝑗𝑗 , we modify the above formula
as defined in equation(12). 𝐷𝐷𝐷𝐷𝐷𝐷𝑃𝑃�𝑥𝑥𝑖𝑖,𝑦𝑦𝑗𝑗�= 𝑁𝑁𝑁𝑁𝑥𝑥𝑖𝑖×
𝑁𝑁𝑦𝑦𝑗𝑗
TABLE 2
SCALABILITY EXPERIMENTAL RESULT
Pengujian Scalability
CLUSTERING EFFICIENCY RESULT
Voting Mushroom Soybean Average
Original
Figure 1. Scalability Graphic between original k-modes and diversity-based k-modes
where, 𝐷𝐷𝐷𝐷𝐷𝐷𝑃𝑃�𝑥𝑥𝑖𝑖,𝑦𝑦𝑗𝑗�is the dissimilarity of 𝑥𝑥𝑖𝑖,𝑦𝑦𝑗𝑗in attribute P, 𝑁𝑁𝑥𝑥𝑖𝑖is the number of object 𝑥𝑥𝑖𝑖in data set D, 𝑁𝑁𝑦𝑦𝑗𝑗is the number of object 𝑦𝑦𝑗𝑗in data set D and 𝑁𝑁is the number of data in data set D.
To increase the accuracy of clustering pro-cess, we add the Simpson diversity index that has defined in the previous to the formula above. Our new proposing dissimilarity measure is defined as the following equation(13).
where, 𝑆𝑆𝐷𝐷𝑆𝑆𝑖𝑖is simpson diversity index in data set D for object 𝑥𝑥𝑖𝑖, 𝑆𝑆𝐷𝐷𝑆𝑆𝑗𝑗is simpson diversity index in
data set D for object 𝑦𝑦𝑗𝑗, 𝐷𝐷𝐷𝐷𝐷𝐷is the number of category in data set D, 𝑁𝑁is the number of data in data set D.
3. Results and Analysis
In this part, we will discuss about the experiment-tal result of scalability and efficiency of clustering algorithms. It employs three different algorithms. In first part of this section, we will explain the ex-periment environment and evaluation index. In se-cond part, we will explain the experimental result of scalability of original k-modes and our propos-ed method. And in the last part, we will show the experimental result of clustering efficiency of four different modified k-modes algorithm include our proposed method.
Experiment Environment and Evaluation In-dex
The experiment was done in core i3 (1.4 GHz), 4GB RAM, and windows 8.1x64 based computer. The implementation of the algorithm uses Java as the programming language. To evaluate the accu-racy of the algorithm, we use the following equa-tion(14). the number of object that lies in the right cluster in 𝐶𝐶𝑖𝑖(1≤ 𝐷𝐷 ≤ 𝑘𝑘).
Scalability Evaluation
To compare the scalability of original k-modes and our proposed method, we use synthetic data with the variant number of objects between 10 and 5000. This synthetic data have 23 different at-tributes. To decrease the random effect of k-mo-des algorithm, we did 100 times experiment for every scenario.
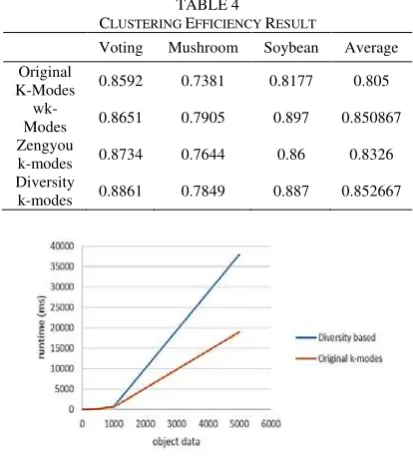
For each experimental result shown in Table 2, is the average value of the 100 times experi-mental result. From these experiments, we get a scalability graphic shown in Figure 1.
gi-ven data set. It is caused by added step to compute the diversity of the data set.
Clustering Efficiency Evaluation
In this section, to compare the efficiency cluste-ring algorithms, we use four different modified k-modes algorithm include our proposed method. They are Simple-Matching k-modes, Zengyou’s k-modes, wk-Modes and our new proposed me-thod diversity-based k-modes. We use tree differ-rent data set from UCI Machine Learning [6]. Table 3 shows the characteristic of the data set.
In experiments, the missing value is ignored. To decrease the random effect in k-modes, every experiment was conducted 100 times. Table 4 sh-ows the result of clustering efficiency evaluation between the four algorithms. Every value is the average of 100 times experiments result.
4. Conclusion
The k-modes algorithm is widely used for clus-tering categorical data. Dissimilarity and simila-rity measure play crucial rules in this area. In this paper the limitation of the former algorithm on the usage of between cluster information is solved by using simpson diversity index to extend the value of the intra similarity index. The experimental re-sult shows that our proposed algorithm give better result.
References
[1] Shyam Boriah, Varun Chandola, Vipin Ku-mar. Similarity Measures for Categorical Data: A Comparative Evaluation. Depart-ment of Computer Science and Engineering University of Minnesota. 2008s
[2] M.K. Ng, M.J. Li, Z.X. Huang, Z.Y. He, on the impact of dissimilarity measure in k-Mo-des clustering algorithm, IEEE Transactions on Pattern Analysis and Machine Intelli-gence 29 (3) (2007) 503–507.
[3] Zengyou He, Xiaofei Xu, Shengchun Deng. Attribute value weighting in k-modes cluster-ing. Elsevier. 2011
[4] M. Beals, L. Gross, and S. Harrell, http://ww w.tiem.utk.edu/~gross/bioed/bealsmodules/s hannonDI.html, 2000, retrieved June 1, 2014 [5] Offwell Woodland & Wildlife Trust http://
www.countrysideinfo.co.uk/simpsons.htm., 2000, retrieved June 1, 2014
[6] UCI Machine Learning Repository http://ww w.ics.uci.edu/mlearn/MLRepository.html, 2009, retrieved June 1, 2014.
[7] Huang, Z.J. Extension to the k-means algori-thm for clustering large data sets with catego-rical values. Data mining Knowledge Discov-ery, Vol. 2, No. 3, pp.283-304. 1998.