BASELINE HEALTH SURVEY 2007
Ni Ketut Aryastami1, Dwi Susilowati1, dan Yuslely Usman1
AbstrAct
background: Iodine Deficiency Disorder (IDD) reduction program has been implemented since 1976. According to the National Economic Survey 2002, the average consumption of iodized salt was 6.26 grams. The results of Iodine Salt Survey (SGY) 2003 showed that the consumption of iodine salt at the household level was 73.2%, meanwhile, the baseline health survey (Riskesdas) 2007 showed there was reduction of iodine salt consumption towards 60.2%. Methods: Type of study was secondary data analysis with cross-sectional design utilizing the Riskesdas 2007’s data. Sample was selected purposively according to the previous SGY’s survey based on the endemically criteria namely highly endemic, mediocre and non endemic. results: The results of the analysis were there was discrepancy of iodine salt consumption among urban and rural areas as well as mother’s education level. The iodine salt consumption was higher in the urban area (65.5%) compare to the rural area (52.9%). The higher the education of mothers the better the iodine salt consumed. The usage of iodine salt in the households based on salt quick test was 60.2%, meanwhile, according to the salt titration it was only 23.4%. The results of Excretion Iodine Urine showed that the iodine intake among the school children (age of 6–12 years old) was 12.8% and was still below the cut-off point prevalence, which is greater than 50%. The conclusion of this analysis is that there was evidence of iodine salt reduction consumed at the household level. Conversely, there was inclination of the percentage of iodine urine level among the school children in Indonesia in the year 2007. It is recommended that policy analysis need to be conducted due to the achievement of the Universal Salt Iodization target, especially in the endemic areas to asses the existence of the IDD prevalence.
Key words: Iodine salt at the households, Iodine salt consumption, urine iodine excretion
AbstrAK
Program penurunan prevalensi gangguan akibat kekurangan yodium (GAKY) sudah dimulai sejak tahun 1976. Menurut hasil Susenas, hingga tahun 2002 rata-rata konsumsi garam beryodium perkapita perhari mencapai 6,26 gram. Hasil survei garam yodium (SGY) 2003 menyatakan bahwa penggunaan garam beryodium di tingkat rumah tangga sudah mencapai 73,2%, sementara hasil Riskesdas 2007 menunjukkan penurunan konsumsi menjadi 60,2%. Jenis studi adalah analisis data sekunder Riset Kesehatan Dasar (Riskesdas) dilakukan dengan memanfaatkan data Riskesdas 2007, dengan disain studi potong lintang. Sampel dipilih secara purposive yakni rumah tangga dari 30 kabupaten/kota yang tercakup dalam survei sebelumnya (SGY 2003), berdasarkan kriteria endemisitas wilayah: berat, sedang dan non endemik. Hasil analisis menunjukkan, terjadi perbedaan tingkat konsumsi garam beryodium antarperdesaan dan perkotaan dan tingkat pendidikan ibu. Konsumsi garam beryodium lebih tinggi di wilayah perkotaan (65,5%) daripada perdesaan (52,9%). Makin tinggi tingkat pendidikan ibu, makin tinggi persen penggunaan garam beryodium di rumah tangga. Penggunaan garam beryodium di rumah tangga berdasarkan tes garam cepat baru mencapai 60,2%; sedangkan menurut uji titrasi garam baru mencapai 23,4%. Hasil titrasi urin menunjukkan tingkat asupan yodium pada anak sekolah telah mencapai target. Proporsi anak usia 6–12 tahun yang memiliki kandungan yodium dalam urin mencapai 12,8% dan masih berada di bawah angka kesepakatan internasional untuk masalah kekurangan yodium (bila kandungan yodium urin > 50%). Kesimpulan dari analisis ini adalah terjadi penurunan tingkat konsumsi garam beryodium rumah tangga, tetapi sebaliknya, terjadi peningkatan kadar yodium urin anak sekolah di Indonesia pada tahun 2007. Rekomendasi penelitian adalah perlu adanya pengkajian kebijakan tentang pencapaian target Universal Salt Iodization (USI) dan penelitian khusus untuk wilayah endemik untuk melihat angka prevalensi GAKY.
Kata kunci: Konsumsi garam beryodium, kadar yodium urin
INTRODUCTION
Programs inducing the prevalence of IDD through salt iodization have been developed in 1976. The goal of the program is to achieve the target of iodine salt consumption (30–80 ppm) covering 90% of the households. According to the National Socio-economic Survey 2002, the average consumption of iodine per-capita per-day was 6.25 grams. The following ‘salt’ survey conducted by the Ministry of Health in 2003 found that the iodine salt consumption achieving 72.8% of the households.
The high prevalence of Iodine Deficiency Disorders (IDD) in Indonesia leads the Indonesian government intensively support the IDD’s prevention programs since 1976. Some efforts had already terminated due to the significant prevalence reduction, for example lipiodol injection, and others continuously been implemented through salt fortification as well as monitoring to the iodine salt consumption over the community. As a result, the IDD prevalence has reducing significantly after almost 20 years of program implementation. In the year 1994 the President Statement number 69 launched mentioning that all of the salt consumption distributed over the country has to contain appropriate Iodine (1).
Riskesdas 2010, a national baseline health survey provides the information of iodine content in salt consumption. The assessments were done through direct salt quick test, laboratory salt titration, as well as urine titration to examine the iodine content of school children aged of 6–12 year old (2). For the two later methods, especially, the sample was selected purposively within 30 districts adopting the previous salt survey sampling frame (3).
The objective of this analysis is to understand the percentage of iodine salt consumption in the households, comparing the results of the salt quick test, salt titration as well as urine intake excretion of the school children.
METHODS
Type of research is secondary data analysis of Riskesdas 2010, with the study design of cross-sectional design. Place and time of analysis is in Jakarta, taking the data of the 30 districts that had been selected purposively implementing the previous sampling frame of salt survey 2003.
The households sample of Riskesdas 2007 involving the core sample of Susenas 2007, including 280,000 households. Each household has a border line called census block (BS). The salt quick test data was collected from all of households’ samples; however, salt titration and urine test were only involving the thirty districts. The selection of the 30 districts was purposively implementing the salt survey (SGY) sampling frame, done in the year 2003 based on the criteria endemic ties as well as the frequency of iodine salt consumed namely highly endemic, mediocre and non endemic. Unfortunately, the numbers of districts analyzed in this paper were 27 out of 30 districts involved in Riskesdas 2007.
Indicators of iodize salt consumption include the variables of keeping and using salt in the household, quick salt test assessment’s result, salt titration, and urine test of school children. Instruments and the way of data collectedrefered to the Riskesdas 2007.
Materials and methods namely salt quick test gotten from the direct field test through two drops of Kalium Yodat solution (brand of Povidon, produced by Kimia Farma) over two table spoons of salt taken from the household salt container. The test results indicates: no iodine content (no change color of the sample salt, or it changes the color slightly and gone after second), improper iodine content (color of light blue), and enough iodine (color of dark blue). Laboratory salt titration informed of iodine content in the salt sample with a continuous number and cut-off point of > = 30 ppm.Univariatae analysis was implemented to compare the results using SPSS version 15.0.
RESULTS
Characateristic of salt consumption of the households
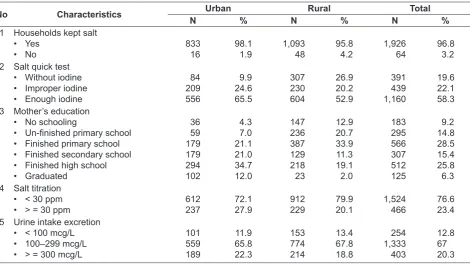
Most of the households interviewed have and kept salt in their households, either in the urban or rural areas, achieving 96.8%. The salt quick test analysis showed 58.3% of the households’ salt having proper iodine (> = 30 ppm). There was percentage difference on iodine salt used between urban (65.5%) and rural (52.9%) as can be seen at table 1.
in the households based on mother’s education characteristics. Salt quick test results showed the proportion salt with enough iodine was higher in the urban area compare to the rural area. Consistently, proportion of improper iodine content was also higher at the urban area. Almost one fifth of the household’s salt contain no iodine.
Titration analysis results showed lower percentage. The percentage of salt with proper iodine (³ 30 ppm) used in the households was 23.4%, and, are higher in the urban area (27.9%) than in the rural (20.1%).
The analysis towards the urine titration showed that urine intake excretion (UIE) of the school children was quite good. Only 13% of the school children did consume less than100 mcg/L iodine.
Iodine content in salt based on salt quick test, salt titration and iodine urine excretion assay
The salt examination implemented to the Riskesdas 2007, called salt quick test that is two drops of KIO3 solution on two spoons salts sample; salt titration and urine’s iodine examination in the laboratory. Based on those methods, it was given the information of percent
iodine content in the samples specimens. The cut-off points were different according to the tests. The quick salt test results indicated by changing in salt color after the test implemented from nothing to dark blue (enough iodine); the salt titration’s cut-off is ³ 30 ppm; meanwhile the urine intake excretion (UIE) cut-off is 100–299 mcg/L.
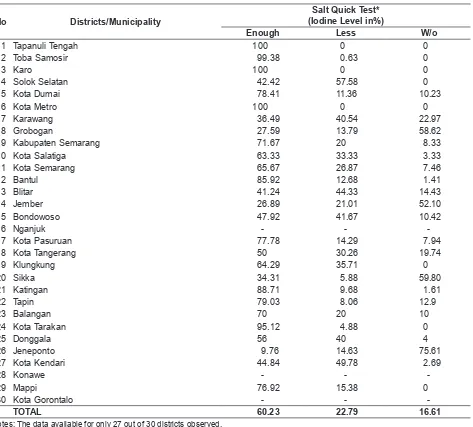
Based on the salt quick test result, the analysis found as much as 60.23% households consumed salt with enough iodine. The highest percentage revealed in Tapanuli Tengah, Karo district and Metro municipality, where a hundred percent of the salt treated by iodine; followed by Toba Samosir district (99.38%), Tarakan municipality (95.12%), Katingan district (88.71%) and district of Bantul (85.92%). Ten out of thirty districts’ population have consumed salt without enough iodine.
Table 2 showed that almost 40% of the salt consumed has no iodine according to the program’s standard of Indonesia National Standard (SNI). The districts that were still lacking iodine in salt were Grobogan, Jember, Sikka and Jeneponto.
Table 1. Iodine content in salt based on some characteristics
No Characteristics Urban Rural Total
N % N % N %
1 Households kept salt • Yes 2 Salt quick test
• Without iodine • Improper iodine • Enough iodine
84
• Un-finished primary school
• Finished primary school • Finished secondary school • Finished high school • Graduated 5 Urine intake excretion
Table 2. Iodine content in salt based on salt quick test (Riskesdas 2007)
No Districts/Municipality
Salt Quick Test* (Iodine Level in%)
Enough Less W/o
1 Tapanuli Tengah 100 0 0
2 Toba Samosir 99.38 0.63 0
3 Karo 100 0 0
4 Solok Selatan 42.42 57.58 0
5 Kota Dumai 78.41 11.36 10.23
6 Kota Metro 100 0 0
7 Karawang 36.49 40.54 22.97
8 Grobogan 27.59 13.79 58.62
9 Kabupaten Semarang 71.67 20 8.33
10 Kota Salatiga 63.33 33.33 3.33
11 Kota Semarang 65.67 26.87 7.46
12 Bantul 85.92 12.68 1.41
13 Blitar 41.24 44.33 14.43
14 Jember 26.89 21.01 52.10
15 Bondowoso 47.92 41.67 10.42
16 Nganjuk - -
-17 Kota Pasuruan 77.78 14.29 7.94
18 Kota Tangerang 50 30.26 19.74
19 Klungkung 64.29 35.71 0
20 Sikka 34.31 5.88 59.80
21 Katingan 88.71 9.68 1.61
22 Tapin 79.03 8.06 12.9
23 Balangan 70 20 10
24 Kota Tarakan 95.12 4.88 0
25 Donggala 56 40 4
26 Jeneponto 9.76 14.63 75.61
27 Kota Kendari 44.84 49.78 2.69
28 Konawe - -
-29 Mappi 76.92 15.38 0
30 Kota Gorontalo - -
-TOTAL 60.23 22.79 16.61
Notes: The data available for only 27 out of 30 districts observed.
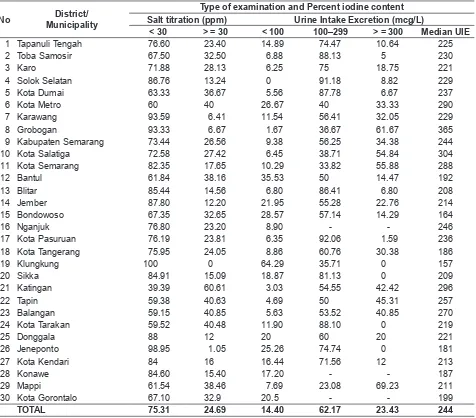
Based on the salt titration results, only 24.69% salt consumption contain enough iodine (³ 30 ppm). Indonesian National Standard has the iodine content of 30–80 ppm KIO3). In other word, 75.31% of the salt consumed had not enough iodine according to SNI. The golden value of salt titration compare to salt quick test is that the former has higher specificity; especially the quick salt test is influenced by the enumerator subjectivity.
Table 3 showed that only 14.4% of the school children (aged 6–12 years old) has UIE lower than 100 mcg/L. Urine Intake Excretion is an indicator that
can be used to show the level of current iodine intake. If more than 50% of school children have iodine urine less than 100 mcg/L indicates lack of iodine intake in the population (5).
DISCUSSION
Salt enriched the taste of food and people need only a small amount of it. Salt is cheap and salt is considered as a good vehicle for iodine distribution for the community. Usually salt were found in most households. The higher percentage of iodine salt consumption in the urban area is understandable, because the urban population has better education, and awareness of the iodine function in the body, indeed they have better access of information. In addition, the urban population has also more choice and variant when the iodine salt is not available in the
small outlet for example, they can just go to the higher store or supermarket to get the proper item. This situation is one among other reasons why the urban population has better consumption in iodine salt.
Salt titration results also showed that iodine level in the urban area is better than rural area. Nevertheless, the urine titration result showed that either in urban or rural areas the percentage of iodine content in urine excretion of the school children had similar results.
WHO recommended that USI should be achieved (i.e. at least 90% of the households had sufficient
Table 3. Percent iodine content for salt titration and urine intake excretion
No District/
Municipality
Type of examination and Percent iodine content Salt titration (ppm) Urine Intake Excretion (mcg/L)
< 30 > = 30 < 100 100–299 > = 300 Median UIE
1 Tapanuli Tengah 76.60 23.40 14.89 74.47 10.64 225
2 Toba Samosir 67.50 32.50 6.88 88.13 5 230
3 Karo 71.88 28.13 6.25 75 18.75 221
4 Solok Selatan 86.76 13.24 0 91.18 8.82 229
5 Kota Dumai 63.33 36.67 5.56 87.78 6.67 237
6 Kota Metro 60 40 26.67 40 33.33 290
7 Karawang 93.59 6.41 11.54 56.41 32.05 229
8 Grobogan 93.33 6.67 1.67 36.67 61.67 365
9 Kabupaten Semarang 73.44 26.56 9.38 56.25 34.38 244
10 Kota Salatiga 72.58 27.42 6.45 38.71 54.84 304
11 Kota Semarang 82.35 17.65 10.29 33.82 55.88 288
12 Bantul 61.84 38.16 35.53 50 14.47 192
13 Blitar 85.44 14.56 6.80 86.41 6.80 208
14 Jember 87.80 12.20 21.95 55.28 22.76 214
15 Bondowoso 67.35 32.65 28.57 57.14 14.29 164
16 Nganjuk 76.80 23.20 8.90 - - 246
17 Kota Pasuruan 76.19 23.81 6.35 92.06 1.59 236
18 Kota Tangerang 75.95 24.05 8.86 60.76 30.38 186
19 Klungkung 100 0 64.29 35.71 0 157
20 Sikka 84.91 15.09 18.87 81.13 0 209
21 Katingan 39.39 60.61 3.03 54.55 42.42 296
22 Tapin 59.38 40.63 4.69 50 45.31 257
23 Balangan 59.15 40.85 5.63 53.52 40.85 270
24 Kota Tarakan 59.52 40.48 11.90 88.10 0 219
25 Donggala 88 12 20 60 20 221
26 Jeneponto 98.95 1.05 25.26 74.74 0 181
27 Kota Kendari 84 16 16.44 71.56 12 213
28 Konawe 84.60 15.40 17.20 - - 187
29 Mappi 61.54 38.46 7.69 23.08 69.23 211
30 Kota Gorontalo 67.10 32.9 20.5 - - 199
TOTAL 75.31 24.69 14.40 62.17 23.43 244
iodine within their salt) by the year 2010, which was last year (ref xxx). According to the analysis’, until year 2007, there were only 5 out of 30 districts/ municipalities that reached the target, i.e. Tapanuli Tengah, Toba Samosir, Karo as well as Metro and Tarakan municipalities. There are many things has to be done by the government when the Universal Salt Iodization (USI) wants to be achieved (6, 7).
Results of this analysis can be utilized as for the based point by the government to develop further program; for example, what was the problem and why are there difference achievements among districts? In conversely, when there was inclination in the other districts, especially the districts whose USI’s has achieved, what was the trigger? Later, reward system need to be developed due to the decentralization era, so that competitive challenge among districts/ municipalities is expected to have a positive impact in stimulating the community health status. Indeed, to respect the decision that has been stated by the central government that belongs to all stake holders toward globalization.
Political commitment in policy implementation is an important point of all stake holders in the effort of gaining healthy community. Iodine salt policy that has been legalized through President’s Statement has to have best implication. Lacking of quality in monitoring by the government as well as lacking in iodine salt distribution has to be more concerned and maintained (8).
Each sector has to do monitoring and evaluation accordingly to its capacity. For example, Ministry of Industry and Trade that has been developing and launching the national quality standard (SNI), should have monitoring system that has never stopped monitoring the salt quality from the producer level to distributor and retailer. Ministry of Internal Affair, on the other hand, needs to be consistently monitoring laws and decrees implementation (e.g. President’s Statement about iodine salt consumption) up until district level. In addition, the local government and justice should monitored laws implementation, such as ‘Perda’, ‘UU’ No. 23/1992 about health, ‘UU’ No. 7/1996 about food stuff, ‘UU’ No.8/1999 about consumer protection, ‘PP’ No. 69/1999 about labeling and food adds. President’s Statement No. 69/1994 about iodine salt production and labeling. Indonesian Food and Drugs Administration Agency regularly and continuously do food examination, so that there
would be no illegal salt sold for consumption. Finally Ministry of Health do its function to monitor the community health status, in this matter, monitoring the prevalence of diseases related to iodine problems/ disorders.
There still problem in target achievement of iodine salt consumption. There are four districts (Grobogan, Jember, Sikka and Jeneponto) that more than half of the salt consumed by the community was not containing iodine properly according to the salt quick test. Salt titration result showed even worse. Only one out of 30 districts having greater percentage than 50% of households consuming salt with enough iodine that is Katingan District. In Klungkung district (Bali province), considered as salt producing district, all of the salts titrated having less than 30 ppm of iodine. Regarding to this results, it is worth to consider a study of analyzing the quality of salt and its iodine content. It is probable that iodine was there in the salts, but, quantification is the important point for the quality issue. Another thing is about program monitoring and sanction for the deviation of the quality standard, especially when the commitment of Universal Salt Iodization. There should be a followed-up action for the sectors integration; for example, what should be taken when the behavior of the community can not be change, albeit they understand they use un-iodize salt. Their preferences using the local ‘non-iodine’ salt just because the salt has already well-known, and their habitual. In this case, it has to be suppressing efforts by the local government to make a guarantee that the salt quality is adjusted to the national salt standard.
Given the results of this analysis is excellent, especially in looking at the UIE median, the policy of achieving the USI still far from the government target. Therefore, need to do evaluation either USI still be targeted, considering that the gaps is still quite wide (30%); or need policy revision? Furthermore there has to be a relevant reasons if the USI need to be extended; for example, to maintain the intelligential points of the children in-spite of preventing the prevalence of IDDs problems.
Conclusion
There was still gap in distribution between iodine salt consumption according to education level and urban-rural. The higher the education level the more the iodize salt consumed. The percentage iodine salt consumed is higher in urban than the rural community. The data showed that the current intake of iodine at the school children has appropriately fulfilled and met the standard of 100–299 mcg/L. The proportion of EYU less than 100 mcg/L was only 12.8% which is much lesser than the cut of point of 50%. Ironically, the data confirms that the wide gaps occurs in Klungkung district which more than a half of the school children having Iodine level in their urine for less than the standard.
The consumption of iodize salt at the household had decreasing compared to the 2003 survey. More than half of the district/municipality declined the percent consumption of the iodize salt with the proper iodine level.
Salt titration results showed that the iodine content of the salt titrated was only one fourth. This results much differ compare to the results of the salt quick test.
Recommendation
The socialization of iodine salt consumption need to be strengthen through policy empowerment especially at the district level, based on the evidence that there still a wide gaps of iodine consumption by urban-rural and education. Although EYU titration showed that the iodine level of the school children has already been appropriate, the use of the iodine salt need to be maintain as iodine has contribution to the IQ points.
There is a need to conduct a qualitative survey to answer why the consumption level of iodize salt
reducing. What determinants may influence this situation and what maybe the impact of this situation in the future.
Standardization for the titration assessment need to be implemented either the equipments, reagens, or maybe the laborants. The usage of the KIO3 solution in the community can easily implemented with a valid results. Therefore, the KIO3 solution has to be easily available and affordable in the community, so that control and monitoring can olso be done by the community for the sake of the Intellegintia quality of the children and community.
A special survey need to be design to assess the IDD prevalence and the iodine salt consumption, as well as to find a proper method to combat the IDD problem. For example, Klungkung district is consider encemic to IDD, evendyhough it is actually sea-salt producer district. Unfortunately the Riskesdas data has limitation on information of IDDs prevalence, irrespective to the iodine salt consumption.
REFFERENCE
Badan Litbang Departemen Kesehatan RI. Riset Kesehatan Dasar 2007: Pedoman Pengisian Kuesener. Jakarta, 2007.
Biro Pusat Statistik, Departemen Kesehatan dan Bank Dunia. Laporan hasil survei konsumsi garam yodium rumah tangga 2003: Garam yodium agar anak pintar. Jakarta, 2003.
Badan Litbang, Departtemen Kesehatan Republik Indonesia. Laporan Nasional Riset Kesehatan Dasar 2007. Jakarta, Desember 2008.
Departemen Kesehatan Republik Indonesia. Rencana aksi nasional kesinambungan program penanggulangan gangguan akibat kurang yodium. Jakarta, 2005.
Final report technical assistance for evaluation on intensified iodine deficiency control project (IIDC). IBRD Loan
No. 4125-IND. Contrct number: HK.00.0.64.00.1672, June 30, 2003.
Gizi.net. Kamis 23 Januari 2003. http//www.gizi.net/cgi-bin/berita/fullnews.cgi?newsid1043213526,48231, 7 Oktober 2008.
Keputusan Presiden RI Nomor 69/1994 tentang Pengadaan Garam Rakyat.