CHAPTER IV RESULT OF THE STUDY
This chapter discusses the data which had been collected from the research in the field of study. The data are the result of experiment and control class, the result of
post test experiment and control class, and the result of data analysis. A. Description of the Data
1. The result of Pre Test, Post Test and the Comparison of Students’ Speaking Score of the Control and Experiment Class
The pre test was conducted to the first experiment class in speaking class C on
April 20th 2016, at 07.30 am and the post test was conducted to the first experiment class in speaking class C on May 25th 2016, at 07.00 am Then the control class was given pre test in speaking class D on April 20th 2016, at 09.30 am. Then the control
class was given post test in speaking class D on May 25th 2016, at 09.00 am. The following table 4.1 of summarizes the pre test and post test score of both classes.
Based on the result of research in Speaking Class D as control class, the
highest pre test score of students control class is 68 and the lowest score of control class is 48 with sum of the data is 1108, mean is 58.32 with standard deviation is
5.218.
In contrary, the result of research in Speaking Class D as control class, the
highest post test score of students control class is 80 and the lowest score of control class is 60 with sum of the data is 1388, mean is 73.05 with standard deviation is 6.778.
Based on the result of research in Speaking Class C as experiment class, the highest pre test score of students in experiment class is 76 and the lowest score of
experiment class is 60 with sum of the data is 1180, the mean is 69.41 with standard deviation is 4.229.
In contrary, the highest score of experiment class for the post test is 88 and the
lowest score of experiment class is 72 with sum of the data is 1384, the mean is 81.41 with standard deviation is 4.887.
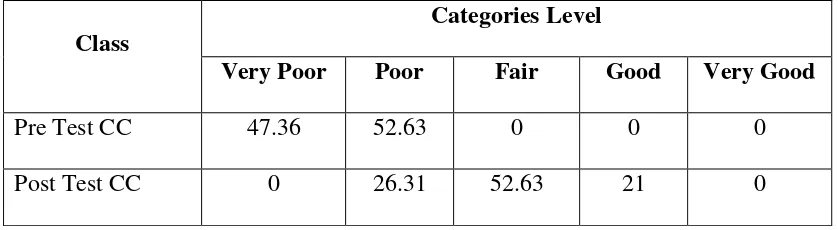
Table 4.2 Frequency Distribution of the Pre Test and Post Test of Speaking Score of the Control Class and Experiment Class
Class
Categories Level
Very Poor Poor Fair Good Very Good
Pre Test CC 47.36 52.63 0 0 0
Pre Test EC 0 52.91 47.05 0 0
Post Test EC 0 0 29.41 70.58 0
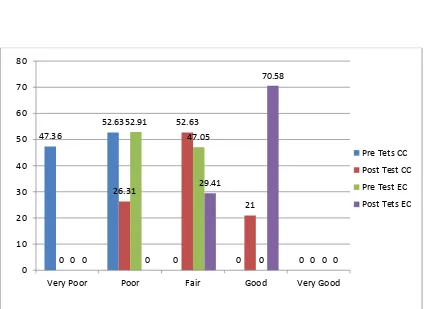
Figure 4.1 Frequency Distribution of the Pre Test and Post Test Speaking Score of the Control Class and Experiment Class
Figure 4.1 shows that the pre test and post test of students’ speaking score in
control class and experiment class. It can be seen that for the pre test in control class there are 10 students who got 52,63 as poor level, there are 9 students who got 47,36
as very poor level. For the post test in control class there are 5 students who got 26,32
47.36
52.63
0 0 0
0 26.31 52.63 21 0 0 52.91 47.05
0 0
0 0
29.41 70.58 0 0 10 20 30 40 50 60 70 80
Very Poor Poor Fair Good Very Good
Pre Tets CC
Post Test CC
Pre Test EC
as poor level, 10 student s who got 52,63 as fair level and 4 students who got 21,00 as
good level. For the pre test in experiment class there are 9 students who got 52,94 as poor level, there are 8 students who got 47,05 as fair students. For the post test in
experiment class there are 5 student who got 29,41 as fair level and 12 students who got 70,58 as good level.
2. The result of Pre Test, Post Test and the Comparison of Students’ Motivation Score of the Control and Experiment Class
To know the students’ motivation, the writer used questionnaire. The
questionnaire was given both before and after the treatment. For the experiment class in speaking class C on April 20th 2016, at 07.30 am before treatment, and it was given
to the first experiment class in speaking class C on Mei 25th 2016 after the treatment, at 07.00 am. Then the control class was given the questionnaire in speaking class D
on April 20th 2016, at 09.30 am. Then the control class was given the questionnaire in speaking class D on Mei 25th 2016, at 09.00 am. The following table 4.2 summarizes
the pre test and post test score of both classes.
Based on the result of writer in Speaking Class D as control class, the highest pre test score of students control class is 72 and the lowest score of control class is 56
with sum of the data is 1208, mean is 63.47 with standard deviation is 5.420.
In contrary, the result of writer in Speaking Class D as control class, the highest post test score of students control class is 76 and the lowest score of control
class is 58 with sum of the data is 1279, mean is 67.32 with standard deviation is 5.726.
Based on the result of writer in Speaking Class C as experiment class, the highest pre test score of students in experiment class is 71 and the lowest score of
experiment class is 55 with sum of the data is 1022, the mean is 60.12 with standard deviation is 3.839.
In contrary, the highest score of experiment class for the post test is 83 and the
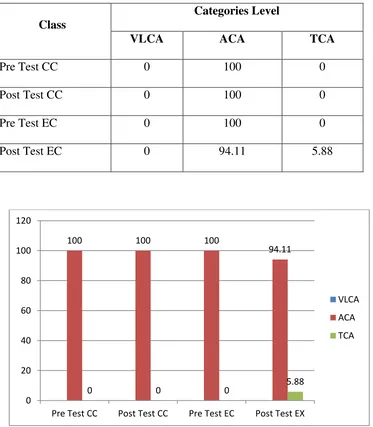
Table 4.4 The Frequency Distribution of the Pre Test and Post Test of Student’ Motivation Score of the Control Class and Experiment Class
Class
Categories Level
VLCA ACA TCA
Pre Test CC 0 100 0
Post Test CC 0 100 0
Pre Test EC 0 100 0
Post Test EC 0 94.11 5.88
Figure 4.2 Frequency Distribution of the Pre Test and Post Test of Student’ Motivation Score of the Control Class and Experiment Class
100 100 100
94.11
0 0 0 5.88
0 20 40 60 80 100 120
Pre Test CC Post Test CC Pre Test EC Post Test EX
VLCA
ACA
Figure 4.2 shows that the pre test and post test for of students’ motivation
score in control class and experiment class. It can be seen that for the pre test in control class there are 17 students who got 100 as ACA level. For the post test in
control class there are 17 students who got 100 as ACA level. For the pre test in experiment class there are 17 students who got 100 as ACA level. For the post test in
experiment class there are 16 students who got 94.11 as ACA level and there was 1 student who got 5.88 as TCA level.
B. Testing Normality and Homogeneity 1. Normality Test
In this study, writer used One-Sample Kolmogorow-Smirnov Test to test the normality.
a. Testing of normality speaking ability of pre test control and experiment class
Table 4.5 Testing of Normality one-sample Kolmogorov-Smirnov Test One-Sample Kolmogorov-Smirnov Test
Control Experiment
N 19 17
Normal Parametersa,b Mean 58.32 69.41
Std. Deviation 5.218 4.229
Most Extreme Differences
Absolute .153 .200
Negative -.153 -.200
Kolmogorov-Smirnov Z .666 .826
Asymp. Sig. (2-tailed) .766 .502
a. Test distribution is Normal. b. Calculated from data.
Based on the calculation used SPPS program, the asymptotic significance
normality of control class was 0.776 and experiment class was 0.502. Then the normality both of class was consulted with table of Kolmogorov-Smirnov with the level of significance 5% (=0.05). Because asymptotic significance of control =
0.776 =0.05, and asymptotic significance of experiment = 0.502 = 0.05. It
could be concluded that the data was normal distribution.
b. Testing of normality students’ motivation for pre test of control class and
experiment class.
One-Sample Kolmogorov-Smirnov Test
Control Experiment
N 18 17
Normal Parametersa,b Mean 62.61 60.12
Std. Deviation 3.534 3.839
Most Extreme Differences
Absolute .120 .194
Positive .120 .194
Negative -.109 -.114
Kolmogorov-Smirnov Z .510 .801
Asymp. Sig. (2-tailed) .957 .542
a. Test distribution is Normal. b. Calculated from data.
Based on the calculation used SPPS program, the asymptotic significance
normality of control class was 0.957 and experiment class was 0.834. Then the normality both of class was consulted with table of Kolmogorov-Smirnov with the level of significance 5% (=0.05). Because asymptotic significance of control =
0.957 =0.05, and asymptotic significance of experiment = 0.542 = 0.05. It
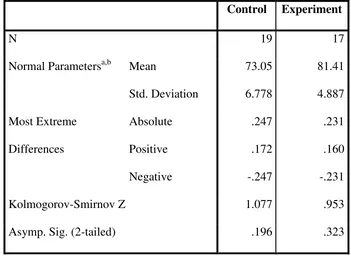
c. Testing of normality speaking ability of post test control and experiment class Table 4.7 Testing of normality speaking ability of post test control and
experiment class
One-Sample Kolmogorov-Smirnov Test
Control Experiment
N 19 17
Normal Parametersa,b Mean 73.05 81.41
Std. Deviation 6.778 4.887
Most Extreme Differences
Absolute .247 .231
Positive .172 .160
Negative -.247 -.231
Kolmogorov-Smirnov Z 1.077 .953
Asymp. Sig. (2-tailed) .196 .323
a. Test distribution is Normal. b. Calculated from data
Based on the calculation used SPPS program, the asymptotic significance
normality both of class was consulted with table of Kolmogorov-Smirnov with the level of significance 5% (=0.05). Because asymptotic significance of control =
0.196 =0.05, and asymptotic significance of experiment = 0.323 = 0.05. It
could be concluded that the data was normal distribution.
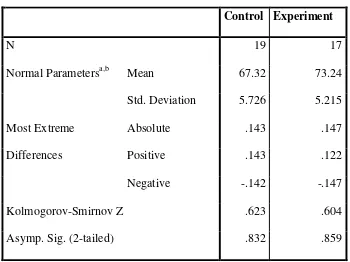
d. Testing of normality students’ motivation for post test of control class and
experiment class
Table 4.8 Testing of normality students’ motivation for post test of control class
and experiment class
One-Sample Kolmogorov-Smirnov Test
Control Experiment
N 19 17
Normal Parametersa,b Mean 67.32 73.24
Std. Deviation 5.726 5.215
Most Extreme
Differences
Absolute .143 .147
Positive .143 .122
Negative -.142 -.147
Kolmogorov-Smirnov Z .623 .604
a. Test distribution is Normal.
b. Calculated from data.
Based on the calculation used SPPS program, the asymptotic significance
normality of control class was 0.832 and experiment class was 0.859. Then the normality both of class was consulted with table of Kolmogorov-Smirnov with the level of significance 5% (=0.05). Because asymptotic significance of control =
0.832 =0.05, and asymptotic significance of experiment = 0.859 = 0.05. It
could be concluded that the data was normal distribution. 2. Homogeneity Test
In this study, writer used Levene Test Statistic to test the homogeneity of variance.
Test of Homogeneity of Variances
Levene Statistic df1 df2 Sig.
.954 3 68 .420
Based on the calculating used SPSS 18.0 program, the data showed the significance was 0.420. the significance of the levene test statistic was higher than 0.05 (0.420 0.05). it meant that the scores were not violated the homogeneity.
The writer used One-Ways Anova to test the hypothesis with significance
level α= 0.05. The writer used manual calculation and SPSS 18.0 Program to test the
hypothesis using One - ways Anova. The criteria of Ho is accepted when Fvalue ≤
Ftable, and the Ho is refused when Fvalue ≥ Ftable. Then the criteria Ha is accepted when Fvalue ≥ Ftable, and Ha is refused when Fvalue ≤ Ftable. Or The criteria of Ho is accepted
when the significant value ≥ 0.05, and Ho is refused when the significant value ≤
0.05.
To make sure the manual calculation, SPSS 18.0 statistic program was
conducted in this research.
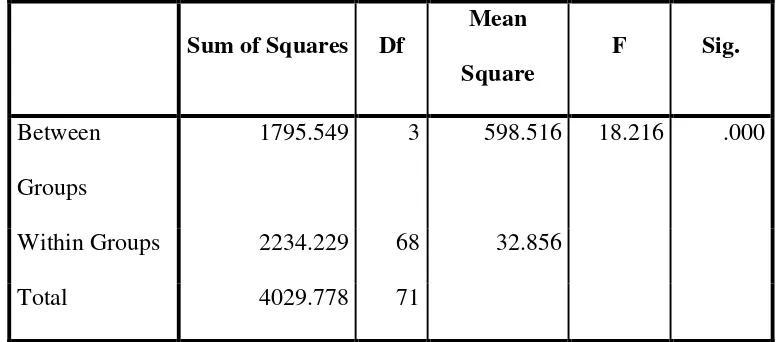
Table. 4.9 One-Way ANOVA manual calculation
Sum of Squares Df
Mean Square
F Sig.
Between
Groups
1795.549 3 598.516 18.216 .000
Within Groups 2234.229 68 32.856
Total 4029.778 71
Based on the SPSS 18.0 statistic program calculation, the result shows that Degree of Freedom Between Groups (DFb)= 3 and Degree of Freedom Within
differences among groups after doing the treatment, with Fvalue = 18.216 and the
significant level was lower than alpha (α) (0.00 ≤ 0.05).
Knowing that there is a significant difference among groups after doing the
treatment, writer needs to test the hypotheses. Because ANOVA is only to know that there is significant differences among groups, not to know where the differences
among groups are, to answer the research problems and test the hypotheses, writer applied Post Hoc Test.
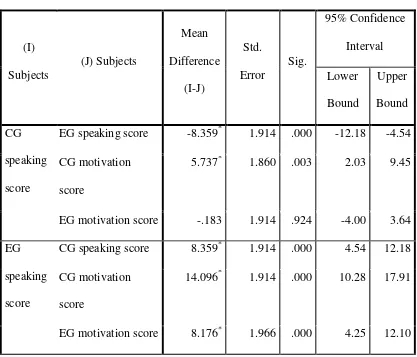
Table 4.10 Post Hoc Test
(I) Subjects (J) Subjects Mean Difference (I-J) Std. Error Sig. 95% Confidence Interval Lower Bound Upper Bound CG speaking score
EG speaking score -8.359* 1.914 .000 -12.18 -4.54
CG motivation score
5.737* 1.860 .003 2.03 9.45
EG motivation score -.183 1.914 .924 -4.00 3.64
EG
speaking score
CG speaking score 8.359* 1.914 .000 4.54 12.18
CG motivation
score
14.096* 1.914 .000 10.28 17.91
CG motivatio
n score
CG speaking score -5.737* 1.860 .003 -9.45 -2.03
EG speaking score -14.096* 1.914 .000 -17.91 -10.28
EG motivation score -5.920* 1.914 .003 -9.74 -2.10
EG motivatio n score
CG speaking score .183 1.914 .924 -3.64 4.00
EG speaking score -8.176* 1.966 .000 -12.10 -4.25
CG motivation
score
5.920* 1.914 .003 2.10 9.74
*. The mean difference is significant at the 0.05 level.
The criteria of Ho is accepted when the significant value is higher than alpha (α) (0.05), and Ho is refused when the significant value is lower than alpha (α) (0.05).
1. First, based on the calculation above used manual calculation and SPSS 18.0 program of Post Hoc Test, Experiment Group of speaking ability shows the significant value (0.03) was lower than the alpha (0.05). It meant that there is
significant effect of speaking score and students’ motivation. Thus, Ha that state using cartoon story maker gives significant effect for experimental class in
speaking ability at the class of speaking III of the State Islamic institute of Palangka Raya was accepted and Ho that state using cartoon story maker in speaking ability at the class of speaking III of the State Islamic institute of
Palangka Raya is rejected.
2. Second, on the calculation above used manual calculation and SPSS 18.0
significant value (0.03) is lower than the alpha (0.05). It means that there is
significant effect of students’ motivation. Therefore, Ha that state using cartoon
story maker gave significances effect for experiment class in students’
motivation at the class of speaking III of the State Islamic institute of Palangka Raya is accepted and H0 that state using cartoon story maker does not have a statically significant effect on students’ motivation at the class of speaking III
of the State Islamic institute of Palangka Raya is rejected.
3. Third, on the calculation above used manual calculation and SPSS 18.0 program of Post Hoc Test, Experiment Group of speaking score and students’
motivation shows the significant value (0.00) is lower than the alpha (0.05). It
means that there is significant effect of using cartoon story maker on students’ speaking score and motivation. Therefore, Ha that state using cartoon story
maker gives significances effect for experiment class in students’ motivation at
the class of speaking III of the State Islamic institute of Palangka Raya is accepted and H0 that state using cartoon story maker does not have a statically significant effect on students’ motivation at the class of speaking III of the State
Islamic institute of Palangka Raya is rejected.
4. Interpretation of The F-Ratios
Based on the result of the research, writer interpreted that:
1. Teaching using cartoon story maker is more effective on students’ speaking
shown that the result shows significant value is lower than alpha (0.00 lower ≤ 0.05).
2. Teaching using cartoon story maker is more effective on students’
motivation than teaching speaking without giving cartoon story maker. It is shown that the result showed significant value is lower than alpha (0.03 lower ≤ 0.05).
3. There is no different effect between teaching speaking using cartoon story
maker on students’ speaking score and motivation. It is based on the
calculation used SPSS 18.0 statistic program, the result shows significant value is higher than alpha (0.924 ≥ 0.05).
C. Discussion
The result of analysis shows that Is significant effect of using cartoon story maker on students speaking ability and motivation at the class of speaking III of the
State Islamic institute of Palangka Raya. The students who were taught using cartoon story maker on got higher score in post test with mean (81.41) in speaking test and
(73.24) in students’ motivation, than those students who taught by using power point
presentation and pictures with mean (73.05 ) in speaking test and (67.32) in students’
motivation. Moreover, after the data calculated using ANOVA with 5% level of significant. It is found that the F observed is higher than F table with =0.005.
speaking without cartoon story maker. It is shown that the result showed significant value is lower than alpha (0.00 lower ≤ 0.05).
Thus, Ha that stating using cartoon story maker gives significant effect on
students’ speaking ability of the class of speaking III of the State Islamic institute of
Palangka Raya is accepted and Ho that stating using cartoon story maker did not give significant effect on students’ speaking ability of the class of speaking III of the State
Islamic institute of Palangka Raya is rejected. It is confirmed the thesis by Andi Widdaya Sofyana from State Institute for Islamic Studies of Salatiga about task based language teaching in improving students’ speaking skill trough cartoon story maker
(a CAR of the 10th grade students of MAN Temanggung). This research goals to know the implementation of TBLT in improving students’ speaking skill through cartoon story maker and to know the students’ improvement on speaking skill by
implementing Task Based Language Teaching through cartoon story maker. Based on
the result of the research, it can be concluded that this research is successful.1
Second, the result testing hypothesis shown that experiment group of motivation shows the significant value (0.03) is lower than the alpha (0.05). It means
that there is significant effect of cartoon story maker on students’ motivation.
Therefore, Ha state that using cartoon story maker gives significant effect for experiment class on students’ motivation of the class of speaking III of the State
1
Islamic institute of Palangka Raya is accepted and Ho that state using cartoon story
maker does not have significant effect on students’ motivation of the class of
speaking III of the State Islamic institute of Palangka Raya is rejected.
Third calculation, on the calculation above used manual calculation and SPSS 18.0 program of Post Hoc Test, experiment group of speaking ability and students’
motivation shows the significant value (0.03) is lower than the alpha (0.05). It means that there is significant effect of cartoon story maker on students’ speaking score and
motivation. Therefore, Ha that state using cartoon story maker give significances effect for experiment class in students’ motivation of the class of speaking III of the
State Islamic institute of Palangka Raya is accepted and H0 that state using cartoon
story maker does not have statically significant effect on students’ motivation of the class of speaking III of the State Islamic institute of Palangka Raya is rejected.
The finding indicated that the alternative hypothesis stating that is any
significant effect of using cartoon story maker on students’ speaking score and motivation of the class of speaking III of the State Islamic institute of Palangka Raya
is accepted. On contrary, the null hypothesis is rejected.
There are several reasons of using cartoon story maker gives effect on students’ speaking score and motivation. First, based on teaching learning process,
the students understand what they should do first when the writer asked them to speak up on the theme. The finding is suitable with the definition of cartoon story maker
with conversations, dialogues, and different backgrounds. Background images can be
imported from external sources, such as the Web, unlike the character images (the character cartoons).2
Second, the students can explore many ideas from mind. It’s a good way to
develop idea before starting speaking activity. The learners can do it on their own or with friends or classmate to try find inspiration or idea. This finding is related to
Norma Prayogi from State University of Surabaya about improving students’ speaking ability by using cartoon story states that this research is about retelling story
by using the media to improve speaking ability. The action was successful when at least 18 students or 70% of 24 students have good level in speaking ability. The presence of this media to improve students’ narrative speaking had given a significant
progress toward their speaking ability. The students new perspective that they could also relate the material to their hobby like pictures, music, etc.3
Third, the finding was suitable with definition that conversations stories are also included an unlimited number of frames and are view frame by frame. Each
frame can include images, test bubbles, and voice recordings. The stories can be saved on a computer as HTML page (web pages), and can easily viewed by others on any computer using a web browser such as internet explorer. Stories can be printed.
Completed stories can also be loaded back into cartoon story maker and edited or
2
Http://cartoon-story-maker.software.informer.com/ (Accessed : 02 march 2016)
3
added to.4 It is confirmed the thesis by Nurawati Mina from STBA LIA Jakarta about
designing cartoon story maker as a supplementary material for English structure subject. This research allows teachers and students to know the process and the basic
principles of how a cartoon story maker for learning is designed in the context of English Structure class. 5
Based on calculation of One-Way ANOVA, students’ improvement on their speaking score and motivation could be proves from increased students scoring speaking ability and motivation on pre-test to post-test. Therefore, the students could
gain their idea and arrange their idea into a performance. It could be conclude that any factors also improve the students speaking score and motivation. Teaching by cartoon story maker improves the students’ speaking ability, especially for the
fluency, the cartoon story maker helped them to speak fluency and describe something based on the topic. Cartoon story maker also help the students improved
their pronunciation, because the cartoon story maker is available to record then sound and they can learn by mistake from sound recording and conversation.
Not only conversations but also stories that include an unlimited number of frames and are view frame by frame. Each frame can include images, test bubbles, and voice recordings. The stories can be saved on a computer as HTML page (web
pages), and can easily viewed by others on any computer using a web browser such
4
Http://cartoon-story-maker.software.informer.com/ (Accessed : 02 march 2016)
5
as internet explorer. Stories can be printed. Completed stories can also be loaded back
into cartoon story maker and edited or added to. Furthermore by using this application the writer tries to help students to comprehend conversations and then