CHAPTER III
RESEARCH METHODOLOGY
A. Research Type
The research type was descriptive quantitative design because this study concerned with process. A descriptive study determined and reports the thing. It means that descriptive study, the research happened naturally, and the research has no control over the condition and the situation, and could only measure what already exist.
The quantitative approach to the study of social and behavioral phenomena holds that the aim and methods of the social sciences are, at least in principle, the same as the aim and methods of the natural or physical sciences. Quantitative researchstrives for testable and confirmable theories that explain phenomena by showing how they are derived from theoretical assumptions.1
B. Research Design
In this study, the design was mix method which used survey research with the classification according to focus and scope as a census intangibles and the focus information as attitudinal information because this study concerned with students’ perception in process. Attitudinal information,
attitudinal questions seek to find out more about the opinions, beliefs, or interests of teachers or learners. These questions are often used in needs
1 Donal Ary, et al, Introduction to Research in Education,(Eight Edition), Wadsworth: Wadsworth Cengange Learning, 2010, p. 420-421
analysis research when researchers want to gather information on such topics as what learning goals students have or what skill areas they are most interested in2. The data collected from the students’ information. It mean the data were statistic data and written.
Survey research is a study that gathers data on the characteristics and views of informants about the nature of language or language learning through the use of oral interviews or written questionnaires3. In survey research, investigators ask questions about peoples’ beliefs, opinions, characteristics,
and behavior. A survey researcher may want to investigate association between respondents’ characteristics such as age, education, social class, race, and their current attitudes toward some issue4. The data collections in this study were mostly in the form of description and explanation.
By the statements above, the writer concluded that survey research was a process of collecting information about the respondents of population. The writer described all of phenomena based on the facts in the field. In this case the writer used survey with descriptive quantitative design because the writer measure, describe, identify and explain the causes of students’ anxiety to speak English in English class at eleventh grade of MAN Model Palangka Raya.
2
Sandra Lee Mc.Kay, Researching Second Language Classroom, Mahwah (New Jersey): Lawrence Erlbaum Associates Publishers, 2006, p. 35.
3Ibid 4
C. Population and Sample
1. Population
Ary claims that population is the larger group about which the generalization is made. A population is defined as all members of any well-defined class of people, events, or objects5. Zoltan claims that population is a group of people whom the survey is about6.According to Arikunto, “Population is the entire subject of research”.7
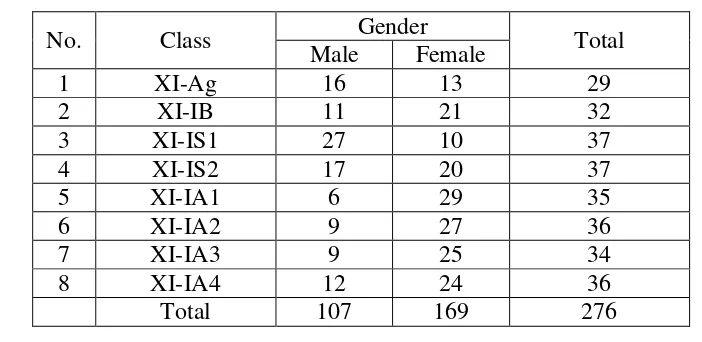
The populations of the study also state the size of this population, if size can be determined, and how it will be identified. Question of access arise here, and the writer might refer to availability of sampling frames-mailing lists or published lists of potential respondents in the population.8As population, the writer took the students at the eleventh grade of MAN Model Palangka Raya, as below:
Table 3.1: Table of Population
No. Class Gender Total
Male Female
1 XI-Ag 16 13 29
2 XI-IB 11 21 32
3 XI-IS1 27 10 37
4 XI-IS2 17 20 37
5 XI-IA1 6 29 35
6 XI-IA2 9 27 36
7 XI-IA3 9 25 34
8 XI-IA4 12 24 36
Total 107 169 276
5Ibid,
Donal Ary, et al, Introduction to Research …….p.148. 6
Zoltan Dornyei and Tatsuya Taguchi, Questionnaire in Second Language Research, (second edition), New York : 270 Madison Avenue, 2010, p.60
7
Suharsimi Arikunto, Prosedur Penelitian, Jakarta: Rineka Cipta, 1992, p. 108. 8
2. Sample
Zoltan claims that sample is the group of people whom researchers actually examine9. The small group that is observed is called a sample. A sampleis a portion of a population10. The samples are used to represent the population from which they are drawn11.
Zoltan states that certain multivariate statistical procedures require more than 50 participants; for factor analysis, for example, we need a minimum of 100 subjects. Questionnaires typically attract an initial response rate of only around 30 %, and over 50 % can already be seen as a good response12. The writer needed around 50 % participants of populations and for this research; I took the sampling 120 students who studied at eleventh grade of MAN Model Palangka Raya.
The writer used random sampling. Ary states that random sampling is The best known of the probability sampling procedures. The basic characteristic of simple random sampling is that all members of the population have an equal and independent chance of being included in the random sample.13The selection of a simple random sample is usually carried out according to a set of mechanical instructions which guarantees
9Ibid,
Zoltan Dornyei and Tatsuya Taguchi, Questionnaire in…., p.60. 10Ibid,
Donal Ary, et al, Introduction to Research…,p.148 11
Del Siegle, Sampling - Educational Research, (Online) URL : http://www.gifted.uconn.edu /siegle/research/Samples/instructornotessamples.htm,(accesed on August25th, 2014)
12Ibid,
Zoltan Dornyei and Tatsuya Taguchi, Questionnaire in…., p.63-64. Del Siegle, Sampling…..
13
the random nature of the selection procedure.14 In this study, the writer took 150 students as the sample to answer the problem of the study.
D. Research Instrument
1. Research Instrument
The data were very important in this study. They were needed to support and prove the study itself. Sandra claims that language survey is any studies “that gather data on the characteristics and views of informants
about the nature of language or language learning through the use of oral interviews or written questionnaire”15
. Then, the writer used interview and questionnaires to obtain the data in order to answer the problem of the study.
a) Questionnaires
Questionnaire is an instrument in which respondents provide written responses to questions or mark items that indicate their response16. Hornby states that questionnaire is a written or printed list of questions to be answered by a number of people especially as part of a survey17. Survey questions can take a variety of forms. The two main types of questions are open-ended and close-ended question18. Therefore the writer used the closed-ended question toward this
14
Ross, Kenneth N., Quantitative Research Method in Educational Planning, Paris: UNESCO, 2005, p. 9.
15
Ibid, Sandra Lee Mc.Kay, Researching Second….,p. 35. 16Ibid,
Donal Ary, et al, Introduction to Research…p.648. 17Ibid,
A.S Hornby, Oxford Dictionaries:Advanced Learner’s...,article “Questionnaire”, p. 952.
18
research. This type was suitable with the topic of the research which asked the students’ anxiety to speak English in English class at eleventh grade of MAN Model Palangka Raya.
In compiling the results of the research the writer did the coding. Because the writer used the likert-scale, the interval scales also used for coding the question. Each response gave a number for example Agree = 1, Disagree = 219. The questionnaire constructed in the form of likert-scale which consisted of 33 items. It administrated by using the student perception.
Zoltan states that questionnaire research makes the inherent assumption that the respondents can read and write well. The situation may be more serious when a questionnaire is administered in languages that the respondents are learning, which the case is often in applied linguistic research. It is therefore understandable that for respondents with literacy problems or with limited L2 proficiency20. So, the writer will use Indonesian language in questionnaire. The questionnaire design is available in appendix.
The writer focused on measuring the questionnaires to answer the problem of study. The writer used the questionnaires both of the close-ended and the likert type scale. There was some procedures that writer carried out the pilot study as follow:
19Ibid,…
p.42 20
1) The writer did the simple random sampling 2) The writer prepared the pilot questionnaire. 3) The writer gave try out to the respondents. 4) The writer collected the responses.
5) The writer calculated the result of the pilot.
6) The writer analyzed the data obtained to know the instrument validity, instrument reliability and central tendency.
b) Interview
Interview is oral questioning of a subject21. Interviews are used to gather data from people about opinions, beliefs, and feelings about situations in their own words. They used to help understand the experiences people have and the meaning they make of them rather than to test hypotheses22. The question can be design to find out more about teachers’ and learners’ opinions and beliefs about various
aspects of language learning, such as their feelings about the use of particular classroom activities or content of classroom materials23. This interview was design to get more information, especially relate with the students’ anxiety to speak English in English class at eleventh grade of MAN Model Palangka Raya.
In this research the writer conducted face to face interviews with participants. The informal conversational interviews used for gathering the data by interviewing the respondents. The success of an interview
21Ibid,
Donal Ary, et al, Introduction to Research…, p. 644. 22Ibid,
Donal Ary, et al, Introduction to Research…, p.644 23
is related to the wording of the questions. One way to avoid the problems that can arise from students’ lack of English proficiency is, if possible, to allow students to be interview in their first language.24
2. Research Instrument Try Out
The writer tried out the test instrument before it applied to the real sample in the study. The writer analyzed the test instrument to gain the information about the instrument quality that consists of instrument validity and instrument reliability. The procedures of the try out as follows:
a) The writer tried out the test instruments to some students.
b) The writer gave score to the students’ answer, then writer analyzed the obtain data to know the instruments validity, and instruments
reliability.
The initial piloting of the item pool usually consists of the following steps25:
a) Select three or four people who are motivated to spend some time to help you and whose opinion you value. Some of them should not be specialists in the field.
b) Ask them to go through the items and answer them, and then to provide about their reactions and the answer they have given.
c) You may ask for any general comment.
24Ibid,
p. 53 25
3. Research Instrument Reliability
The reliability of a measuring instrument is the degree of consistency with which it measures whatever it is measuring. This quality is essential in any kinds of measurement26. On a theoretical level, reliability is concerned with the effect of error on the consistency of scores.
In designing a survey, as in all research, it is essential for researchers to strive for reliability. In order to assure the reliability of a survey, several measures can be used27.
a) First, the same survey can be given on two occasions to the same individuals. Then the researcher can check to see how consistently the respondents gave the same response to the same item.
b) The second way of assuring reliability is to have two forms of a survey and have individuals take both forms. The consistency of response on these two forms could again be checked.
c) The final way to achieve reliability is to check the internal consistency of responses in a survey. In this case, if a survey contains several items that ask similar questions but in different forms, then the researcher can check to see how consistently the respondents have answered these questions.
26Ibid,
Donal Ary, et al, Introduction to Research…, p.236 27
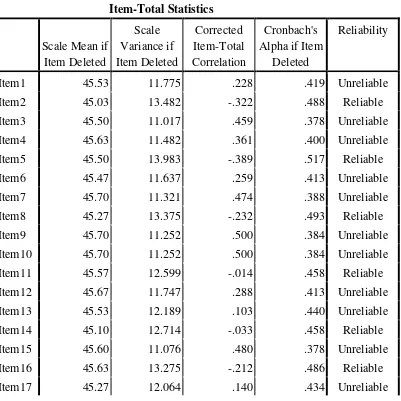
The writer did the reliability by spss 16. The degree of alpha’s cronbach’s alpha is higher than r table (0.448).
Table 3.2
Result of reliability
Reliability Statistics
Cronbach's
Alpha N of Items
.448 33
Item-Total Statistics
Scale Mean if Item Deleted
Scale Variance if Item Deleted
Corrected Item-Total Correlation
Cronbach's Alpha if Item
Deleted
Reliability
Item1 45.53 11.775 .228 .419 Unreliable
Item2 45.03 13.482 -.322 .488 Reliable
Item3 45.50 11.017 .459 .378 Unreliable
Item4 45.63 11.482 .361 .400 Unreliable
Item5 45.50 13.983 -.389 .517 Reliable
Item6 45.47 11.637 .259 .413 Unreliable
Item7 45.70 11.321 .474 .388 Unreliable
Item8 45.27 13.375 -.232 .493 Reliable
Item9 45.70 11.252 .500 .384 Unreliable
Item10 45.70 11.252 .500 .384 Unreliable
Item11 45.57 12.599 -.014 .458 Reliable
Item12 45.67 11.747 .288 .413 Unreliable
Item13 45.53 12.189 .103 .440 Unreliable
Item14 45.10 12.714 -.033 .458 Reliable
Item15 45.60 11.076 .480 .378 Unreliable
Item16 45.63 13.275 -.212 .486 Reliable
Item18 45.20 12.786 -.066 .466 Reliable
Item19 45.47 11.706 .239 .417 Unreliable
Item20 45.30 11.114 .428 .383 Unreliable
Item21 45.43 11.702 .237 .417 Unreliable
Item22 45.60 13.697 -.328 .503 Reliable
Item23 45.50 12.466 .020 .454 Reliable
Item24 45.60 14.041 -.423 .516 Reliable
Item25 45.67 13.540 -.298 .495 Reliable
Item26 45.17 11.661 .299 .410 Unreliable
Item27 45.33 11.195 .395 .389 Unreliable
Item28 45.53 13.499 -.266 .497 Reliable
Item29 45.60 11.076 .480 .378 Unreliable
Item30 45.50 11.569 .285 .409 Unreliable
Item31 45.33 11.885 .185 .426 Unreliable
Item32 45.53 14.257 -.463 .526 Reliable
Item33 45.63 11.068 .505 .376 Unreliable
4. Research Instrument Validity
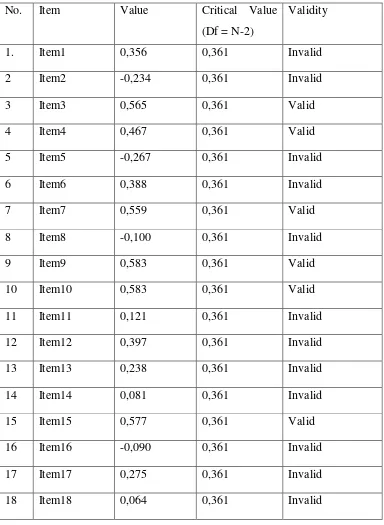
Validity was defined as the extent to which an instrument measured what it claimed to measure28. The writer did Face Validity to make sure that questionnaire was valid.
The writer did pilot study not only to know the students’ difficulties
in answering the questionnaire but also to measure the content validity of the questionnaire. The writer calculated the results of the pilot study using SPSS 16 Program. The total of the item was 35 items and the total of the respondents were 20 students. The correlation was significant in 5% and 1% degree. By comparing and analyzing between the pilot study results
28
and the critical values of the Pearson Product Moment Correlation Coefficient as stated in Donald’ quotes the data were found as follow:
Table. 3.3
Results of Face Validity
No. Item Value Critical Value
(Df = N-2)
Validity
1. Item1 0,356 0,361 Invalid
2 Item2 -0,234 0,361 Invalid
3 Item3 0,565 0,361 Valid
4 Item4 0,467 0,361 Valid
5 Item5 -0,267 0,361 Invalid
6 Item6 0,388 0,361 Invalid
7 Item7 0,559 0,361 Valid
8 Item8 -0,100 0,361 Invalid
9 Item9 0,583 0,361 Valid
10 Item10 0,583 0,361 Valid
11 Item11 0,121 0,361 Invalid
12 Item12 0,397 0,361 Invalid
13 Item13 0,238 0,361 Invalid
14 Item14 0,081 0,361 Invalid
15 Item15 0,577 0,361 Valid
16 Item16 -0,090 0,361 Invalid
17 Item17 0,275 0,361 Invalid
19 Item19 0,369 0,361 Invalid
20 Item20 0,538 0,361 Valid
21 Item21 0369 0,361 Invalid
22 Item22 -0,209 0,361 Invalid
23 Item23 0,159 0,361 Invalid
24 Item24 -0,312 0,361 Invalid
25 Item25 -0,186 0,361 Invalid
26 Item26 0,412 0,361 Valid
27 Item27 0,511 0,361 Valid
28 Item28 -0,136 0,361 Invalid
29 Item29 0,577 0,361 Valid
30 Item30 0,410 0,361 Valid
31 Item31 0,320 0,361 Invalid
32 Item32 -0352 0,361 Invalid
33 Item33 0,596 0,361 Valid
E. Data Collection Procedure
There are two basic data-gathering techniques in survey research: interviews and questionnaires.29Instrument of the study was needed in the research. It was because the instruments were tools to get the data of study. In which the data were the important things to help the writer in answering the problem of study. Sandra claims that language survey are any studies “that
gather data on the characterictics and views of informants about the nature of language or language learning through the use of oral interviews or written questionnaire”30
.
In this study, the writer used content or document analysis design. Ary states thatcontent or document analysis is a research method applied to written or visual materials for the purpose of identifying specified characteristic of the material. The materials analyzed can be textbooks, news paper, web pages, speeches, television programs, advertisement, musical composition, or any of a host of other types of documents. Content analysis is widely used in education.”31The writer used this research design because the writer analyzed the students’ responses product. And it was formed in a questionnaire and interview guideline.
In collecting the data for this research, the writerused interview and questionnaires to obtain the data in order to answer the problem of the study. To get collecting the objective data, the writer applied the steps as follows:
29
Ibid, Donal Ary, et al, Introduction to Research…, p.379. 30Ibid,
Sandra Lee Mc.Kay, Researching Second…., p. 35 31Ibid,
Donal Ary, et al, Introduction to Research…,p. 457.Ibid, Sandra Lee Mc.Kay,
1. The writer prepared the questionnaire.
2. The writer gave questionnaire to the respondents. 3. The writer did interview to the respondents. 4. The writer collected the responses.
5. The writer calculated the result of the study.
6. The writer analyzed the data obtained using table, SPSS and to measure the central tendency.
7. The writer concluded the students’anxiety to speak English in English class at the eleventh grade of MAN Model Palangka Raya.
F. Data Analysis
1. Data Compiling
In this study, the writer used interval scale and collected the data by using the questionnaires both of the close-ended and likert types questions. This research was about students’ perception which was known as attitudinal information32. Often attitude scales on a questionnaire were also treated as interval scales. For example, frequently when Likert-scales are used, each response was given a number (e.g., agree = 1, disagree = 2) and these numbers are treated as interval scales33.
The writer analyzed the data in three steps. There were item scores, the distribution of frequency, and then central tendency. To analyze the data, the writer applied the steps as follows :
32 Ibid,
Sandra Lee Mc.Kay, Researching Second…., p. 35. 33
a. The writer collected the main data (item score/responses);
b. The writer arranged the collected score into the distribution of frequency of score table.
c. The writer calculated Mean using formula, Median, and Modus. 1) Mean
∑X X = N
Where:
X = Mean value Σ = Sum of
X = raw score
N = Number of case. 34
2) Median
The median is defined as that point in a distribution of
measure which 50 percent of the cases lie35. Example:
18 20 22 25 25 30
Median: any point from 22.5 to 24.5 fits definition of the median. In this case, 22.5 + 24.5 = 23.5
3) The Modus / Mode
The mode is the value in a distribution that occurs most frequently36. Example:
34 Ibid,
Donal Ary, et al, Introduction to Research…, p.109. 35
Ibid, p.110
14 16 16 17 18 19 19 21 22 The mode of this distribution is 19 because it is the most frequent score.
d. The writer calculate the deviation score and standard deviation using the formula37:
1) Deviation Score __
𝑥= X −X
𝑥 = Deviation Score X = raw score _
X = Mean
2) Standard Deviation 𝑆2= 𝑥2
𝑁−1
s = 𝑥2
𝑁−1
s = 𝑥
2−( 𝑋)2 𝑁 𝑁−1
Where =
𝑥2 = sum of the squares of each score (i.e., each score is first squared, and then these squares are summed)
36Ibid,
p.111
37
( 𝑋)2 = sum of the score squared (the scores are first summes, and then this total is squared)
N = Number of cases
e. The writer interpreted the analysis result. f. The writer gave a conclusion.
2. Data Displaying
In compiling survey results the first thing a researcher needs to do was to decide on coding categories. The writer assigned a numerical code to the data, the data needed to be recorded in some fashion. The best way to do this was in some type of a table in which the writer identified the respondents in the left-hand column and used the rows in the table to list the participant’s response to each item38
.
The writer adopted the Fukuda’s way to display data results39
. Fukuda display her result in table. The table summarize show many respondents selected always, usually, sometimes, occasionally,and never
in answer to the questions listed earlier. The table also includes the percentage of respondents for each response and finally theme an for the question40.
The writer used questionnaire with the close ended questions and likert type scale (agree, disagree) as the instrument for collecting the data.
38Ibid,
Sandra Lee Mc.Kay, Researching Second….,p.42 39Ibid
,p.44 40
Sandra stated that once the information is compiled in a table, it needs to be displayed in some way. There were several possible alternatives41. 1. One is to simply report the frequency of each response. Hence, in the
example of having students rank the importance of each skill, one could simply describe how many students ranked writing as one, and how many ranked listening as one, and so on.
2. A second alternative is to describe the results in percentages. If researchers choose to describe the results in terms of frequency or percentages they could also display these results in a figure using a bar graph or pie chart. Visually displaying results in this way often makes it easier to highlight the results of the survey.
Finally, with interval scales one could describe the data in terms of
central tendency. As mentioned earlier, attitude scales are often treated as interval scales so that the central tendency of Likert-scale questions is sometimes calculated. The most common types of central tendency are the mean, mode, and median. The mean or average is calculated by adding up the scores and dividing by the number of participants. The median is the number in a set of numbers that represents the point at which 50% of the items are above and 50% are below. The mode is simply the most common number.
41