CHAPTER III RESEARCH METHOD
This chapter, the writer described about research methodology that used in conducting the research. It was purposed to answer the problem of the study this
chapter consist of research design, approach, population and sample, data collecting procedures, instrument of the study, instrument try out, and data
analysis procedures.
A. Research Design
The study was a quasi-experiment study. Quasi-experiment study designs are similar to randomized experimental design in that they involve manipulation of an
independent variable but differ in that subjects are not randomly assigned to treatment groups because. The quasi-experimental be aware of the threats to both
internal and external validity and consider those factors in their interpretation. Although true experimental are preferred, quasi-experimental design are
considered worthwhile because they permit researches to reach reasonable conclusions even through control is not possible.1
Therefore, the writer used quasi experiment because it is not based on random
assignment of subjects to experiment and control groups. There are two groups in this model; they are experiment group and control group. The groups are given
pre-test and post-test. Pretest is given know pre-ability before giving of the
1
Donal Ary, (et, all), Introduction to Research in Education (Eight edition), Canada: Wadsworth (engange learning), 2010,p.316
treatment and posttest is given to measure the score‟s students after giving
treatment.
B. Time and place
The place of study was SMP Muhammadiyah Palangka Raya JL.RTA
milono km 1, 5. In this study, the writer needed two months the gaining the data, it was on August 18th up to October 18th 2014.
C. Population and Sample 1. Population
The large group about which the generalization is made is called a
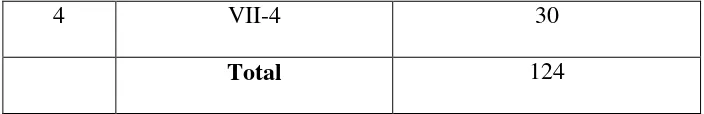
population. A population is defined all members of any well-defined class or people.2 In this research, the researcher takes SMP Muhammadiyah students to the population of his study. The Population of the research is seventh grade
students at SMP Muhammadiyah where there are five classes and the number of students are as follow:
Table 1.1
Population
NO CLASSES NUMBER OF STUDENT
1 VII-1 32
2 VII-2 30
3 VII-3 32
2
4 VII-4 30
Total 124
2. Sample
The small group in which the writer observed was called samples.3 In addition, the writer uses cluster sampling because the unit chosen is not an
individual but a group of individuals who are naturally together or grouped by the school4. The writer uses cluster sampling for it. In this way, the writer takes two
classes VII-2 and VII-4. The number of sample can be seen as follow:
Table 1.2 Number of Sample
NO Group Class of student Number of student
1 E VII-2 30
2 C VII-4 30
Total 60
E : Experiment Group
C : Control
Table 1.3
3Ibid
, p.148
4
Design of pre-test and post-test
Group Pre-test Treatment Post-test
Experiment Group T I X Y 2
Control Group T 1 - Y 2
D. Research Instruments
To get the data, the writer uses test technique in this study. A test is a set of
stimuli presented to an individual in order to elicit response based on which a numerical score can be assigned.5 The writer uses multiple-choice that consisted of 30 items. From the test, the writer knew the result of students‟ test and this
result gave description about the effect of using finger puppets.
The writer gave the test instrument to the experiment and control classes after the test was tried out. First, pre-test for experiment class VII-2 was held on
monday, August25th 2014 at 12.00-13.30 PM which followed by 30 students. Then the writer gave pre-test for control group class VII-4 was held on wenesday,
August 27th 2014 at 06.40-08.00 AM which followed by 30 students. Last the writer gave post-test for control group class VII-4 on wenesday, September 17th at
06.40-08.00 AM which followed by 30 students. Then the writer gave post-test for experimental group class VII-2 was held on Saturday, September15th 2014 at 12.00-13.30 PM which followed by 30 students. The time allocation of each test
process was 70 minutes.
5
Related to the study, test was used to get data for measuring the effect of finger puppets in teaching vocabulary. The major data in the study were the data of the students‟ English score those were taken from pre-test and post-test.
E. Research Instrument try out
In order to prove the tests are suitable to the students, the writer will be conducting a try out test. Then the writer chose students in the same school but different class to try out the test. The try out test will be conducted to SMP
Muhammadiyah Palangka Raya (VII-3). If the result is valid, it means that the test items as the instrumentation of this study are suitable to be given. These are the
try out procedures as follows:
1) Preparing the instrument.
2) Telling the students how they must do with the test of try out.
3) Giving the test items to the student 4) Collecting to the student‟s work.
5) The writer gave score to the students‟ answer
6) Analyzing the result of the test to know the instrument validity, instrument reliability, index difficulty, and test of data normality.
F. Research Instruments Validity 1. Instrument Validity
The Validity of test is the extent to which it measures what it is supposed to measures and nothing else. The test must aim to provide a true measure of the
particular skill, which it is intended to measure: to the extent that it measures external knowledge and other skills at the same time, it will not be a valid test.6
There are two types of validity :
a. Content Validity
This kind of validity depends on a careful analysis of the language being
tested and of the particular course objectives. The test should be so constructed as to contain a representative sample of the course, the relationship between the test items and the course objectives always being apparent. 7 The writer makes
question based on syllabus where the topic about descriptive and the sub topic is job descriptions.
b. Construct Validity
This type of validity assumes the existence of certain learning theories or constructs underlying the acquisition of abilities and skills. If a test has construct
6
J. B. Heaton, Writing English Language Tests, Longman, 1975,p. 153 7Ibid,
validity, it is capable of measuring certain specific characteristics in accordance
with a theory of language behavior and learning.8
In this study, the writer makes multiple-choice item is 30 questions for job description. This questions based on syllabus. The writer uses test of
multiple-choice item, because multiple-multiple-choice items are amenable to item analysis, which enables the teacher to determine how well the items functioned with the students tested and how well each alternative functioned in discriminating between the
higher achieving and lower achieving students. Then, the improvement of alternatives and the item stem can be undertaken according to the difficulty level.
To measure the validity of the instrument, the writer uses the formulation of
product moment by Pearson follows.
The criteria of interpretation of the validity:9
Where :
: Numeral of index correlation „r‟ product moment
N : Total of sample
∑XY : amount of the product between X score and Y score
8
J. B. Heaton, Writing English Language Tests, Longman, 1975, p. 154.
9
∑X : amount of the x score
∑Y : amount of the y score
Furthermore, it was calculate using Test-t calculation below:10
T observed =
Where:
T: the value of t observed
R: the coefficient of correlation of the result of r observed N: number of class
The distribution of t table at alpha 5% and the degree of freedom (n-2) with the measurement of validity using these criteria:
To know the validity level of the instrument, the result of the test will
interprets to the criteria below11:
0,80-1000-very high validity
0,60-0.799-high validity
10
Dr. Ridwan Nugraha, metode dan teknik menyusun tesis, Bandung : Alfabeta, 2010, p.110..
11
Ibid.p.76
0,40-0,599-fair validit0,20-0,399-poor validity
0,00-0.199-very poor validity
Based on, the measurement of validity of the try out that was consisted 30 items. And all items were valid. For detail explanation, can be seen at appendix 4
for the measurement of instrument validity.
2. Index difficulty
The index of difficulty (or th e facility value) of an item simply shows how
easy or difficulty the particular item proved in the test. The index of difficulty (F.V) is generally expressed as the fraction (or percentage) of the students who
answered the item correctly. It is calculated by using the formula:
R is represents the number of correct answer and N is the number of students
taking the test.12 For detail explanation, can be seen at appendix 7.
3. Index Homogeneity
Is used to know whether experimental group and control group, that are
decided, come from population that has relatively same variant or not. The formula is:13
F =
12
J.B.Heaton, Writing English Language Test, Longman, 1975, p. 172. 13
Notice:
F : Frequence
The hypotheses in homogeneity:
Fvalue ≤ Ftable, means both of variants are
homogeneity.
Fvalue > Ftable, both of variants are homogeneity.
If calculation result of F is lower than F table by 5% degree of significance
so Ho is accepted, it means both groups have same variant. For detail explanation, can be seen at appendix 6.
4. Index Normality
It is used to know the normality of the data that is going to be analyzed whether both groups have normal distribution or not.
Chi square is used here:14
=
Notice:
= Chi square
= frequency from observation
= expected frequency
Calculation result of is compared with x table by 5% degree of significance.
If is lower than x table so the distribution list is normal. For detail
explanation, can be seen at appendix 6.
14
5. The Formula They are: 15
a. Mean : Where :
Mx: Mean
N : Number of case
Fx : Total result product between each score with frequency.
b. Median :
Where :
Mdn : Median
N : Number of case
Fkb: cumulative frequency located in underscore content median
Fi: Authentic frequency (frequency of score content median)
i: interval class
c. Modus :
Where:
15
Mo: modus
Fa: frequency located in above interval content modus
Fb: frequency located in under content modus.
d. Standard Deviation
SD =
Where :
SD : Deviation Standard
I : interval class
Fx‟: total result product between frequency each interval with X
N: Number of class
e. Standard Error
Sem =
G. Research Instruments Reliability
Reliability is a necessary characteristic of any good test: for it to be valid at all, a test must first be reliable as a measuring instrument. It test is administered to
place between these occasions).16 Reliability also means the consistency with which a test measures the same thing all the time. Reliability of a test refers to its
consistency with which it yields the same rank for an individual taking the test
The qualification of reliability as follow 19 ,80-1000-very high reliability York: Macmilan Publishing Company, 1985, p. 14.
18
Dr. Ridwan Nugraha, metode dan teknik menyusun tesis, Bandung : Alfabeta, 2010, p.119.
19
For the detail explanation of the instrument reliability calculation could be seen in the appendix 5 for the calculation of instrument reliability.
H. Distractor Analysis
One important in the quality of multiple choice item is the quality of the item is the quality of the item‟s distractors. However, neither the item difficulty nor the
item discrimination index considers the performance of these incorrect response
options.
Just as the key, or correct response option, must be definitively correct, the distracters must be clearly incorrect (or clearly not the “best” option). In addition,
to being clearly or reasonable to an examinee who is not sufficiently knowledgeable in the content area. If a distractor appears so unlikely that almost
no examinee will select it, it is not contributing to the performance of the item. In fact, the presence of one or more implausible distracters in a multiple choice item
can make the item artificially far easier than it ought to be.
Based on professional testing, in a simple approach to distractor analysis, the proportion of examines who selected of the response options is examined. For the
key, this proportion is equivalent to the item p-value, or difficulty. If the proportions are summed across all of an item‟s response option they will add up to
1,0 or 100 % of the examinees‟ selections. All distractors should be the same part
of speech as the same part of speech as the word being tested. The exception to this rule of course is if you are testing word forms. In general, they should come
should not be related to the tested word in terms of meaning or more simply put the distracters should not be ambiguous.20
I. Data collection procedures
To get the data, the writer uses some ways in this study. Those ways are:
1. The writer chose the place of the study
2. The writer made instrument try out
3. The writer asked students to do the test.
4. The writer checked the result of the try out.
5. The writer divided the students (sample) into two class (experimental and
control class) by using cluster sampling.
6. The writer gave a pre-test to both classes (experimental and control) class.
7. The writer checked the result of pre-test of experimental and control class.
8. After the pre-test given, the researcher taught the students in experimental class about vocabulary with topic parts of body and job description by using
finger puppets and control class without using finger puppets. Experimental class will be taught using TPR (Total Physical Response) while control class
will be taught using direct method.
9. After doing the treatment, the writer gave the post-test to both classes.
20
10. Then, the writer checked the students‟ answers in the post-test. 11. The writer checked the student‟s answer in the posttest.
12. The writer gave scores to students‟ answers by using scoring rubric. In this case, the writer applied index difficulty to correlate samples to examine the
significant difference score between experimental class and control class. J. Data Analysis
To answer the problem of the study about teaching English vocabulary by
using finger puppet at the seventh grade at SMP Muhammadiyah Palangkaraya, the writer followed some procedures to analyze the obtained data as follows:
1. Collecting the student‟s scores of pretest and posttest
2. The writer arranged the obtained score into the distribution of frequency both pre test and post test.