50
CHAPTER IV
RESEARCH FINDING AND DISCUSSION
In this chapter, the writer presented the data which had been collected from the research in the field of study. The data were the result of vocabulary and speaking test, the result of data analysis, and interpretation.
A.Data Presentation
In this part, the writer presented the obtained data of the students’
vocabulary and speaking test scores of the class that was being sample of this study.
1. Distribution of Vocabulary Test Scores
The vocabulary test had been conducted on Wednesday, September, 2nd 2015 at 08.15-09.45 in class XI-IB of MAN MODEL Palangka Raya with the number of students was 27 students. The vocabulary test consisted of 45 items in form of multiple choices questions with the time allocation 45 minutes for answering the test.
The students’ vocabulary scores of the sample class of the study were
presented in the following table.
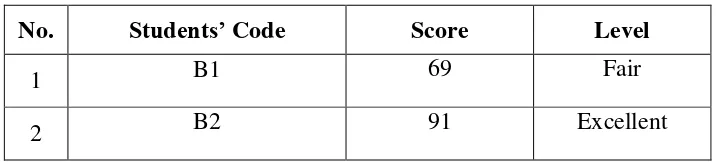
Table 4.1 The description of vocabulary test scores of the data achieved by
the students of the sample class.
No. Students’ Code Score Level
1 B1 69 Fair
3 B3 89 Very Good
4 B4 62 Fair
5 B5 62 Fair
6 B6 64 Fair
7 B7 64 Fair
8 B8 69 Fair
9 B9 91 Excellent
10 B10 80 Good
11 B11 89 Very Good
12 B12 82 Very Good
13 B13 89 Very Good
14 B14 82 Very Good
15 B15 93 Excellent
16 B16 73 Good
17 B17 91 Excellent
18 B18 80 Good
19 B19 71 Good
20 B20 80 Good
21 B21 87 Very Good
22 B22 80 Good
23 B23 87 Very Good
24 B24 82 Very Good
25 B25 87 Very Good
27 B27 87 Very Good
TOTAL 2152
Highest Score 93
Lowest Score 62
Mean 79.7
Standard Deviation 9.98
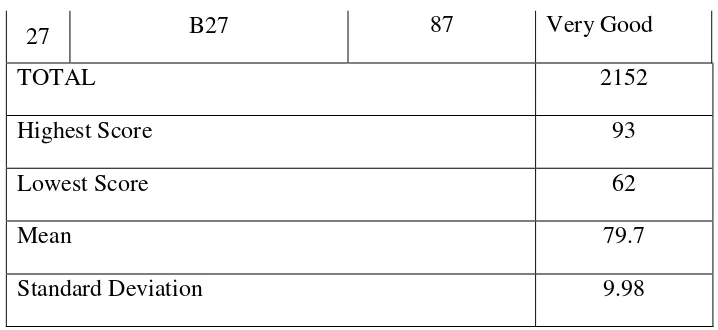
Table 4.2 The calculation of mean, median, mode, and standard deviation of
the vocabulary test scores of the sample class using SPSS 16
program.
2. Distribution of Speaking Test Scores
The speaking test had been conducted on Thursday, September, 3rd 2015 at 10.00-11.30 in class XI-IB of MAN MODEL Palangka Raya with the number of students was 27 students. The speaking ability test consisted of the instruction and
Statistics
Vocabulary
N Valid 27
Missing 0
Mean 79.70
Median 82.00
Mode 80a
Std. Deviation 9.988
Variance 99.755
Range 31
Minimum 62
Maximum 93
statement the subjects addressed in their speaking and the alternative topics to be chosen. In this sense, the students were assigned to choose one of the topics that was interested. The topics were entitled laptop as students’ friend, the factors causing global warming, cars should be banned in the city, and is smoking good for us. They were asked to develop the topic in form of spoken (monologue) about 3-5 minutes.
The students’ speaking scores of the sample class of the study were
presented in the following table.
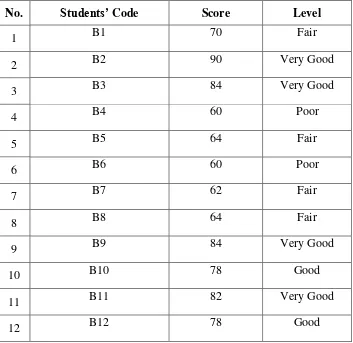
Table 4.3 The description of speaking test scores of the data achieved by the
students of the sample class.
No. Students’ Code Score Level
1 B1 70 Fair
2 B2 90 Very Good
3 B3 84 Very Good
4 B4 60 Poor
5 B5 64 Fair
6 B6 60 Poor
7 B7 62 Fair
8 B8 64 Fair
9 B9 84 Very Good
10 B10 78 Good
11 B11 82 Very Good
13 B13 84 Very Good
14 B14 80 Good
15 B15 90 Very Good
16 B16 70 Fair
17 B17 90 Very Good
18 B18 86 Very Good
19 B19 74 Good
20 B20 78 Good
21 B21 82 Very Good
22 B22 76 Good
23 B23 84 Very Good
24 B24 78 Good
25 B25 84 Very Good
26 B26 72 Good
27 B27 90 Very Good
TOTAL 2094
Highest Score 90
Lowest Score 60
Mean 77.56
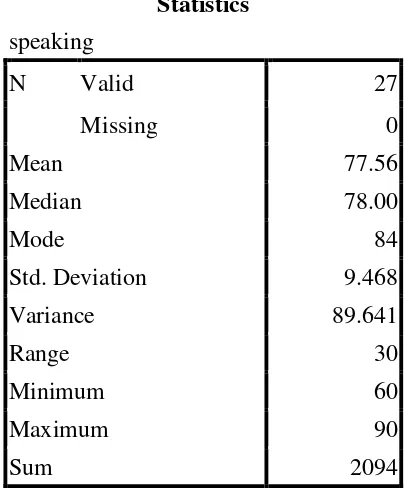
Table 4.4 The calculation of mean, median, mode, and standard deviation of
the speaking test scores of the sample class using SPSS 16
program.
Statistics
speaking
N Valid 27
Missing 0
Mean 77.56
Median 78.00
Mode 84
Std. Deviation 9.468
Variance 89.641
Range 30
Minimum 60
Maximum 90
Sum 2094
B.Results of Data Analysis
1. Testing of Normality, Homogeneity, and Linearity
The writer calculated the result of vocabulary and speaking test of the sample class by using SPSS 16 program.
First step was testing the normality. It was used to know the normality of the data that was going to be analyzed whether both groups have normal distribution or not.
And the last step was testing linearity to know whether the variables were correlated linearly or not.
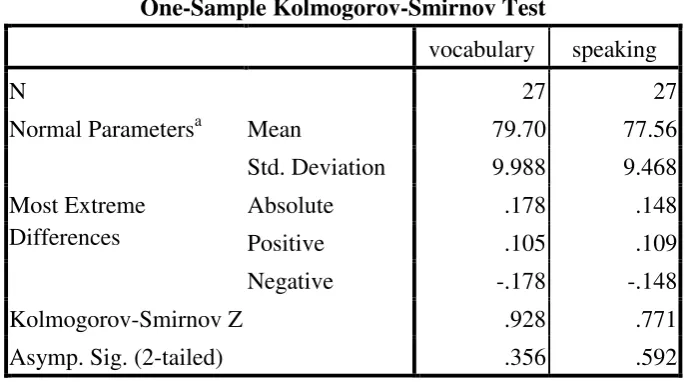
a. Testing Normality
Table 4.5 Testing of Normality One-Sample Kolmogorov-Smirnov Test.
One-Sample Kolmogorov-Smirnov Test
vocabulary speaking
N 27 27
Normal Parametersa Mean 79.70 77.56
Std. Deviation 9.988 9.468 Most Extreme
Differences
Absolute .178 .148
Positive .105 .109
Negative -.178 -.148
Kolmogorov-Smirnov Z .928 .771
Asymp. Sig. (2-tailed) .356 .592
a. Test distribution is Normal.
b. Testing Homogeneity
Table 4.6 Testing Homogeneity Levene's Test of Equality of Error
Variancesa.
Based on the result of homogeneity test, the Fvalue was 1.418 and the significantvalue was 0.262. The data were homogeneous if the significantvalue was
higher than significant level α= 0.05. Since the significant value (0.262) was higher
than significant level α= 0.05, it could be concluded that the data were
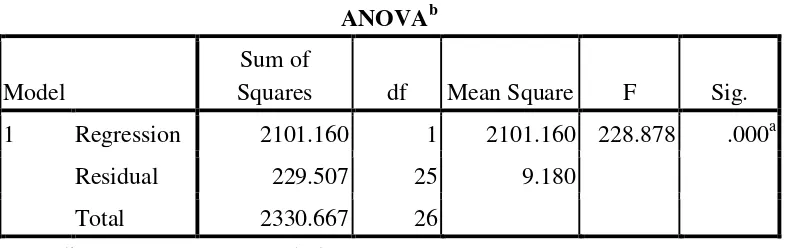
homogeneous. It meant that both of classes were in same variants. c. Testing Linearity
Table 4.7 Testing Linearity Regression.
ANOVAb
Model
Sum of
Squares df Mean Square F Sig. 1 Regression 2101.160 1 2101.160 228.878 .000a
Residual 229.507 25 9.180
Total 2330.667 26
a. Predictors: (Constant), vocabulary b. Dependent Variable: speaking
Based on the result of linearity test, the Fvalue was 228.878 and the significantvalue was 0.000. The variables were correlated linearly if the
Test of Homogeneity of Variances
speaking
Levene Statistic df1 df2 Sig.
significantvalue was lower than significant level α= 0.05. Since the significant value (0. 000) was lower than significant level α= 0.05, it could be concluded that the variables were correlated linearly.
2. Testing Hypothesis
The writer used Pearson Product Moment Correlation calculation with the significant level of the refusal of null hypothesis α= 0.05. The writer calculated by using manual calculation and also SPSS 16 Program to test the hypothesis using Pearson Product Moment Correlation. The criteria of Ha was accepted when tobseved > ttable, and Ho was rejected when tobserved < ttable.
a. Testing hypothesis using Manual Calculation
To find out the correlation between vocabulary mastery and speaking ability of the sample class, the writer used the Pearson Product Moment Correlation formula as follows:
𝑟𝑋𝑌= 𝑛( 𝑋𝑌)−( 𝑋. 𝑌)
[𝑛 𝑋2−( 𝑋)2][𝑛 𝑌2−( 𝑌)2]
𝑟𝑋𝑌= 27 169311 −(2153)(2094)
[27 174277 − 2153)2 [27 164732 −(2094)2]
𝑟𝑋𝑌= 4571397−4508382
4705479−4635409 [ 4447764−4384836 ]
𝑟𝑋𝑌= 63015
70070 62928
𝑟𝑋𝑌=63015 66403
𝑟𝑋𝑌= 0.948
Based on the calculation above, it was found that the rvalue was 0.948, then the rvalue was consulted with the table of the interpretation coefficient correlation r as follows:
Table 4.8 The interpretation coefficient correlation r.
Interval Coefficient Level of Correlation 0,80 – 1, 000 Very High
0,60 – 0,799 High
0,40 – 0,599 Fair
0,20 – 0,399 Poor
0,00 – 0,199 Very Poor
From the table of the interpretation coefficient correlation above, it can be seen that the rvalue (0.948) was at the level “very high” of correlation. So it meant that the correlation between vocabulary mastery and speaking ability of the sample class was in very high correlation.
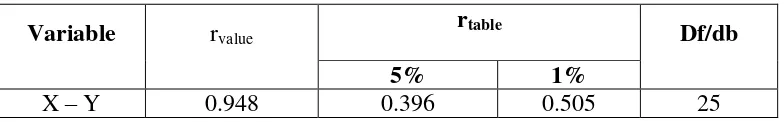
Table 4.9 The result of manual calculation.
Variable rvalue
rtable
Df/db
5% 1%
The next step was calculating the contribution. To know the contribution between both of variables (X and Y), coefficient determination formula was used as calculated below:
KP = 𝑟2× 100
KP = 0.9482× 100% = 89.87 %
Where:
KP = determinant coefficient value
r = correlation coefficient value
The calculation above showed that the vocabulary mastery (variable X) gave about 89.87 % contribution to the speaking (variable Y) of the sample class and 10.13% was influenced by other aspects.
Based on the result of hypothesis test calculation, it was found that the value of rvalue was higher than the value of rtable at the level of significance in 5% or 1% that was 0.396 <0.948> 0.505.
b. Testing Hypothesis using SPSS Program
The writer applied SPSS 16 program to calculate the Pearson Product Moment Correlation in testing hypothesis of the study which the result also supported the result of manual calculation. The result of the test using SPSS 16 program can be seen as follows:
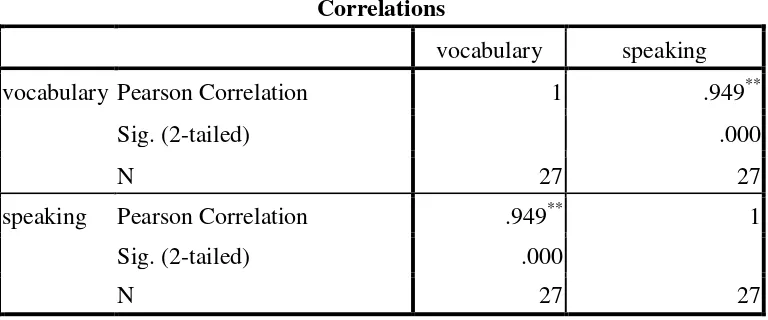
Table 4.10 The Calculation of Pearson Product Moment Correlation Using
SPSS 16 Program.
Correlations
vocabulary speaking
vocabulary Pearson Correlation 1 .949**
Sig. (2-tailed) .000
N 27 27
speaking Pearson Correlation .949** 1
Sig. (2-tailed) .000
N 27 27
**. Correlation is significant at the 0.01 level (2-tailed).
The table showed the result of calculation using SPSS 16 Program. From the table above, it meant that Ha was accepted. It was found that the result of rvalue = 0.949 was higher than rtable = 0.396 at df 25 at the significant level of 5% and 0.505 at df 25 at the significant level of 1% as explained in the table below:
Table 4.11 The result of Pearson Product Moment Correlation Test observed.
Variable rvalue
rtable
Df/db
5% 1%
It meant that vocabulary gave significant contribution to the speaking ability of sample class. So, there was a significant positive correlation between vocabulary mastery and speaking ability of the eleventh grade students at MAN Model Palangka Raya. On the other hand, the students with large vocabulary performed comparably with the students with much smaller vocabulary in speaking activities.
3. Interpretation
The hypothesis testing was measured by using Pearson Product Moment Correlation to measure the significant correlation between vocabulary mastery and speaking ability. Based on the result of manual calculation, it can be concluded that the rvalue was higher than the rtable at 5% and 1% significant level or 0.396 < 0.948 > 0.505. It meant Ha was accepted and Ho was rejected.
Furthermore, the result of calculation using SPSS 16 Program found that there was a high positive correlation between students’ vocabulary mastery and speaking ability. It proved by the value of rvalue was higher than the rtable at 5% and 1% significant level or 0.396 < 0.949 > 0.505.
meant that students’ whose much vocabulary performed speaking better than the student whose lack of vocabulary.
C.Discussion
The result of analysis showed that there was significant positive correlation between vocabulary mastery and speaking ability of the eleventh grade students at MAN Model Palangka Raya. It meant that the students whose much vocabulary, they got high score of speaking test and the students whose lack of vocabulary, they got low score of speaking test. Moreover, after the data was calculated using the Pearson Product Moment Correlation, it was found that the rvalue was 0.948 and the rtable was 0.396. it meant that rvalue > rtable.
To support the result of testing hypothesis, the writer also calculated the hypothesis using SPSS 16 Program. The result of the analysis showed that the students whose much vocabulary performed speaking better than the student whose lack of vocabulary. It was proved by the value of rvalue = 0.949 was higher than rtable = 0.396 at df 25 at the significant level of 5% and 0.505 at df 25 at the significant level of 1%.
vocabulary in speaking activities. The rvalue was 0.949, it was interpreted as strong correlation, so there was a high positive correlation between the students’ vocabulary mastery and speaking ability. On the other hand, when the vocabulary increased, the speaking ability increased at the same time.
These findings were suitable with the theories as stated in chapter II. First, according to James Milton, the volume of vocabulary a learner knows is diving the acquisition of other aspects of language and overall proficiency, then a much closer association might be expected. Learners with small or poorly developed vocabularies could not be as proficient nor as fluent in performing through the foreign language.74 It could be assumed that the students’ vocabulary stock gave much contribution in their acquisition of other aspects of learning the language skills, as the result of calculating the scores of vocabulary and speaking test, it showed the mean vocabulary scores was 79.7 and the mean of speaking scores was 77.56. Vocabulary played an important role in improving the four skills in English especially for communication purposes. The students with large vocabulary performed comparably with the students with much smaller vocabulary in speaking activities. They could arranged the words into sentences to made them meaningful and understandable.
Second, McCarthy stated that coversation also contains a large amount of vocabulary whose function is mainly relational and interactional.75 It meant that to make a communication, vocabulary is needed than grammar for this purposes. Having a good conversation could make the satisfying interaction between the
74
James Milton, Measuring the Contribution of Vocabulary Knowledge To Proficiency In
The Four Skills. 75
speaker and the listener. Conversation that contained a large amount of vocabulary transfered more clearly about the point of the communication.
Related to this, Norbert stated that vocabulary of 2000 words would be ralistic goal as found people regularly use about this many different words in their daily conversation. Of course, this will not enable a conversation on every topic, and certainly not an in-depth coversation on most topics. But it should still allow satisfying interaction with native speakers on topic focusing on everyday events and activities.76 It meant that 2000 words represented as the size of minimum vocabulary for having the daily conversation even did not cover all the topics an not in depth conversation.
76