THE EFFECTIVENESS OF USING PICTURES TO TEACH PROHIBITION
(An experimental Research at the Seventh Grade of M. Ts. N.U. Nurul Huda Mangkang in the Academic Year of 2011/2012)
THESIS
Submitted in Partial Fulfilment of Requirement for Gaining the Degree of Bachelor of Education In English Language Education
By:
KHOLISATUL UMAMI Student Number: 073411037
EDUCATION FACULTY
WALISONGO STATE INSTITUTE FOR ISLAMIC STUDIES SEMARANG
ii
THESIS PROJECT STATEMENT
I am, the student with the following identity:
Name : Kholisatul Umami Student Number : 073411037
Department : English Language Education
certify that this thesis is definitely my own work. I am completely responsible for the content of this thesis. Other writer’s opinions or findings included in the thesis are quoted or cited in accordance with ethical standards.
Semarang, 30 November 2011 The Writer,
iv
ADVISOR NOTE Semarang, November 30, 2011
To
The Dean of Education Faculty
Walisongo State Institute for Islamic Studies
Assalamua’alaikum, wr.wb
I inform that I have given guidance, briefing and correction to whatever extent necessary of the following thesis identification:
Title : The Effectiveness of Using Picture to Teach Prohibition ( An Experimental Research At Seventh Geade of M.Ts. NU Nurul Huda Mangkang Semarang in Academic Year 2011/2012)
Name of Student : KHOLISATUL UMAMI Student Number : 073411037
Department : English Language Education
I state that the thesis is ready to be submitted to Education Faculty Walisongo State Institute for Islamic Studies to be examined at Munaqasyah session.
Wassalamu’alaikum, wr.wb.
Advisor I,
v
ADVISOR NOTE Semarang, November 2011
To
The Dean of Education Faculty
Walisongo State Institute for Islamic Studies
Assalamua’alaikum, wr.wb
I inform that I have given guidance, briefing and correction to whatever extent necessary of the following thesis identification:
Title : The Effectiveness of Using Picture to Teach Prohibition ( An Experimental Research At Seventh Geade of M.Ts. NU Nurul Huda Mangkang Semarang in Academic Year 2011/2012)
Name of Student : KHOLISATUL UMAMI Student Number : 073411037
Department : English Language Education
I state that the thesis is ready to be submitted to Education Faculty Walisongo State Institute for Islamic Studies to be examined at Munaqasyah session.
Wassalamu’alaikum, wr.wb.
Advisor II,
Ismail SM., M.Ag.
vi
This thesis discusses the effectiveness of using picture to teach prohibition at seventh grade students. The background of this study is based on the KTSP curriculum, there are many competences that must be achieved by the students, one of them is prohibition. Prohibition is one of expressions that must be mastered by the students. The students only get the expression of prohibition formula and the example of sentence. But the teacher never asks them to use in the certain situation. The use of pictures in teaching writing is considered as a good way to
encourage the students’ writing practice based on the pictures. It is also to make
teaching learning become more interactive, the instruction can be more interesting, and the quality of learning can be improved. The study is aimed at responding the following question: (1) How is the effectiveness of using pictures to teach prohibition of M.Ts. N.U Nurul Huda Mangkang Semarang. The research methodology was an experimental research, the samples; the experimental class (VII A) and control class (VII B). The VII A was taught by using picture, while the VII B was taught without picture. The data are gathered through test and documentation. The formula that was used to analyze the data was t- test. It was used to prove the truth of hypothesis that had been planned.
vii
ACKNOWLEDGEMENT
First and foremost, I would like to express gartitude to Allah SWT, the Almighty God for the blessing, kindness, and inspiration in lending me to accomplish the fianl project. Without Him, I couldn’t stay patient and in control in writing this final project from the first page to the last page.
Shalawat and salam for the Prophet Muhammad who brings us from darkeness to the brighness.
I realize that I cannot complete this final project without the help of others. Many people have helped me during the writing this final project and it would be impossible to mention of all them. I wish, however, to give my sincerest gratitude and appreciation to:
1. Prof. Dr. Suja’i, M. Ag, the Dean of Tarbiyah Faculty of IAIN Walisongo Semarang.
2. Siti Tarwiyah, M. Hum, the Head of English deapartment and as the first advisor who has given his guidance, helpful corrections, very good advice as well as suggestion and encouragement during the consultation.
3. Ismail SM. M.Ag. as a second advisor for his guidance, inspirations and motivations during the research from the first until the end of the research. 4. All lectures in Tarbiyah Faculty, who had given the knowledge patiently. 5. The librarian of IAIN Walisongo Semarang, who helped me to get information
which is related to the title of this research.
6. Sugeng SE. as the head master of M.Ts Nu Nurul Huda Mangkang who had allowed the writer to carry out the researcher in his school.
7. Aini Sa’adah, M.Si. as English teacher of class VII A and VII B who had helped the writer in conducting the research in their school, and the student of VII A, VII B and VII C thanks for the cooperation and also the school administration staff.
8. My Parents (Drs. M. Affandi and Umi Zamroh), My brother ( Bakhtiar Effendi and Muh. Imaduddin Effendi), who always support and motivate for their endless and silent prayers.
viii
10. Someone who always support the writer to finish this work. Thank very much for your care, motivation and pray,(Mas Minan).
11. All members of Lily Kost (Arina, mba’ Titi, Emi, Isti, Lutfa) who always give me support in finishing this thesis.
12. All my friends in TBI ’07 (Arina, Lina, Ana, Sikha,Fanny, Atik, Hanani) Thanks a lot for cooperation.
13. All side that cannot be mentioned one by one the writer who have helped in finishing in this thesis.
By expecting pray, may the goodness be charity and get the reward from Allah swt.
The writer realize that this thesis is still far from completeness. So that, the writer so expects constructive suggestion and critism from all side for the advantages of thi research.
Finally, the writer hopes in order to this research paper to able to be useful for the readers who want to develope the English teaching knowledge.
Semarang, November 30,2011
ix
TABLE OF CONTENT
Title ... i
Thesis Statement ... ii
Ratification Note ... iii
Advisor Note ... iv
Abstract ... vi
Acknowledgment ... vii
Table of Content ... ix
List of Tables ... xii
List of Appendices ... xiii
Chapter I : Introduction ... 1
A. Background of The Research ... 1
B. Question of The Research ... 4
C. Objective and Benefit of The Research ... 4
Chapter II : Review of The Related Literature ... 6
A. Previous Research ... 6
B. Theoritical Framework ... 7
1. The General of Media ... 7
a. Definition of Media ... 7
b. General Concept of Media ... 8
c. Types of Media ... 9
d. The Functions of Media ... 10
2. The General of Picture... 11
a. Definition of Picture ... 11
x
c. Pictures as Teaching Media ... 12
d. The advantages and Disadvantages of Using Picture as Teaching Media ... 13
3. Prohibition in English ... 14
a. Definition of Prohibition ... 14
b. Types of Prohibition ... 15
4. Teaching Prohibition Trough Picture ... 17
C. Hypothesis ... 17
Chapter III: Research Method ... 18
A. Research Design ... 18
B. Research Setting ... 22
C. Population and Sample ... 22
D. Variable and Indicator ... 23
E. Data Collection Technique ... 25
F. Data Analysis Technique ... 27 Chapter IV: Research Finding and Discussion ... 34
A. Description of The Research Finding ... 34
B. The Data Analysis of Try Out ... 35
1. The Data Analysis of Pre-Test ... 39
2. Analysis of Post –Test ...44
C. Discussion of Research Finding ...49
D. Limitation of the Research ... 50
Chapter V : Conclution and Suggestion ... 52
A. Conclution ... 52
xi
C. Closing ... 53 FERERENCES
APPENDICES LIST OF TABLE
xii
LIST OF TABLES
Table 1 List of Time of the Study, 22.
Table 2 The Schema of Indicators Variables, 24.
Table 3 Table of the Observation Frequency of Class VII A, 40. Table 4 Table of the Observation Frequency of Class VII B, 41. Table 5 Test of Homogenity (Pre-Test), 42.
xiii
LIST OF APPENDICES
Appendix 1 Analysis Try Out, 1.
Appendix 2 The Name List of Experimental Class, 2. Appendix 3 The Name list of Control Class, 3.
Appendix 4 Score of Experimental and Control Class, 4.
Appendix 5 Test of the Normality Data of Pre-Test Experimental Class, 5. Appendix 6 Test of the Normality Data of Post-Test Control Group,6. Appendix 7 Pre-Test Homogenity of Experimental and Control Class,7. Appendix 8 Average Similarity of Pre- Test Experimental and Control Class,
8.
Appendix 9 Test of the Normality Data of Post-Test Experimental Class, 9. Appendix 10 Test of the Normality Data of Post-Test Control Class, 10. Appendix 11 Post-Test Homogenity of Experimental and Control Class, 11. Appendix 12 Test of Differences of Two Variance in Post-Test, 12.
Appendix 13 Lesson Plan Experimental Class Treatment I, 13. Appendix 14 Lesson Plan Experimental Class Treatment II, 19. Appendix 15 Lesson Plan Control Class Treatment I, 23.
Appendix 16 Lesson Plan Control Class Treatment II, 29 Appendix 17 Instrument for Try Out, 34 .
1 CHAPTER I
INTRODUCTION
A. Background of The Research
Language is the basic skill needed for real communication among people. By using language, we will able to express our feeling and ideas. People use language to convey messages to the other. Language is a means to communicate opinion, feelings and ideas. Oxford Learner’s Pocket Dictionary stated that “ Language is system of sound, words, manner, sign,
symbol, used by human to communicate thoughts and feeling”1
The presence of language as a tool for communication among people around the world had been stated by Allah in Surah Ar- Rum verse 22:
And among His signs is the creation of the heavens and the earth, and the diversity of your tongues and colours. Surely there are sign in this for all mankind.2
In Surah above, Allah shows us the sign of His authority through differences of tongue. Tongue means a language. There are no people who have the same language in the world. It is influenced by the location. People who live in difference location have difference language. They have to cooperate with one another to complete the necessities in their life.
1 Oxford. Oxford Pocket Dictionary Learner’s. (New York : Oxford University Press 1995). p. 240
2 Since the proclamation of Indonesia on the 17th of August 1945, English has been taught in this country as the first time that the teaching of a foreign language is introduced in the curriculum of Indonesian school.3It shows that English is one important language that is good be mastered by people if they want to speak with other people around the world.
English is the first foreign language in Indonesia and becomes part of Indonesian school curriculum. It does not just play a role in students learning process, but also has an important role in modernization as an Inernational language. Many people who can not speak English take English has been an important language in pursuing a better career. According to Hammer english has become a lingua franca, although it is not the language with the largest number of native speakers4.
English is one of the important languages that are used by people in the world. People around the world speak English to communicate to each other. Moreover, everyone believes that English is getting more and more important. Language is a means of communication in society. It is to communicate ideas, opinions and feeling. Language is a special characteristic of human being. It can be regarded as human criterion, because only human beings can speak language. It is also as a system of vocal conventional signs characteristics of the interaction of one or more communities of human beings.5
Nowdays, English is taught by teachers as a subject from elementary school to university. English has been taught In this country as the first foreign language. The teaching of foreign language for Indonesian students runs rather differently from the teaching of Indonesian as mother Tongue. Teachers play an important role in facilitating Englih learning. In this case, teacher should create or establish situation to enable learning occur in a fun and interesting environment. To
3 Ramelan, Introduction to Linguistic Analysis,(Semarang: IKIP Semarang Press, 1992),p.1 4 Jeremy Harmer, The Practice of English Language Teaching,(London: Pearson Education, 2001)p.1
3 achieve the expected situation, they should give the students more activities using media that can attract their attention to participate in the lesson.6
As a subject, English is different from other subjects. It has function as a means of communication. It shows that learning English is not only to learning about vocabulary, grammatical pattern and rhetorical structure but also learning about the use of and express it in the daily activity. There are four skills in teaching and learning English that should be mastered. Those are speaking, listening, reading and writing. Writing is the skill that involves communicating a message (something to say) by making sign on a page. It needs to be taught because communication is not only through speaking but also through writing.
Based on KTSP curriculum, there are many competences that must be achieved by the students, one of them is prohibition. Prohibition is one of expressions that must be mastered by the students. There are many signs of prohibition in public places using English. Sometimes, students are confuse to understand the mean of the signs. They also find difficulties when they are asked to write the expression of prohibition based on situation or sign in written form.
Meanwhile, students are often feel bored when they are studying expression of prohibition. The students only get the expression of prohibition formula and the example of sentence. But the teacher never asks them to use in the certain situation. The use of pictures in teaching writing is considered as a good way to encourage the students’ writing practice based on the pictures. It is also to make teaching learning become more interactive, the instruction can be more interesting, and the quality of learning can be improve. Picture can represent situation that would be impossible to create in any other way. Picture can help the students
4 associate what they hear with their real life experience. Through picture, students will easier and can improve their understanding about prohibition based on the situation at the picture.
Due to those facts, the writer wants to show the effectiveness of using picture in teaching prohibition with the 1st semester of 7th grade students of M.Ts. N.U. Nurul Huda in the academic year of 2011/2012. B. Question of The Research
The problem discussed in this final project is “How is the effectiveness of using pictures to teach prohibition to the first semester students of M.Ts. N.U. Nurul Huda Mangkang Semarang in the academic year of 2011/ 2012?
C. Objective and Benefit of The Research
The objective of this study will be to find out the effectiveness of using pictures to teach prohibition to the first semester students of M.Ts. N.U. Nurul Huda Mangkang Semarang in the academic year of 2011/ 2012.
The writer hopes that this study will be useful: 1. For the students
By using picture as a medium of teaching Prohibition. the students will be enjoy to follow the English class. They will be easy to understand the lesson, so that, it can improve their understand on prohibition.
2. For the teachers
5 also show the teacher that picyure can be an interesting media in teaching prohibition.
3. For the writer
6 CHAPTER II
REVIEW OF THE RELATED LITERATURE
A. Previous Research
Many researcher have conducted the research about using a picture as media. Related to this study, the writer chooses some literature :
1. Thesis under the title “The Use of Pictures as Media to Improve Students Understanding on Descriptive Adjective”. By Athi‟ Rifa‟tin. In this research,
she was using picture to improve students‟ understanding on descriptive
adjective. The objectives of her study were to know how the implementation of
pictures in improving students‟ understanding on descriptive adjective and to find out wether are effective the use of pictures to improves students‟
understanding on descriptive adjectives. The researcher was using a Classroom Action Research to run his research. He took 23 fifth grade students of M.I.
Walisongo Semarang. And the use of picture in improving students‟
understanding on descriptive adjective to fifth grade of M.I. Walisongo was an
affective media and can improve students‟ understanding on descriptive
adjective. There was a progress from each cycle.1
The differences between her research and the writer‟s are on the language
skill. She concern with descriptive adjective, while the writer concern on prohibition. And the similarity is, she and the writer use same medium,it is picture.
2. The title is The Use of Picture in Teaching Writing of Report Text by Siti Mahmudah. In her research, se was using picture to teach writting of report text. The objectives of her study were to find out the students‟ achievement in
7 writing of report text. She was using picture as media to teach writing of report text. She was taking 2 classes of 8th grade students of M.Ts. N Jekerto Grobogan as experimental and control class. The result is that picture can improve students‟ achivement in writing report text.2
The similarity between the writer and Siti Mahmudah is in choosing the picture as the media when she teaches. The difference is about the material. She teaches report text and the writer teach prohibition.
B. Theoretical Framework 1. Media
a. Definition of Media
The word “media” is plural from of medium derived from latin medius
that means midlle or mediator. In Arabic, media is intermediary or mediator of a message from sender to reciever message.3
According to Association for Education and Communication Technology (AECT) in Amerika, media are any forms used to join
information. While National Education Association (NEA) stated that media are device that can be manipulated, seen, listened, read or spoken together with the instruments used well in the teaching learning process influence the affectivity of instructional program.4
From those definitions, it can be concluded that media is something to join message and to stimulate mind, feeling and students‟ interest to study. Therefore, it can motivate them in teaching-learning process.
2 Siti Mahmudah, The Use of Picture in Teaching Writing of Report Text,(Semarang: English Language Teaching of State Institute for Islamic Studies Walisongo, 2010), Unpublised thesis.
8 b. General Concept of Media
Media play an important role in teching and learning process. The use of media is very needed to reach the purpose of teaching and learning and it should be various. Harmer stated that “as a language teacher, we use variety of teaching aids to explain language meaning and construction, engage
students a topic or as the basic of whole activity”5
“While Brown defines media as the tools or the physical things used by a teacher to facilitate the instruction”6
From the explanation above, the writer makes a conclusion that media is the tools, materials, or events that establishes conditions used by a teacher to facilitate the instruction to acquire knowledge, skill and attitudes and engage the learner in a topic or as the basic of the whole activity.
There are principles of media selection: 1). Content
Do the media have significant relation with the lesson? The choice of certain media must be conformed to the lesson (message) that will be given to the students.
2). Purposes
The use of visual aids should contribute to the teaching learning process significantly. It means that the media can facilitate the teaching learning process.
3). Price
Before buying certain visual aids, a teacher should consider whether or not the cost or money spent is in accordance with the educational result derived from its use.
5 Jerremy Harmer, The Practice of English Language Teaching, London: Longman Group Limited, 2001,p. 134.
9 4). Circumtances of use
In choosing visual aids, a teacher should take into account the environment (school) where he/she teaches. He/ she sholud think whether or not the aid would function effectively in environment.
5). Leaner‟s Verification
A teacher must think whether or not there are data providing that the students learnt accurately through the use of learning aids.
From the explanation above, it should be better if the teacher follows all the principles, so that the teaching and learning process can go on normally and the goal of teaching and learning process can be reached.7 c. Types of Media
Media are considered as instructional device since it is used to convey messages in teaching-learning process. In teaching-learning foreign language, media is classified into three types, they are:
1) Visual
Visual media is all media that is used in seeing. It is an image that conveys messages to the students through photo, picture, chart, graph, which illustrate the real object or situation.8
2) Audio
It is a device that relates to our hearing. The message delivered is expressed by using audible symbols. For example: radio, tape recorder, or electronic transcription.9
3) Audio-visual
It is a media that can be seen and listened, like a film, video, or television.
7 Brown, Audio Visual Instruction, p.76. 8. Azhar Arsyad, Media Pembelajaran, P. 106.
10 d. The Functions of Media
Media have important roles in teaching and learning process.The followings are some functions of media in teaching learning; media give motivation for students to be more interested in learning. Learners are able to understand the message better as the materials are presented in a certain way. And media provide various kinds of teaching methods and technique, so learners are not bored with the monotonous teaching and learning process.
According to Kasihani, media are representing of additional tool needed to English laguage learning especially for student. media can be used for helping in simplifying language learning process and make it perfect and reducing the usage of mother tongue of first language. Media also have roles to raising the students‟ motivation and their interest in learning and explaining new concept, so students can understand without difficulties and misunderstanding. Using media can raising the English learning quality and making learning process more interesting and interactive.10
In fact learning is the acquisition of skills and knowledge which are in fact the result of taking, the responses caused by stimuli into the students‟ mind which create sensory impression. The task of the teacher is to provide various kinds of stimuli, which can be done by using media. Beside, media can also serve as a subtitute for the things which are difficult to find. 11
10 Kasihani K.E. Suyanto, English for young learners Melejitkan Potensi Anak melalui English Class yang Fun, Asyik, Menarik, (Jakarta: Bumi Aksara, 2007), p.101 .
11http://massofa.wordpress.com/category/bahasa, retrieved on 22nd
11 2. Pictures
a. Definition of Picture
Picture is defined as visual representation of person, object, or scene, as a painting, drawing, or photograph.12
Pictures can be in the for of flash cards, large wall pictures, photographs, or illustration.13
In this research, the writer uses it as media to teach the lesson material. Pictures are extremely useful for a variety of communication activity, such as describe and draw activities.
Commandment of Allah in the Qur‟an Surah An Nahl verse 78:
knew nothing; and gave you ears and eyes and hearts that you may be grateful . common language which can be understood, and enjoyed everywhere.
12 Barbara Ann Kipfer, (Ed.), Random House Webster’s colleg Dictionary, (New York: Randoum House, 2001), p.930.
13Jeremy Harmer, The Practice English Language Teaching, P.134.
12 2) Sketch
Sketch is a simple picture, or a rough draft describing the main part without detail.
3) Diagram
Diagram represents a simple picture using lines and symbols, and describes the object in broad outline.
4) Chart
Chart is a tool for presenting ideas or concepts that are difficult if only in writing or orally conveyed verbally.
5) Graphs
Graph is a simple picture using dots, lines, or complete image sometime verbal symbol or also use there.
6) Cartoon
Cartoon is interpretative used of symbols to convey a message quickly and succinctly, or an attitude toward people, situation, or certain events
7) Poster
Poster is an image that conveys certain impression, able to influence and motivate people‟s behaviors whom see it.
b. Picture as Visual Media
As visual media, picture can be used in teaching and learning process that helps the students to understand the material by giving an image to the students which is like the real object or situation. The forms of visual media can be seen as follow:
13 b. Diagram depicting the concept of relationships, organization, and
structure materialistic content
c. Maps showing the relationships between the elements in material content Graphs such as tables, graphs and charts that present the image or trends data or relationships between a set of pictures or numbers. By picture, students can create their own sentences based on the picture they seen.
It is one of the cheaper visual media that can convey a message to the readers. Picture also has some characteristic; the first characteristic is picture more understandable than words. Second, the information that on the picture is retained without a lot of accuracy for over months. Third, picture can allow us to explain a word or concept in a simple way.
c. Pictures as Teaching Media
Picture is very useful and effective media in teaching. It can be used for teaching; speaking, listening comprehension, structure, vocabulary and
cultural contents etc. In order to be effective and increase the students‟
interest, the pictures used should be clear, and large enough to be seen by the whole class. The media they are going to use will motivate the students to learn, will increase their interest, and will widen the channel of communication between the teacher and the students, so that the teaching will be more communicative and effective. In this way media can make the students more interested in their study. 15
As visual media, picture can be used in teaching and learning process that helps the students to understand the material by giving an image to the students which is like the real object or situation. By picture, students can improve their understanding about prohibition based on the picture they seen.
15.http://massofa.wordpress.com/category/bahasa, retrieved on 22nd
14 d. The Advantages and Disadvantages of Using Picture as Teaching Media There are some advantages and disadvantages using picture as media in teaching- learning English that are:
a. The advantages of using pictures
Picture are all right for beginner and for young people and also to advanced students. There are many benefits of pictures in a teaching process, that are; giving material by using picture it can stimulate and motivate students to become more observant and express themselves. Picture is inexpensive medium, many even be free, and fairly easy to locate and can be used by individual or in groups. Picture also can be displayed for as long as necesary so pupils can work at their own rate. Picture as up-to-date media can bring reality into the classroom, beside picture can be used to introduce, supplement, or summarize at unit. At last, by giving picture in the classroom can enriches reading and can help clarify misunderstanding.
b. The disadvantages of using picture
Beside giving advantages to use in class teaching, picture or photography have also disadvantages are; picture not depict motion as film does. Picture can seem uninteresting to pupils if the picture is not unique. The other disadvantages of using picture is depicting a spesific purpose that may be difficult to locate.16
15 3. Prohibition in English
a. Definition of Prohibition
Prohibition is the neggative form of command17. According to Macmillan English Dictionary, prohibition is a law or rule that stops people from doing something. 18 Prohibition is an expression to warn other people not to do something. Or to forbid people not to do something.
From the statement above, the writer thinks that as the students of junior high school they need to know about the expression of prohibition because they are usually use in daily life.
b. Types of Prohibition
Prohibition also has two patterns, they are:
1. Verbal prohibition a sentence of prohibition which uses lexical-meaning-verb inside. To express the prohibition we should combine the word /do not/ or /don't/ before the verb.
( place “Don‟t „ or “Do not” before a bare infinitive). It is formed by
adding “don”t or “do not” to the imperative (Don‟t + the basic form of
Verb).19
For Examples;
Don‟t eat in the classroom! (Jangan makan di dalam kelas!) Don‟ open your book! (jangan buka bukumu!)
Don‟t enter the room! (jangan masuk ke ruangan itu!) Don‟t forget! (jangan lupa!)
Don‟t move! (jangan bergerak!)
17 Slamet Riyanto, English For Your Better Future Speak English Please,( Yogyakarta: Pustaka Pelajar , 2009), p. 141.
18 Macmillan , English Dictionary For Advanced Learners International Student Edition, (Malaysia: Maccmillan Publishers Limited 2002), p. 1128.
16 To make a polite prohibition, use “please” at the beginning or at the end of the sentence.
Example:
Please don‟t cry! (janganlah menangis!)
Don‟t cry, please! (janganlah menangis!)
Please don‟t shoot the bird! (tolong jangan tembak burung itu!)
Don‟t shoot the bird, Please! (tolong jangan tembak burung itu!)
2. Nominal prohibition a sentence of prohibition which uses /BE/ after /Do not/ or /don't/. after that you have to place a complement in the end.
(place“Don‟t Be or “Do Not Be” before a non-verb).
For Examples;
Don‟t be lazy! (jangan malas!) Don‟t be stupid! (jangan bodoh!) Don‟t be careless! (jangan ceroboh!) Don‟t be late! (jangan terlambat!)
Don‟t be confused! (jangan bingung)!
Example dialogues of prohibition: Mira : Hi... Rani, what‟s the matter?
Rani : Hi... Mira, I have a problem with the book. Mira : What is that?
Rani : Is this the book recommended by the teacher?
Mira : Oh..that‟s not the book, don’t use that book. Rani : Oh..OK, thank you for the information
When we would like to emphasize something forbidden to do, we can change the main element of prohibition structure by using “Never”. For Examples;
17 Beside the pattern above, we can also use this follows pattern!
No + ing from verb.20 For Examples;
No smoking! (dilarang merokok!) No parking! (dilarang parkir!)
4. Teaching Prohibition Through Picture
Teaching Prohibition is an interesting. Because prohibition is an expression to warn other people not to do something. This expression often we uses when we interact with other people in daily life.
Writing prohibition need a medium. Pictures can be used in teaching prohibition, it helps the students to understand the material by giving an image or to the students which is like the real object or situation. By pictures teacher can asks the students to write the expression of prohibition based on the
pictures, so it can improve the students‟ understanding on prohibition.
C. Hypothesis
“Hypothesis is the assumption that possibly true or possibly wrong”.21 Hyphotesis is the provisional answer to the problem of the research, theoretically it was considere possibly or highest the level of his truth.
“It is provisional truth determined by researcher that should be tested and proveded.22 Because the hyphotesis was the provisional answer, it must be proved through investigation or analysis of the data to recieve proof wether the hyphotesis could be accepted or not recieve, significant or not, effective or not.
In this research, the hyphothesis is using picture is effective to teach prohibition.
20 http: //3nglish7.blogspot.com/2010/02/command-prohibition. retrived on 28th September 2011.
18 CHAPTER III
RESEARCH METHOD
A. Research Design 1. Type of Research
In this study, the method used was experimental research. An experimental is the way to find the casual relationship between two factors which are raised by the researcher in purpose by reducing or eliminating any distracting factors. 1
There are two groups in this model of experimental research. First is experimental group and the second is control group. In this research, the researcher used cluster random sampling is a technique to choose sample by random each class (population) and it is based on lottery. The writer decided to choose class VII A as the experimental class and class VII B as the control class. The experimental class recieved a new treatment. It was taught by using picture in prohibition. While, the control class taught by using conventional learning or lecturing. It was not recieve a new treatment.
2. The Activities of Experimental and Control Group a. Pre-Test
Pre-test was given to the students before the experiment was run. This test
was for experimental class and control class to measure the students’
understanding about the material before the researcher gave a treatment.
19 b. Activities in Experimental Group and Control Group
1) Experimental Group First Meeting:
In opening the class, teacher greeted the students and checked the attendance list. Then, told the topic of the day followed by giving introduction about the material by asking some questions, like, “Have you ever prohibit someone from doing someone?, “What their
responses?”, “Do you ever seen the sign of prohibition at public
area?”.And students answered these questions orally.
Because teacher used picture as teaching medium, so teacher gave explanation about it. After that, teacher explained the expression of prohibition including definition and the pattern. Teacher also did not forget to give the example of expression of prohibition. After students understood the material, the teacher give some dialogues contain expression of prohibition with the picture and asked students to wrote which is expression of prohibition and wrote the meaning.
To know the students’ comprehension of the material which
has been given, teacher gave students some signs to the students and asked students to write the meaning of the sign. After that, teacher chooses some students to write their work in the black board. Teacher
discussed the student’s work briefly.
And the last, teacher conclude together with students the material today and gave suggestions to students to study hard and memorized the new material. Finally, teacher closed the class.
Second Meeting:
20 mention some examples of prohibition. Students answered orally. After it the theacher asking students to make groups, each group consist of 4 students. Then the students matched the picture with the appropiate expression of prohibition. After it, the teacher chose some students to wrote the answer in front of the class.
Teacher conclude together with the students the material today and gave suggestions to students to study hard and memorized the new material. Finally, teacher closed the class.
2) Control Group First Meeting:
At the first meeting, teacher greeted students and checked the attendance list. Teacher told the topic of that day to students and also introduced the material by asking some questions, Have you ever prohibit someone from doing someone?, “What their responses?”, “Do
you ever seen the sign of prohibition at public area?”. And students
answered these questions orally.
After stimulated students about the material, teacher started to explain the definition expression of prohibition and the pattern of prohibition. Then, teacher gave the example of prohibition.
For the next activity, same with the experimental class teacher gave some dialogues contain expressing of prohibition and asked the student to write which is the expression of prohibition and write the meaning. After that, analyze the answer together .
After that activity, teacher wanted to know the students’
21 At the end of the lesson, teacher did not forget to review the material on that day and gave students suggestion to study hard and memorize the new material. Finally, teacher dismissed the class. Second meeting:
Same with the first meeting, in opening, teacher greeted students and checked the attendance list. Next, teacher told students about the topic of that day and also reminded students about the previous lesson.
After that, teacher gave short message contain prohibition and asked to the student to read loudly together. After students read it, they asked to answer the question based on the message. For the next activity, to know students understanding on prohibition teacher asked to studentsto translate expression of prohibition into english. Then point of some students to write it on black board. Teacher discussed
the student’s work briefly.
Teacher reviewed the materials and gave time to students to ask some questions. And finally, teacher dismissed the class.
c. Post-test
22 B. Research Setting
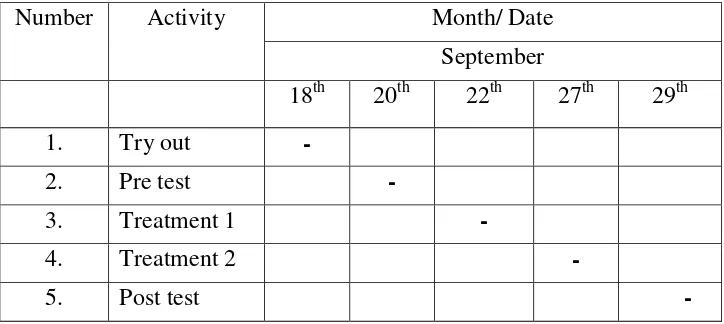
This research was conducted on the first semester in the academic year of 2011/ 2012 for about 14 days, began from 14th up to 29th 2011. It was conducted in MTs. N.U. Nurul Huda, Irigasi Utara Mangkang Kulon Semarang Kode Pos 50155.
Table 1. List of time of the study
Number Activity Month/ Date
September
18th 20th 22th 27th 29th
1. Try out -
2. Pre test -
3. Treatment 1 -
4. Treatment 2 -
5. Post test -
C. Population and Sample 1. Population
“Population is the entire research subject”.2 The population of the
research was the first semester of seventh grade students of M.Ts. N.U. Mangkang Semarang in the academic year of 2011/ 2012. The number of the population is 196 students. Thre are divided into VII A, B, C, D, and E.
23 2. Sample
Arikunto states that sample represents a part of research population.3 Sample is taking of a part population using certain procedure. So that can be expected to represent the population. Two classes were taken as the sample of this research. The classes that got learning by using picture was as experimental class. Then, the class that got learning lecturing methode was as control class. In addition, the sample in this research in class VII A was as experimental classs consist of 40 students and VII B was as control class consist of 42 students.
D. Variables and Indicators 1. Variables
According to Sugiyono, research variables are all things that shape what is defined by the researches to be studied in order to obtain information about it, and the conclusion drawn on next.4 There are two types of variables: independent variable and dependent variable. The dependent variable is the variable that focuses on the central variable, and other variables will act if there is any relationship. The independent variable is selected by researcher to determine the relationship with the dependent variable.
So the variables in this study are: a. Independent variable
The independent variable is selected by researcher to determine the relationship with the dependent variable. Independent variable in this study is the use of picture in teaching prohibition.
3 Suharsimi Arikunto, Prosedur Penelitian : Suatu Pendekatan Praktek, p.131.
24 b. Dependent variable
The dependent variable is the variable that focuses on the central variable, and other variables will act if there is any relationship. Dependent variable in this research is the teaching prohibition.
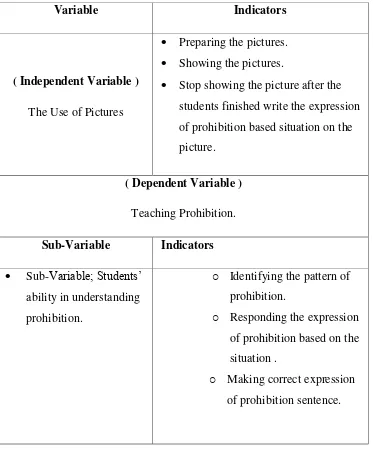
2. Indicators
Based on the variables above, we can make indicators that support the variables. The schema of indicators variables are stated as follows:
Table 2. The schema of indicators variables
Variable Indicators
( Independent Variable ) The Use of Pictures
Preparing the pictures.
Showing the pictures.
Stop showing the picture after the students finished write the expression of prohibition based situation on the picture.
( Dependent Variable ) Teaching Prohibition. Sub-Variable Indicators
Sub-Variable; Students’
ability in understanding prohibition.
o Identifying the pattern of prohibition.
o Responding the expression
of prohibition based on the situation .
o Making correct expression
25
Sub-Variable; Students’
ability in writing prohibition sentence.
E. Data Collection Technique
The writer collects the data to achieve the research. The techniques of collection consist of:
1. Test
Test is a question to measure competence, knowledge, intelegent, and ability talent which is possesed by individual or group to collect data.5 In this research, the test was given to tryout class, control class and experimental class.
The instrument of the test in this research is objective test. Objective test is frequently critized on the ground that they are simple to answer than subjective test. Objective test are divided into transformation, completion, combination, addition, rearrangement, mathcing, correct and incorrect (true/ false). and multiple choice.6 The writer used multiple choice form and
matching items form. The choice of the test type is based on the consideration that multiple choice test are:
a. Easier to be scored and it does not take much time score. b. More objective to score because it just has one correct answer. c. Not subjectivities to score.
J.B. Heaton states “although it is among the most difficult of all
objective item types to construct, it is simple to score and administer”.7
5 M. Chabib Thoha, Teknik Evaluasi Pendidikan, (Jakarta: PT Raja Grafindo Persada, 2001) p. 43.
26 In this research, the writer used pre test and post test, they are:
a. Pre-Test
Before the teacher taught new material by using picture, the teacher gave a test to the students. Pre-test was given before the experimental and control classes in same way. This test was given before the experiment was run.
b. Post-Test
Post-test was given to the experimental class and the control class. It was given in order to know the score of students’ achievement after they were taught using picture (experimental class) and without using picture (control class).
2. Documentation
Documentation is a piece of written or printed material that provides a record of evidence or event an agreement, ownership, identification etc.8
The researcher function to the document related to the object research
such as students’ name list and the English subject shcedule. The instruments
here are documents. Document are used to get the information about the students’ achievement there. The researcher collected the data of the activity in the class by taking photograph which helped by her friend or done by herself. The photograph taken when the students doing the try-out test and post test, and while the researcher conducted teaching. In control class and treatment in experimental class. Then, the researcher made some conclusions based on the documentation. In this study, documentation only used to
support the data about the students’ condition reflected on their activity in the
class.
27 F. Data Analysis Technique
There are three kinds of test that will be held in experimental research, they are try-out test, pre-request test, and hypothesis test. So there must be three process of analyzing the data collected from test.
1. Try-out instrument of the test
The writer prepared 25 items as the instrument of the test. Before the items were given to the students, the writer gave tryout test to analyze validity, reliability, difficulty level and also the discrimination power of each item. The tryout was given to VII C of the students of M.Ts. N.U. Nurul Huda Mangkang. After finishing the test, the answer sheets were collected in order to be scored. An analysis was made based on the result of test by using the formula of validity, reliability, the degree of test difficulty and discriminating power.
From 25 test text of tryout, some items were chosen as the instrument of the test. The choosing of the instrument had been done by considering: validity, reliability, the degree of test difficulty and discriminating power.
a. The Validity
The validity is an important quality of any test. It is a condition in which a test can measure what is supposed to be measured. According to Arikunto, a test is valid if it measures what it purpose to be measured.9
Is measurement that shows the validity of instrument? The validity of an item can be known by doing item analysis. It is counted using product – moment correlation formula:
28 rxy : The correlation coefficient between X variable and Y variable N : The number of students
X : The number of each item score Y : The number of total score
Calculation result of rxy is compared with rtable of product
moment by 5% degree of significance. If rxy is higher than rtable, the
item of question is valid.10
b. Reliability
It means “consistent”.11 Reliability refers to the consistency
of test scores. Besides having high validity, a good test should have high reliability too. Alpha formula is used to know reliability of test is K - R. 20.
Where:
r11 : The reliability coefficient of items k : The number of item in the test
p : The proportion of students who give the right answer q : The proportion of students who give the wrong answer S2 : The standard deviation of the test
Calculation result of r11 is compared with rtable of product moment by 5% degree of significance. If r11 is higher than rtable, the
item of question is reliable.12
29 c. Item Analysis
After scoring the try out test, item analysis was carried out to find out the effectiveness of the items. Item analysis discussed two main things:
1) Difficulty level
Heaton states that “ the index of difficulty of an item simply
shows how easy or difficult yhe particular item proved in the test”.13 if a teacher knows deeply about item difficulty in making a test, he can make his test easy, medium, or difficult. A good test is a test that is not really difficult and not really easy. Formula for degree of test difficulty is.
JS B
P
Where:
P : The difficulty’s index
B : The Number of students who has right answer JS : The number of students14
The criteria are:
P = 0.00 p0.30Difficult question P= 0.30 p0.70 Sufficient
P= 0.70 p1.00 Easy
2) Discriminating Power
It is used to know how accurate the question differ higher subject and lower subject.
30
D : The degree of question distinctive
JA : The number of participant the upper group JB : The number of participant in the lower group
BA : The number of participants in the upper group who answered the item correctly
BB : The number of participants in the lower group who answered the item correctly
PA : The proportion of participants in upper group that answered true PB : The proportion of participants in lower group that answered
Before the writer determines the statistical analysis technique used, He examined the normality and homogeneity test of the data.
a. Normality Test
It is used to know the normality of the data that is going to be analyzed whether both groups have normal distribution or not.
31 The normality test with Chi-square is done to find out the distribution data. Step by step Chi-square test is as follows:
Oi =Frequency that was obtained from data Ei= Frequency that was hoped students before the experiment just to make sure that the both classes really are the same.17
The steps as follows:
32
To respond the objectives of the study, the researcher examined the data in the following steps. Firstly, the test was done in both groups, experimental and control group. Secondly, the result of the test of test was scored by using analytic scale. Thirdly, the meanbs score of the two groups were determined. Finally, the two means were compared by applying t-test formula. T-test was used to differentiate if the result of
students’ taught using picture and those taught non picture was significant
33 Where:
1
X : The mean score of the experimental group
2
X : The mean of the control group n1 : The number of experiment group n2 : The number of control group
S12 : The standard deviation of experiment group S22 : The standard deviation of both groups
34 CHAPTER IV
RESEARCH FINDING ANG DISCUSSION
A. Description of Research Finding
To find out the difference between the students who are taught by using picture and the students who are not taught by using picture in prohibition, especially in M.Ts. N.U. Nurul Huda Mangkang Semarang, the writer did an analysis of quantitive data. The data is obtained giving test to the experimental class and control class after giving a different learning both classes.
The subjects of this research were didvided into three classes. They are experimental class (VII A), control class (VII B) and try out class (VII C). Before items were given to the students, the witer gave tryout test to analyze validity, reliability, difficulty level and also the discrimination power of each item. The writer prepared 25 items as the instrument of the test. Test given before and after the students follow the learning process that was provided by the writer.
Before the activities are conducted, the writer determined the materials and lesson plan of learning. Learning in the experimental class used picture, while the control class without used picture.
35 B. The Data Analysis and Test of Hyphothesis
1. The Data Analysis
a. The Data Analysis of Try-out
This discussion covers validity, reability, level of difficulty and discriminating power.
1) Validity of Instrument
As mentioned in chapter III, validity refers to the precise measurement of the test. In this study, item validity is used to know the index validity of the test. To know the validity of instrument, the writer used the Pearson product moment formula to analyze each item.
It is obtained that from 25 test items; there are 20 test items which are valid and 5 test items which are invalid. They are on number 12, 15, 17, 18 ,20 . They are to invalid with the reason the computation result of their r xy value (the correlation of score each item) is lower than
their rtable value.
The following is the example of item validity computation for item number 1 and for the other items would use the same formula.
36 r xy = 0.822
From the computation above, the result of computing validity of the item number 1 is 0.822. After that, the writer consulted the result to the table of r Product moment with the number of subject (N) = 36 and significance level 5% it is 0.32. Since the result of the computation is higher than r table, the index of validity of the item number 1 is considered to be valid.
2) Reability of Instrument
A good test must be valid and reliable. Beside the index of validy, the writer calculateed the reliability of the test using Kuder Richarson formula 20(K-R 20).
Before computing the reliability, the writer had to compute Varian(S2) with the formula bellow:
N = 36 ∑Y = 652 ∑Y2= 425104 ∑ pq = 0.157
37 The computation of the Varian (S2) is 15,098 . After finding the Varian (S2) the writer computed the reliability of the test as follows:
formula:
r 11 =
r 11 =
r 11 =
= 1.030
The result shows that 1.030 is more than 0.329 , it mean that the items of instrument were reliable.
3) The Level of Difficulty
The following is the computation of the level difficulty for item number 1 and for the other items would use the same formula.
B = 18+ 11 =29 JS= 36
P = JS
B
P
P= 0.81
38 After computing 25 items of the try-out test, there are 19 items are considered to be easy, 6 items are enough. The whole computation result of difficulty level can be seen in appendix 1.
4) The Discriminating Power
The discrimination power of an item indicated the extent to which the item discriminated between the testees, separating the more able testees from the less able. The index of dicrimining power told us whether those students who performed well on the whole test tended to do well or badly on each item in the test. To do this analysis, the number of try-out subjects was diveded into two groups, upper and lower groups.
The following is the computation of the discriminating power for number 1, and for other items would use the same formula.
39 The result of the discriminating power of each item could be seen appendix .
Based on the analysis of validity, reliability, difficulty level, and discriminating power, finally 20 item are accepted. They are number 1, 2 ,3 ,4 ,5 ,6, 7, 8, 9,10, 11, 13, 14, 16, 19.
2. Second Analysis
The second analysis represents the result of pre-test and post-test that was done both in experimental and control group. This analysis will answer the research question “ How is the effectiveness of using picture to teach prohibition? we can conclude picture is effective when the result of post test of experimental class (using picture technique) and control class (using conventional technique) has significant differences or the assumption that those classes is equal is not fulfilled.
Before the researcher tested the hypothesis that had been mentioned in the capter two, the researcher analyzed and tested hypothesis prerequisites which contained of normality test and homogeneity test. Second analysis dealt with normality test, homogeneity test, and t-test (test of difference two variants) in pre-test and post-test.
a. Analysis of Pre-test
The experimantal group (Class VII A) was given a pre- test on 21 September, 2011 and control group (Class VII B) was given a pre-test on 20 September, 2011.
1. Test of Normality
40 (X2table) by using 5% alpha of significance. If X2score X2table mean that
the data spread of research result distributed normally.
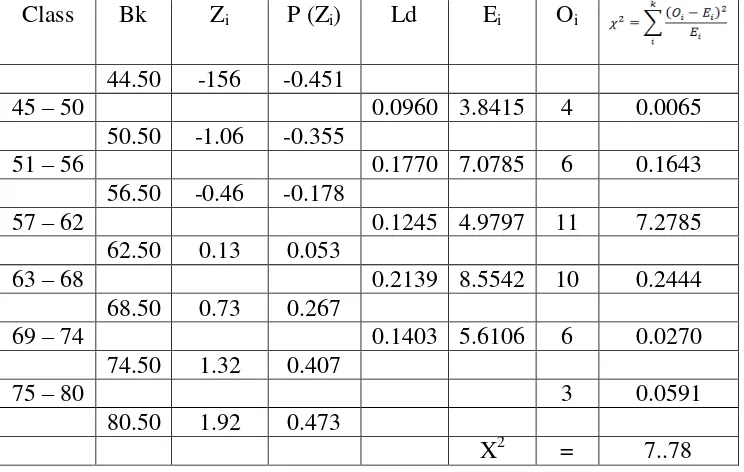
Based on the result of VII A students in experimental group, before they were taught prohibition by using picture, was found that the maximum score was 80 and minimal score was 45. The streches of score were 35. So, there were 6 classes with lenght of classes 6. From the computation of frequency distribution, it was found (∑fixi)= 2446 and (∑fixi2) = 153532. So, the average score (X ¯ ) was 61.15 and the standard deviation (S) was 10.075. After counting the average score and standard deviation, table of distribution frequency was needed to measure Chi- Square (X2score).
Table 3. Table of the Observation Frequency of Class VII A Class Bk Zi P (Zi) Ld Ei Oi
44.50 -156 -0.451
45 – 50 0.0960 3.8415 4 0.0065
50.50 -1.06 -0.355
51 – 56 0.1770 7.0785 6 0.1643
56.50 -0.46 -0.178
57 – 62 0.1245 4.9797 11 7.2785
62.50 0.13 0.053
63 – 68 0.2139 8.5542 10 0.2444
68.50 0.73 0.267
69 – 74 0.1403 5.6106 6 0.0270
74.50 1.32 0.407
75 – 80 3 0.0591
80.50 1.92 0.473
X2 = 7..78
Based on the Chi- Square table (X2table) for 5% alpha of 5%
significance with df 6 -1 = 5 , it was found X2table= 11.07 . Because of
X2score X2 table , so the initial data of control group distributed
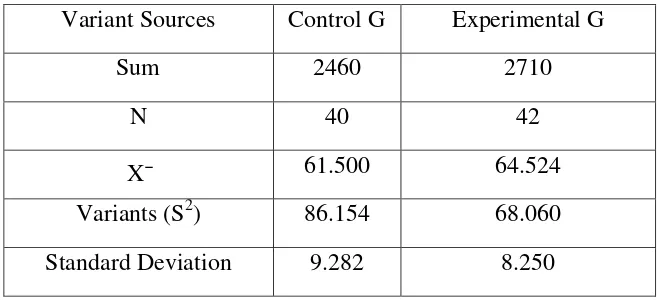
42 was lower than the F table or equal, it could be said that the Ho was accepted. It meant that the variance was homogeneous.
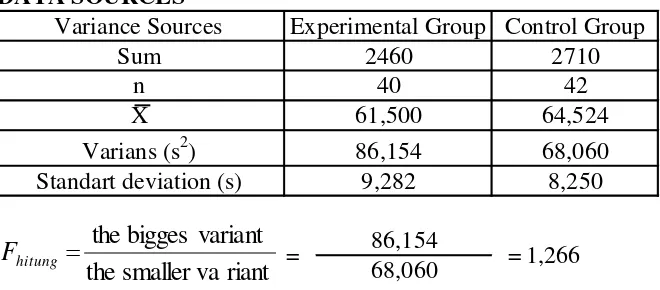
Table 5. Test of Homogeneity
Variant Sources Control G Experimental G
Sum 2460 2710
N 40 42
X¯ 61.500 64.524 Variants (S2) 86.154 68.060 Standard Deviation 9.282 8.250
By knowing the mean and the variance, the writer was able to test the similiarity of the two variants in the pre-test between experimental and control group. The formula of the test of homogeneity as follows:
F = Biggest Variance Smallest Variance = 86.154/ 68.068 = 1.266
On a 5% with df numerator (nb-1) = 40-1 =39 and df denominatore (nk -1) = 42-1 = 41 , it was found Ftable = 1.80 . Because
of Fscore Ftable, so it could be concluded that both experimental and
43 3. Test of Difference Two Variants in Pre-test Between Experimental
and Control Group.
After counting standard deviation and variance, it could be concluded that both group have no differences in the test of similarity between two variances in pre-test score. So, to differentiate whether the students’ result of prohibition in experimental and control group were significant or not, the writer used t-test to test the hypothesis that had been mentioned in the chapter two. The writer used formula:
2
Based on the table IV. First the writer had to find out S by using the formula above:
S = 8.768
After S was found, the next step was to measure t-test:
44 significance of difference between the experimental and control group. It means that both experimental and control group had same condition before getting treatments.
b. Analysis of Post-test
The experimental group was given post test on September 28, 2011 and control group was given a post test on September 27, 2011. Post-test was conducted after all treatments were done. Picture were used as media in the teaching of prohibition to students in experimental group. While for students in control group, they were given treatments without picture. Post-test was aimed to measure students’ ability after they got treatments. 1. Test of Normality
Test of normality was used to find out whether data of control and experimental group which had been collected from the research come from normal distribution normal or not. The result computation of Chi-square (X2 score) then was compared with table of Chi- square (X2table) by using 5% alpha of significance. If X2 score X2table means that
the data spread of research result distributed normally.
45 Table 6. Table of the Observation Frequency of Class VII A
Class Bk Zi P (Zi) Ld Ei Oi
59.50 -2.04 -0.479
60-65 0.0619 2.4772 3 0.1103
65.50 -1.39 -0.417
66-71 0.1487 5.9461 7 0.1868
71.50 -0.73 -0.269
72-77 0.2363 9.4512 11 0.2538
77.50 -0.08 -0.033
78-83 0.1837 7.3470 6 0.2470
83.50 0.57 0.216
84-89 0.1735 6.9394 7 0.0005
89.50 1.22 0.390
90-95 0.0801 3.2049 6 2.4376
95.50 1.88 0.470
X2 = 3.2360
Based on the Chi- Square table (X2 table) for 5% alpha of
significance with df 6-1 = 5, it was found X2 table = 11.7. Because of X2score X2 table , so the initial data of control group distributed normally.
46 Table 7. Table of the Observation Frequency of Class VII B
Class Bk Zi P (Zi) Ld Ei Oi
54.50 -2.23 -0.0485
55 - 60 0.0485 2.0382 3 0.4538
60.50 -1.54 -0.439
61 - 66 0.1352 5.6790 5 0.0812
66.50 -0.85 -0.304
67 - 72 0.2383 10.0076 11 0.0984
72.50 -0.16 -0.065
73 - 78 0.1352 5.6787 10 3.2883
78.50 0.53 0.200
79 - 84 0.1875 7.8748 7 0.0972
84.50 1.22 0.388
85 - 90 0.0837 3.5156 6 1.7557
90.50 1.91 0.472
X2 = 5.7746
Based on the Chi- Square table (X2 table) for 5% alpha of
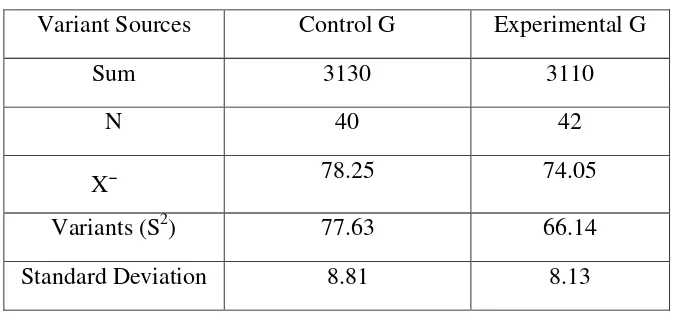
significance with df 6 - 1 = 5, it was found X2 table = 11.07. Because of X2 score X2 table, so the initial data of control group distributed normally. 2. Test of Homogeneity
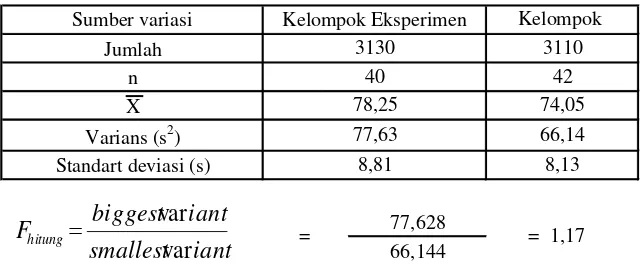
47 Table 8. Test of Homogeneity
Variant Sources Control G Experimental G
Sum 3130 3110
N 40 42
X¯ 78.25 74.05
Variants (S2) 77.63 66.14
Standard Deviation 8.81 8.13
The formula of the test of homogeneity as follows: F = Biggest Variance
Smallest Variance = 77.628/ 66.144 =1.17
On a 5% with df numerator (nb-1)= 40-1= 39 and df denominatore (nk-1) = 42- 1 = 41, it was found Ftable = 1.80. Because
of Fscore Ftable, so it could be concluded that both experimental and
control group had no differences. The result showed both groups had similiar variants (homogenous).
3. Test of Difference Two Variants in Post-test Between Experimental and Control Group.
48
Based on the table VI. First the writer had to find out S by using the formula above:
= 8.470
After S was found, the next step was to measure t-test:
49 Since the obtained t-score was higher than the critical score on the table, the difference was statically significance. Therefore, based on the computation there was a significance difference in prohibition achievement score between students were taught using picture and those taught without using picture for the seventh grade the first semester of M. Ts. N.U. Nurul Huda Mangkang Semarang. So, it can be said that using picture is effective to teach prohibition, and so the action hyphotesis is accepted.
C. Discusssion of Research Finding
The result of the research shows that the experimental class (the students who are taught using picture) has the mean value 78.25. Meanwhile, the control class (the students who are taught without using picture) has the mean value 74.05. It can be said that the test score of prohibition of experimental class is higher than the control class.
On the other hand, the test of hyphotesis using t-test formula shows the value of t-test is higher than critical value. The value of t-test is 2.246 while the critical value on ts 0.05 is 1.980. It means that there is significant difference the achievement in prohibition score between students taught picture and those taught without using picture. In this case, the use of picture is necessary needed in teaching prohibition.
Picture is an effective media to teach prohibition. There are some reasons why picture is effective to teach prohibition. They are as follows:
50 2. The teaching of prohibition using picture can give oppurtinities for the
students to study expressions indirectly.
3. By using picture, the students can learn prohibition relaxes and enjoy. In contrast, not all students have good understanding of prohibition. Those are caused by some factors that influence the students in learning English. They are as follows:
1. The perception that English is the difficult lesson in school. 2. A poor motivation from the students to learn English seriously. 3. There is no big willingness to learn English.