CHAPTER III
RESEARCH METHOD
In this part, the writer described about research methodology that use in conducting the research. It was purpose to answer the problem of the study. This chapter consisted of: time and place of the study, research type, research design, sample of the research, research instrument, research instrument validity, research instruments reliability, data collection procedure, instruments of the study, and the technique of data analysis.
A.Time and Place of Study
The study was conducted at MA Raudhatul Jannah Palangka Raya which located on Surung Street. The writer started the research from July 27th, 2015 until she found the completed data from the English teacher and students at MA Raudhatul Jannah Palangka Raya.
B.Research Type
In this study, the writer used quantitative approach. It was because the writer
measured the students’ writing score by tests; pretest and post-test. Creswell stated
that a quantitative study, consistent with the quantitative paradigm, is an inquiry into a social or human problems based on testing a theory composed of variables, measured with numbers, and analyzed with statistical procedures, in order to determine whether predictive generalizations of the theory hold true.
58
C.Research Design
The type of this study was pre experimental study by utilizing One-group Pre-Test/Post-Test Design. The one-group pretest–posttest design usually involves three steps: (1) administering a pretest measuring the dependent variable; (2) applying the experimental treatment X to the subjects; and (3) administering a posttest, again measuring the dependent variable.59 This design can be diagrammed as followed:
Y1 X Y2
Where:
Y1 : Pretest
Y2 : Posttest
X : Independent
In this experiment, the writer taught the students directly. Firstly, the writer
gave pretest to students in order to measure the students’ score in writing recount text
before using clustering technique. Then, the writer taught the students by using clustering technique. And then, the writer gave Posttest in order to measure the
students’ score after treatment.
58
John W. Creswell, Qualitative and Quantitative Approach, California: SAGE Publications, 1994, p.2.
59
D.Sample of the Research
The small group that is observed is called a sample. A sample is a portion of a population.60 The sample of this study was the tenth grade students of MA Raudhatul Jannah Palangka Raya. The sample consists of 14 students.
The writer chooses one class because based on the fact of the school at MA Raudhatul Jannah Palangka Raya the tenth grade only has one class.
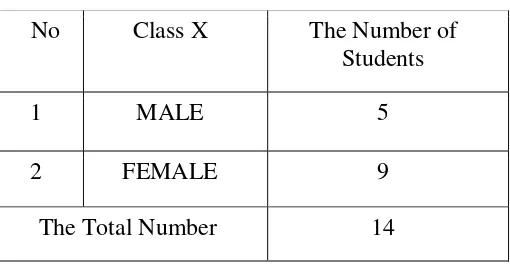
The sample of the study is as shown in the following table: Table 3.1 The Sample of Study
No Class X The Number of Students
1 MALE 5
2 FEMALE 9
The Total Number 14
The writer chose the class as the sample for some reasons. First, the syllabus of the school showed that the material was given in class X. Second, the students were difficult to write into paragraph. Third, the English teacher wanted to know the effect of Clustering technique on students’ writing scores.
E.Research Instruments
The data were very important in the study. The data were needed to prove and support this study. By this collected data, the writer could measure the effectiveness of clustering technique on the students’ ability in writing recount text at MA
60
Raudhatul Jannah Palangka Raya. There are two instruments that would be used in the study to get the data, namely, test and documentation.
1. Test
According to Heaton "Test may be constructed primarily as devices to reinforce learning and to motivate student, or primarily as a means of assessing the student's performance the language.61
The writer collected the main data from pretest and posttest. From the two tests, the writer could find out the effectiveness of
clustering technique on the students’ score in writing recount text at MA Raudhatul
Jannah Palangka Raya. A pretest was given before any teaching. By giving this pretest the writer wants to compare its scores to the posttest scores which would be given after the treatment. A posttest as the last test was also given to get the quantitative data about their writing score after the writer taught recount text with clustering technique. The test item was showed in appendix and adapted from some books, as follow:
INTERLANGUAGE: English for Senior High School Students X: SMA/MA by
Joko Priyana, Riandi, and Anita Prasetyo Mumpuni, Publiser: Pusat Perbukuan, Departemen PendidikanNasional, 2008, Jakarta.
Developing English Competencies 1 for Senior High School (SMA/MA) grade X
by Achmad Doddy, Ahmad Sugeng, and Effendi, Publiser: Departemen Pendidikan Nasional, 2008, Jakarta.
2. Documentation
61
The writer used documentation as the second instrument of the study.
Arikunto’s opinion states that “there are three kinds of source namely paper, place,
and people. This technique was used to collect the data in the form of document on the study place. The data that was needed such as:
a) The amount, the name, and the student’s registration number of the school b) The syllabus of writing subject
c) The student’s score of writing
The writer got all the data above, it was classify the students that was would be the subject of the pretest and the posttest. The writer took some photos when pretest, treatments and the posttest was conducted. The data above is available in appendix 10.
F. Research Instruments Validity
A validity test or measure is one which measures what is intended to measure. Validity must always be examined with respect to the use which is to be made of the values obtained from the measurement procedure.
a) Content Validity
Content validity demands the appropriateness between the ability to be measure and the test being used to measure it.62 The writer used essay test for students. The students in this study would write recount text from essay test instruction, so the test would really measures the writing ability of the students.
62
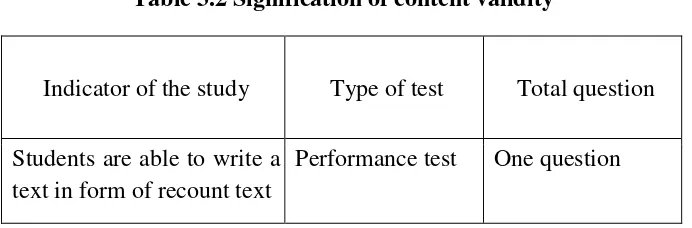
Table 3.2 Signification of content validity
Indicator of the study Type of test Total question
Students are able to write a text in form of recount text
Performance test One question
To measured the validity of the instrument, the writer used the formulation of Product Moment Pearson as follows.63
Where :
rxy : Total coeficient of correlation ∑X : Total value of score X
∑Y : Total value of score Y
∑XY : Multiplecation result between score X and Y
N : Number of students Interpretation
rxy > rt = Valid
rxy < rt = Invalid
The criteria of interpretation the validity.
63
0.800-1.000 = Very High Validity 06.00-0.799 = High Validity 04.00-0.599 = Fair Validity 0.200-0.399 = Poor Validity 0.00-0. 199 = Very poor Validity
Based on the explanation above, in making the test the writer matched each of the items test with the curriculum that is use by MA Raudhatul Jannah Palangka Raya. The purposed was to make the test is appropiate with the lesson that the students accepted in the moment when the research is done.
The writer analyzed the data using Pearson Product Moment calculation manually. Then, re-check the manual calculation using Microsoft Excel program.
The analysis is available in appendix 6.
b) Construct Validity
This type of validity assumes the existence of certain learning theories or constructs underlying the acquisition of abilities and skills.64 The writer constructs the item in this study by comparing the aspect of thinking in the item with the aspect of thinking in base competence in syllabus of senior high school for the tenth grade students. The writer comprised the cognitive and psychomotor aspect of free writing item with the aspect of thinking in writing base competence. The writer also examined their writing from content, organization, sentence structure, and grammar.
64
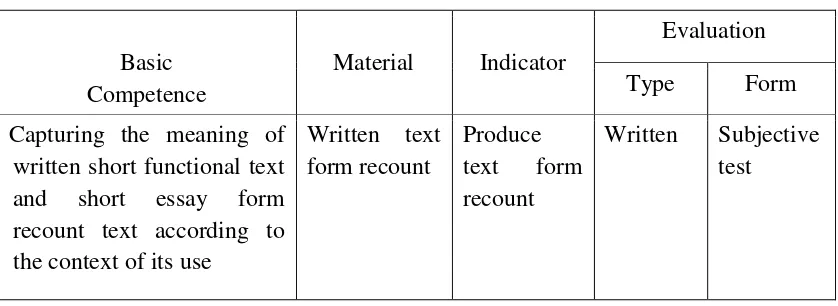
Table 3.3 Syllabus of Writing Recount Text
Face validity is a term sometimes used in connection with a test’s content.65 The types of face validity, if the test items look right to other testers, teacher, indicators and test. The types of test items, which would use in this research, can be suitable to the others at the same level is Islamic Senior High school. For face validity of the test items as follow:
1) The test use written test in essay test instruction. 2) The evaluation by essay test based on scoring system. 3) Kind of the essay test was writing recount text. 4) The Language of items used English
5) The essay test was suitable with syllabus of English writing for tenth grade students at MA Raudhatul Jannah Palangka Raya.
65
G.Research Instruments Reliability
Reliability is necessary characteristic of any good test for it to be valid at all. A test must be reliable as a measuring instrument. It is the degree of consistency with which it measure wherever it is measuring.66
To know whether the reliability of the test is very high, high, average, low, and very
low, the present researcher refered to the following standar:
0.80 – 100 = Very high
0.60 – 0.79 = High
0.40 – 0.59 = Average
0.20 – 0.39 = low
0.0– 0.19 = Very low
In rather reliability, there are inter-rater reliability and intra-rater reliability. Inter-rater reliability is the consistency of the judgment of several raters on how they see a phenomenon or interpreted the responses of the subject.67 It indicates accuracy in scoring composition of two different raters. Meanwhile, intra-rater reliability referred to the consistency of the rater in scoring the same paper at two different points of time. It points out an individual accuracy in scoring a particular composition.68
In this study, the writer applied inter-rater reliability; two raters would
employ to score the students’ writing. The two raters were the writer self and one of
English teacher of MA Raudhatul Jannah Palangka Raya. The steps in determining the reliability of the test were:
66
Ibid, p.236.
67
Sabarun, The Effectiveness of Using an outline in Writing Expository Essay, p. 37
68
a) The First Step: Counting Variance Score of Each Component
Where:
St = Total variance ∑Xi 2
= Total of score
[∑Xi 2
] = Square of score total N = Number of testers
b) The Second Step: Sum of Component Variance
c) The Third Step: Counting Total Variance The Fourth Step: Counting Alpha Value with formula:
Where:
R11 = Value of Reliability
∑St = Sum of Variance Score for Each item
St = Total Variance
K = Sum of items
d) The last decision is comparing the value of r11 and Ttable
To know the level of reliability of instrument, the value of r11 was interpreted
r11>Ttable = Reliable
r11 <Ttable= Not Reliable
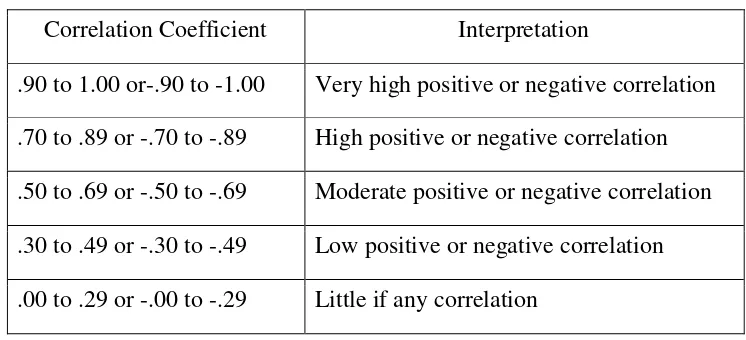
The coefficient correlation and the interpretation of inter rater reliability according to Djiwandono as shows in table:
Table 3.4 Inter-rater coefficients Correlation and Interpretation.
Correlation Coefficient Interpretation
.90 to 1.00 or-.90 to -1.00 Very high positive or negative correlation .70 to .89 or -.70 to -.89 High positive or negative correlation .50 to .69 or -.50 to -.69 Moderate positive or negative correlation .30 to .49 or -.30 to -.49 Low positive or negative correlation .00 to .29 or -.00 to -.29 Little if any correlation
The result of reliability pretest was 0.925 with the Criteria Very High positive Reliability and posttest was 0.698 with the Criteria Moderate positive Reliability. Then, re-check the manual calculation using Microsoft Excel program. The analysis
H.Data Collection Procedures
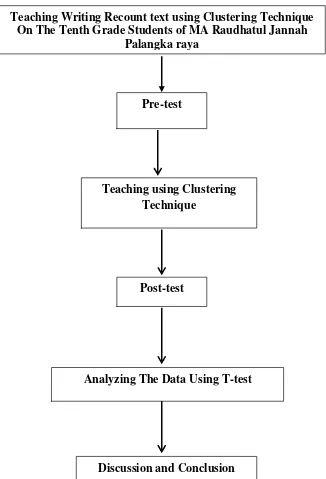
Figure 3.1 Data Collecting Procedure
Based on the figure above, the data collecting procedure was explained as follows:
1. The writer observed the classes. The writer directly did observation in the field where the place was taken. It was done to observe the class condition in learning
Teaching Writing Recount text using Clustering Technique On The Tenth Grade Students of MA Raudhatul Jannah
Palangka raya
Pre-test
Teaching using Clustering Technique
Discussion and Conclusion Analyzing The Data Using T-test
English, to know how the students’ attitude while teaching learning process was
going on.
2. The observation was purposed to get specific data, they were: a. The general description of the location of the study. b. The syllabus and lesson plan of the school.
c. The number of class.
d. The number of students and students’ name e. The number of the English Teacher. 3. Giving pre-test to the students.
4. Teaching English writing for four times to students by implementing the Clustering technique. It supported with lesson plan. ( see appendix 2)
5. Giving post-test to the students. 6. Analyzing the data using T-test. 7. Discussion and Conclusion.
I. The Technique of Data Analysis
In order to analyze the data, the writer did some procedures below: 1. Collecting the students’ score of pretest and posttest.
2. Arranging the obtained score into the distribution of frequency of score table. 3. Calculating mean, median, modus, standard deviation and standard error of
students’ score.
It is used to know the normality of the data that is going to be analyzed whether both groups have normal distribution or not.
5. Homogeneity Test
It is used to know whether experimental group and control group, that were decided, come from population that has relatively same variant or not.
6. Calculated the data by using T-test to test the hypothesis of the study, whether the use clustering technique give effect to the students writing score or not. To examine the hypothesis, the writer used T-test. The formula is as follow:69
to =
Where :
x : Mean of posttest µ : KKM
SD : The Standar Deviation
N : Number of case By the criteria:
If ttest ≥ ttable, Ha is accepted and Ho is rejected.
If ttest < ttable, Ha is rejected and Ho is accepted
7. Calculating the degree of freedom by using the following formula:
8. Determining the level of significance of tobserved by comparing the tobserved with the
ttable.
69
9. Interpreting the result of analyzing.