1205
Diffraction Patterns
and Polarization
C H A P T E R O U T L I N E
38.1
Introduction to Diffraction
Patterns
38.2
Diffraction Patterns from
Narrow Slits
38.3
Resolution of Single-Slit and
Circular Apertures
38.4
The Diffraction Grating
38.5
Diffraction of X-Rays by
Crystals
38.6
Polarization of Light Waves
▲
The Hubble Space Telescope does its viewing above the atmosphere and does not sufferfrom the atmospheric blurring, caused by air turbulence, that plagues ground-based tele-scopes. Despite this advantage, it does have limitations due to diffraction effects. In this chapter we show how the wave nature of light limits the ability of any optical system to distin-guish between closely spaced objects. (©Denis Scott/CORBIS)
1206
aperture acts as if it were a point source of light, with waves entering the shadow region behind the barrier. This phenomenon, known as diffraction, can be described only with a wave model for light, as discussed in Section 35.3. In this chapter, we investigate the features of the diffraction patternthat occurs when the light from the aperture is allowed to fall upon a screen.
In Chapter 34, we learned that electromagnetic waves are transverse. That is, the electric and magnetic field vectors associated with electromagnetic waves are perpen-dicular to the direction of wave propagation. In this chapter, we show that under certain conditions these transverse waves with electric field vectors in all possible transverse directions can be polarized in various ways. This means that only certain directions of the electric field vectors are present in the polarized wave.
38.1
Introduction to Diffraction Patterns
In Section 35.3 we discussed the fact that light of wavelength comparable to or larger than the width of a slit spreads out in all forward directions upon passing through the slit. We call this phenomenon diffraction. This behavior indicates that light, once it has passed through a narrow slit, spreads beyond the narrow path defined by the slit into regions that would be in shadow if light traveled in straight lines. Other waves, such as sound waves and water waves, also have this property of spreading when passing through apertures or by sharp edges.
We might expect that the light passing through a small opening would simply result in a broad region of light on a screen, due to the spreading of the light as it passes through the opening. We find something more interesting, however. A diffraction patternconsisting of light and dark areas is observed, somewhat similar to the interfer-ence patterns discussed earlier. For example, when a narrow slit is placed between a distant light source (or a laser beam) and a screen, the light produces a diffraction pattern like that in Figure 38.1. The pattern consists of a broad, intense central band (called the central maximum), flanked by a series of narrower, less intense additional bands (called side maxima or secondary maxima) and a series of intervening dark bands (or minima). Figure 38.2 shows a diffraction pattern associated with light passing by the edge of an object. Again we see bright and dark fringes, which is reminiscent of an interference pattern.
Figure 38.3 shows a diffraction pattern associated with the shadow of a penny. A bright spot occurs at the center, and circular fringes extend outward from the shadow’s edge. We can explain the central bright spot only by using the wave theory of light, which predicts constructive interference at this point. From the viewpoint of geometric optics (in which light is viewed as rays traveling in straight lines), we expect the center of the shadow to be dark because that part of the viewing screen is completely shielded by the penny.
It is interesting to point out an historical incident that occurred shortly before the central bright spot was first observed. One of the supporters of geometric optics, Figure 38.1 The diffraction
Simeon Poisson, argued that if Augustin Fresnel’s wave theory of light were valid, then a central bright spot should be observed in the shadow of a circular object illuminated by a point source of light. To Poisson’s astonishment, the spot was observed by Dominique Arago shortly thereafter. Thus, Poisson’s prediction reinforced the wave theory rather than disproving it.
38.2
Diffraction Patterns from Narrow Slits
Let us consider a common situation, that of light passing through a narrow opening modeled as a slit, and projected onto a screen. To simplify our analysis, we assume that the observing screen is far from the slit, so that the rays reaching the screen are approximately parallel. This can also be achieved experimentally by using a converging lens to focus the parallel rays on a nearby screen. In this model, the pattern on the screen is called a Fraunhofer diffraction pattern.1
Figure 38.4a shows light entering a single slit from the left and diffracting as it
Figure 38.2 Light from a small source passes by the edge of an opaque object and con-tinues on to a screen. A diffraction pattern consisting of bright and dark fringes appears on the screen in the region above the edge of the object.
▲
PITFALL PREVENTION
38.1
Diffraction vs.
Diffraction Pattern
Diffraction refers to the general behavior of waves spreading out as they pass through a slit. We used diffraction in explaining the existence of an interference pat-tern in Chapter 37. A diffraction patternis actually a misnomer but is deeply entrenched in the lan-guage of physics. The diffraction pattern seen on a screen when a created by the illumination of a penny, with the penny positioned midway between screen and light source. Note the bright spot at the center.
P.M. Rinard,
Am. J. Phys.
44:70,
1976
1 If the screen is brought close to the slit (and no lens is used), the pattern is a Fresneldiffraction
pat-tern. The Fresnel pattern is more difficult to analyze, so we shall restrict our discussion to Fraunhofer diffraction. diffraction pattern of a single slit. The pattern consists of a central bright fringe flanked by much weaker maxima
alternating with dark fringes. (Drawing not to scale.) (b) Photograph of a single-slit Fraunhofer diffraction pattern.
M. Cagnet, M. Francon, and J. C. Thierr
At the Active Figures link at http://www.pse6.com,you can adjust the slit width and the wavelength of the light to see the effect on the diffraction pattern.
diffraction pattern. A bright fringe is observed along the axis at ! "0, with alternating dark and bright fringes on each side of the central bright fringe.
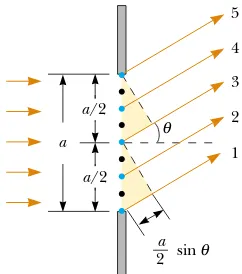
Until now, we have assumed that slits are point sources of light. In this section, we abandon that assumption and see how the finite width of slits is the basis for under-standing Fraunhofer diffraction. We can deduce some important features of this phe-nomenon by examining waves coming from various portions of the slit, as shown in Figure 38.5. According to Huygens’s principle, each portion of the slit acts as a source of light waves. Hence, light from one portion of the slit can interfere with light from another portion, and the resultant light intensity on a viewing screen depends on the direction !. Based on this analysis, we recognize that a diffraction pattern is actually an interference pattern, in which the different sources of light are different portions of the single slit!
To analyze the diffraction pattern, it is convenient to divide the slit into two halves, as shown in Figure 38.5. Keeping in mind that all the waves are in phase as they leave the slit, consider rays 1 and 3. As these two rays travel toward a viewing screen far to the right of the figure, ray 1 travels farther than ray 3 by an amount equal to the path dif-ference (a/2)sin!, where a is the width of the slit. Similarly, the path difference between rays 2 and 4 is also (a/2) sin !, as is that between rays 3 and 5. If this path dif-ference is exactly half a wavelength (corresponding to a phase difdif-ference of 180°), then the two waves cancel each other and destructive interference results. If this is true for two such rays, then it is true for any two rays that originate at points separated by half the slit width because the phase difference between two such points is 180°. Therefore, waves from the upper half of the slit interfere destructively with waves from the lower half when
or when
If we divide the slit into four equal parts and use similar reasoning, we find that the viewing screen is also dark when
Likewise, we can divide the slit into six equal parts and show that darkness occurs on the screen when
Therefore, the general condition for destructive interference is
(38.1)
This equation gives the values of !dark for which the diffraction pattern has zero light intensity—that is, when a dark fringe is formed. However, it tells us nothing about the variation in light intensity along the screen. The general features of the intensity distribution are shown in Figure 38.6. A broad central bright fringe is observed; this fringe is flanked by much weaker bright fringes alternating with dark fringes. The various dark fringes occur at the values of !dark that satisfy Equation 38.1. Each bright-fringe peak lies approximately halfway between its bordering dark-fringe minima. Note that the central bright maximum is twice as wide as the
sec-Figure 38.5 Paths of light rays that encounter a narrow slit of width a and diffract toward a screen in the direction described by angle !. Each portion of the slit acts as a point source of light waves. The path difference between rays 1 and 3, rays 2 and 4, or rays 3 and 5 is same form as Equation 37.2, with
d, the slit separation, used in
Equation 37.2 and a, the slit
width, in Equation 38.1. How-ever, Equation 37.2 describes the
bright regions in a two-slit inter-ference pattern while Equation
38.1 describes the darkregions in
a single-slit diffraction pattern.
Furthermore, m"0 does not
represent a dark fringe in the dif-fraction pattern.
S E C T I O N 3 8 . 2 • Diffraction Patterns from Narrow Slits 1209
Quick Quiz 38.1
Suppose the slit width in Figure 38.6 is made half as wide. The central bright fringe (a) becomes wider (b) remains the same (c) becomes narrower.Quick Quiz 38.2
If a classroom door is open slightly, you can hear sounds coming from the hallway. Yet you cannot see what is happening in the hallway. Why is there this difference? (a) Light waves do not diffract through the single slit of the open doorway. (b) Sound waves can pass through the walls, but light waves cannot. (c) The open door is a small slit for sound waves, but a large slit for light waves. (d) The open door is a large slit for sound waves, but a small slit for light waves.θ
Figure 38.6 Intensity distribution for a Fraunhofer diffraction pattern from a single slit of width a. The positions of two minima on each side of the central maximum are labeled. (Drawing not to scale.)
Example 38.1 Where Are the Dark Fringes?
Light of wavelength 580 nm is incident on a slit having a width of 0.300 mm. The viewing screen is 2.00 m from the
slit. Find the positions of the first dark fringes and the width
of the central bright fringe.
Solution The problem statement cues us to conceptualize
a single-slit diffraction pattern similar to that in Figure 38.6. We categorize this as a straightforward application of our discussion of single-slit diffraction patterns. To analyze the
problem, note that the two dark fringes that flank the
positions of the first minima measured from the central axis
are given by
Answer Based on Equation 38.1, we expect that the angles
at which the dark bands appear will decrease as aincreases.
Thus, the diffraction pattern narrows. For a"3.00 mm, the
sines of the angles !darkfor the m" #1 dark fringes are
The positions of the first minima measured from the central
axis are given by
and the width of the central bright fringe is equal to 2"y1""
7.74&10'4m"0.774 mm. Notice that this is smaller than the width of the slit.
In general, for large values of a, the various maxima and
minima are so closely spaced that only a large central bright area resembling the geometric image of the slit is observed. This is very important in the performance of optical instru-ments such as telescopes.
Investigate the single-slit diffraction pattern at the Interactive Worked Example link athttp://www.pse6.com.
Intensity of Single-Slit Diffraction Patterns
We can use phasors to determine the light intensity distribution for a single-slit dif-fraction pattern. Imagine a slit divided into a large number of small zones, each of width (yas shown in Figure 38.7. Each zone acts as a source of coherent radiation, and each contributes an incremental electric field of magnitude (E at some point on the screen. We obtain the total electric field magnitude E at a point on the screen by summing the contributions from all the zones. The light intensity at this point is proportional to the square of the magnitude of the electric field (Section 37.3).
The incremental electric field magnitudes between adjacent zones are out of phase with one another by an amount (), where the phase difference ()is related to the path difference (ysin!between adjacent zones by an expression given by an argument similar to that leading to Equation 37.8:
(38.2)
To find the magnitude of the total electric field on the screen at any angle !, we sum the incremental magnitudes (Edue to each zone. For small values of !, we can assume that all the (Evalues are the same. It is convenient to use phasor diagrams for various angles, as in Figure 38.8. When ! "0, all phasors are aligned as in Figure 38.8a because all the waves from the various zones are in phase. In this case, the total electric field at the center of the screen is E0"N(E, where Nis the number of zones. The resultant magnitude ER at some small angle ! is shown in Figure 38.8b, where each phasor differs in phase from an adjacent one by an amount (). In this case, ERis the
() " 2*
% (y sin ! P
a ∆y
∆y sin
Viewing screen
θ
θ
Figure 38.7 Fraunhofer diffraction pattern for a single slit. The light inten-sity at a distant screen is the resultant of all the incremental electric field magnitudes from zones of width (y.
= 3
β π
ER
(a)
(b)
(c)
(d)
ER
ER
= 0
β
= 2
β π
vector sum of the incremental magnitudes and hence is given by the length of the chord. Therefore, ER+E0. The total phase difference )between waves from the top and bottom portions of the slit is
(38.3)
where a"N(yis the width of the slit.
As ! increases, the chain of phasors eventually forms the closed path shown in Figure 38.8c. At this point, the vector sum is zero, and so ER"0, corresponding to the first minimum on the screen. Noting that ) "N() "2*in this situation, we see from Equation 38.3 that
That is, the first minimum in the diffraction pattern occurs where sin!dark"%/a; this is in agreement with Equation 38.1.
At larger values of !, the spiral chain of phasors tightens. For example, Figure 38.8d represents the situation corresponding to the second maximum, which occurs when ) "360°,180°"540°(3*rad). The second minimum (two complete circles, not shown) corresponds to ) "720°(4*rad), which satisfies the condition sin!dark" 2%/a.
We can obtain the total electric-field magnitude ERand light intensity Iat any point on the screen in Figure 38.7 by considering the limiting case in which (y becomes infinitesimal (dy) and Napproaches -. In this limit, the phasor chains in Figure 38.8 become the curve of Figure 38.9. The arc length of the curve is E0 because it is the sum of the magnitudes of the phasors (which is the total electric field magnitude at the center of the screen). From this figure, we see that at some angle !, the resultant electric field magnitude ER on the screen is equal to the chord length. From the triangle containing the angle )/2, we see that
where Ris the radius of curvature. But the arc length E0is equal to the product R), where )is measured in radians. Combining this information with the previous expres-sion gives
Because the resultant light intensity Iat a point on the screen is proportional to the square of the magnitude ER, we find that
(38.4)
where Imaxis the intensity at ! "0 (the central maximum). Substituting the expression for )(Eq. 38.3) into Equation 38.4, we have
(38.5)
From this result, we see that minimaoccur when
*a sin!dark
Figure 38.9 Phasor diagram for a large number of coherent sources. All the ends of the phasors lie on the circular arc of radius R. The resultant electric field magnitude ERequals the length of the chord.
or
in agreement with Equation 38.1.
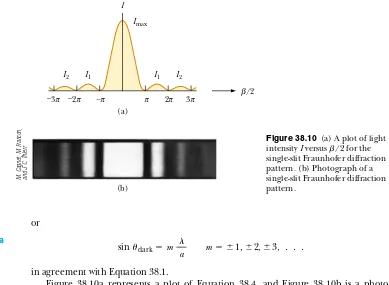
Figure 38.10a represents a plot of Equation 38.4, and Figure 38.10b is a photo-graph of a single-slit Fraunhofer diffraction pattern. Note that most of the light inten-sity is concentrated in the central bright fringe.
m" #1, #2, #3, $ $ $
Figure 38.10 (a) A plot of light intensity Iversus )/2 for the single-slit Fraunhofer diffraction pattern. (b) Photograph of a single-slit Fraunhofer diffraction pattern.
M. Cagnet, M. Francon, and J. C. Thierr
Example 38.2 Relative Intensities of the Maxima
Find the ratio of the intensities of the secondary maxima to the intensity of the central maximum for the single-slit Fraunhofer diffraction pattern.
Solution To a good approximation, the secondary maxima
lie midway between the zero points. From Figure 38.10a,
we see that this corresponds to )/2 values of 3*/2, 5*/2,
7*/2, . . . . Substituting these values into Equation 38.4
gives for the first two ratios
0.045
the central maximum) have an intensity of 4.5% that of the central maximum, and the next secondary maxima have an intensity of 1.6% that of the central maximum.
0.016
When more than one slit is present, we must consider not only diffraction patterns due to the individual slits but also the interference patterns due to the waves coming from different slits. Notice the curved dashed lines in Figure 37.14, which indicate a decrease in intensity of the interference maxima as !increases. This decrease is due to a diffraction pattern. To determine the effects of both two-slit interference and a single-slit diffraction pattern from each slit, we combine Equations 37.12 and 38.5:
(38.6)
Although this expression looks complicated, it merely represents the single-slit diffraction pattern (the factor in square brackets) acting as an “envelope” for a two-slit
interference pattern (the cosine-squared factor), as shown in Figure 38.11. The broken blue curve in Figure 38.11 represents the factor in square brackets in Equa-tion 38.6. The cosine-squared factor by itself would give a series of peaks all with the same height as the highest peak of the red-brown curve in Figure 38.11. Because of the effect of the square-bracket factor, however, these peaks vary in height as shown.
Equation 37.2 indicates the conditions for interference maxima as d sin! "m%, where d is the distance between the two slits. Equation 38.1 specifies that the first diffraction minimum occurs when asin! " %, where ais the slit width. Dividing Equa-tion 37.2 by EquaEqua-tion 38.1 (with m"1) allows us to determine which interference maximum coincides with the first diffraction minimum:
(38.7)
In Figure 38.11, d/a"18/m/3.0/m"6. Therefore, the sixth interference maximum (if we count the central maximum as m"0) is aligned with the first diffraction minimum and cannot be seen.
d a "m d sin! a sin! "
m % %
S E C T I O N 3 8 . 2 • Diffraction Patterns from Narrow Slits 1213
I
Diffraction envelope
Interference fringes
–3 –2 –π π 2 3
/2
β
π π π π
Active Figure 38.11 The combined effects of two-slit and single-slit interference. This is the pattern produced when 650-nm light waves pass through two 3.0-/m slits that are 18/m apart. Notice how the diffraction pattern acts as an “envelope” and controls the intensity of the regularly spaced interference maxima.
Courtesy of Central Scientific Company
At the Active Figures link at http://www.pse6.com,you can adjust the slit width, slit separation, and the wavelength of the light to see the effect on the interference pattern.
Quick Quiz 38.3
Using Figure 38.11 as a starting point, make a sketch of the combined diffraction and interference pattern for 650-nm light waves striking two38.3
Resolution of Single-Slit
and Circular Apertures
The ability of optical systems to distinguish between closely spaced objects is limited because of the wave nature of light. To understand this difficulty, consider Figure 38.12, which shows two light sources far from a narrow slit of width a. The sources can be two noncoherent point sources S1and S2—for example, they could be two distant stars. If no interference occurred between light passing through different parts of the slit, two distinct bright spots (or images) would be observed on the viewing screen. However, because of such interference, each source is imaged as a bright central region flanked by weaker bright and dark fringes—a diffraction pattern. What is observed on the screen is the sum of two diffraction patterns: one from S1, and the other from S2.
If the two sources are far enough apart to keep their central maxima from overlap-ping as in Figure 38.12a, their images can be distinguished and are said to be resolved. If the sources are close together, however, as in Figure 38.12b, the two central maxima overlap, and the images are not resolved. To determine whether two images are resolved, the following condition is often used:
Quick Quiz 38.4
Consider the central peak in the diffraction envelope in Figure 38.11. Suppose the wavelength of the light is changed to 450 nm. What happens to this central peak? (a) The width of the peak decreases and the number of inter-ference fringes it encloses decreases. (b) The width of the peak decreases and the number of interference fringes it encloses increases. (c) The width of the peak decreases and the number of interference fringes it encloses remains the same. (d) The width of the peak increases and the number of interference fringes it encloses decreases. (e) The width of the peak increases and the number of interference fringes it encloses increases. (f) The width of the peak increases and the number of interfer-ence fringes it encloses remains the same.S1
S2 S1
S2
Slit Viewing screen
(a) (b)
Slit Viewing screen
θ θ
Figure 38.12 Two point sources far from a narrow slit each produce a diffraction pattern. (a) The angle subtended by the sources at the slit is large enough for the diffraction patterns to be distinguishable. (b) The angle subtended by the sources is so small that their diffraction patterns overlap, and the images are not well resolved. (Note that the angles are greatly exaggerated. The drawing is not to scale.)
From Rayleigh’s criterion, we can determine the minimum angular separation !min subtended by the sources at the slit in Figure 38.12 for which the images are just resolved. Equation 38.1 indicates that the first minimum in a single-slit diffraction pattern occurs at the angle for which
where ais the width of the slit. According to Rayleigh’s criterion, this expression gives the smallest angular separation for which the two images are resolved. Because % ++a in most situations, sin! is small, and we can use the approximation sin!!!. Therefore, the limiting angle of resolution for a slit of width ais
(38.8)
where !minis expressed in radians. Hence, the angle subtended by the two sources at the slit must be greater than %/aif the images are to be resolved.
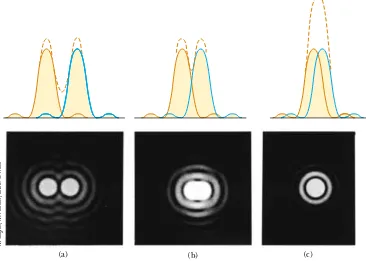
Many optical systems use circular apertures rather than slits. The diffraction pattern of a circular aperture, as shown in the lower half of Figure 38.13, consists of a central circular bright disk surrounded by progressively fainter bright and dark rings. Figure 38.13 shows diffraction patterns for three situations in which light from two point sources passes through a circular aperture. When the sources are far apart, their images are well resolved (Fig. 38.13a). When the angular separation of the sources satisfies Rayleigh’s criterion, the images are just resolved (Fig. 38.13b). Finally, when the sources are close together, the images are said to be unresolved (Fig. 38.13c).
!min" % a sin! " % a
S E C T I O N 3 8 . 3 • Resolution of Single-Slit and Circular Apertures 1215
(b)
(a) (c)
Figure 38.13 Individual diffraction patterns of two point sources (solid curves) and the resultant patterns (dashed curves) for various angular separations of the sources. In each case, the dashed curve is the sum of the two solid curves. (a) The sources are far apart, and the patterns are well resolved. (b) The sources are closer together such that the angular separation just satisfies Rayleigh’s criterion, and the
patterns are just resolved. (c) The sources are so close together that the patterns are not resolved.
Analysis shows that the limiting angle of resolution of the circular aperture is
(38.9)
where Dis the diameter of the aperture. Note that this expression is similar to Equa-tion 38.8 except for the factor 1.22, which arises from a mathematical analysis of
dif-Quick Quiz 38.5
Cat’s eyes have pupils that can be modeled as vertical slits. At night, would cats be more successful in resolving (a) headlights on a distant car, or (b) vertically-separated lights on the mast of a distant boat?Quick Quiz 38.6
Suppose you are observing a binary star with a telescopeand are having difficulty resolving the two stars. You decide to use a colored filter to
maximize the resolution. (A filter of a given color transmits only that color of light.)
What color filter should you choose? (a) blue (b) green (c) yellow (d) red.
Example 38.3 Limiting Resolution of a Microscope
Light of wavelength 589 nm is used to view an object under a microscope. If the aperture of the objective has a diameter of 0.900 cm,
(A) what is the limiting angle of resolution?
Solution Using Equation 38.9, we find that the limiting
angle of resolution is
This means that any two points on the object subtending an angle smaller than this at the objective cannot be distin-guished in the image.
(B) If it were possible to use visible light of any wavelength,
what would be the maximum limit of resolution for this microscope?
Solution To obtain the smallest limiting angle, we have to
use the shortest wavelength available in the visible spectrum. Violet light (400 nm) gives a limiting angle of resolution of
5.42&10'5 rad have on resolving power when 589-nm light is used?
Answer Because light travels more slowly in water, we
know that the wavelength of the light in water is smaller than that in vacuum. Based on Equation 38.9, we expect
the limiting angle of resolution to be smaller. To find the
new value of the limiting angle of resolution, we first
calcu-late the wavelength of the 589-nm light in water using Equation 35.7:
The limiting angle of resolution at this wavelength is
which is indeed smaller than that calculated in part (A). 6.00&10'5 rad
Example 38.4 Resolution of the Eye
Estimate the limiting angle of resolution for the human eye, assuming its resolution is limited only by diffraction.
Solution Let us choose a wavelength of 500 nm, near the
center of the visible spectrum. Although pupil diameter varies from person to person, we estimate a daytime
S E C T I O N 3 8 . 4 • The Diffraction Grating 1217
S1
S2
L
d θmin
Figure 38.14 (Example 38.4) Two point sources separated by a distance das observed by the eye.
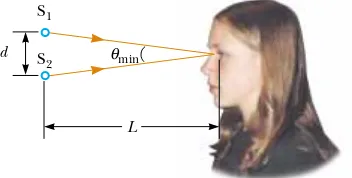
We can use this result to determine the minimum
sepa-ration distance dbetween two point sources that the eye can
distinguish if they are a distance Lfrom the observer (Fig.
38.14). Because !minis small, we see that
For example, if the point sources are 25 cm from the eye (the near point), then
This is approximately equal to the thickness of a human hair.
d"(25 cm)(3&10'4 rad)"8&10'3 cm d"L!min
sin !min!!min! d
L
Example 38.5 Resolution of a Telescope
The Keck telescope at Mauna Kea, Hawaii, has an effective diameter of 10 m. What is its limiting angle of resolution for 600-nm light?
Solution Because D"10 m and % "6.00&10'7m,
Equa-tion 38.9 gives
Any two stars that subtend an angle greater than or equal to this value are resolved (if atmospheric conditions are ideal). The Keck telescope can never reach its diffraction limit because the limiting angle of resolution is always set by atmos-pheric blurring at optical wavelengths. This seeing limit is usu-ally about 1 s of arc and is never smaller than about 0.1 s of arc. (This is one of the reasons for the superiority of pho-tographs from the Hubble Space Telescope, which views celes-tial objects from an orbital position above the atmosphere.)
What If? What if we consider radio telescopes? These optical telescopes? For example, the radio telescope at Arecibo, Puerto Rico, has a diameter of 305 m and is designed to detect radio waves of 0.75-m wavelength. How does its resolution compare to that of the Keck telescope?
Answer The increase in diameter might suggest that radio
telescopes would have better resolution, but Equation 38.9
shows that !mindepends on bothdiameter and wavelength.
Calculating the minimum angle of resolution for the radio
telescope, we find
Notice that this limiting angle of resolution is measured in
minutesof arc rather than the secondsof arc for the optical telescope. Thus, the change in wavelength more than compensates for the increase in diameter, and the limiting angle of resolution for the Arecibo radio telescope is
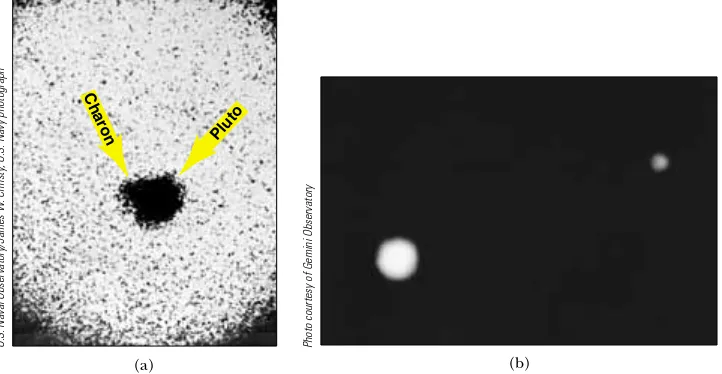
As an example of the effects of atmospheric blurring mentioned in Example 38.5, con-sider telescopic images of Pluto and its moon Charon. Figure 38.15a shows the image taken in 1978 that represents the discovery of Charon. In this photograph taken from an Earth-based telescope, atmospheric turbulence causes the image of Charon to appear only as a bump on the edge of Pluto. In comparison, Figure 38.15b shows a photograph taken with the Hubble Space Telescope. Without the problems of atmos-pheric turbulence, Pluto and its moon are clearly resolved.
38.4
The Diffraction Grating
be made by cutting parallel grooves on the surface of a reflective material. The reflection of light from the spaces between the grooves is specular, and the reflection from the grooves cut into the material is diffuse. Thus, the spaces between the grooves act as paral-lel sources of reflected light, like the slits in a transmission grating. Current technology can produce gratings that have very small slit spacings. For example, a typical grating ruled with 5 000 grooves/cm has a slit spacing d"(1/5 000) cm"2.00&10'4cm.
A section of a diffraction grating is illustrated in Figure 38.16. A plane wave is inci-dent from the left, normal to the plane of the grating. The pattern observed on the
(a)
Pluto Charon
(b)
Figure 38.15 (a) The photograph on which Charon, the moon of Pluto, was discov-ered in 1978. From an Earth-based telescope, atmospheric blurring results in Charon appearing only as a subtle bump on the edge of Pluto. (b) A Hubble Space Telescope photo of Pluto and Charon, clearly resolving the two objects.
Photo courtesy of Gemini Observatory
U.S. Naval Observatory/James W
. Christy
, U.S. Navy photograph
d θ
= d sinθ
δ
P
First-order maximum (m = 1)
Central or zeroth-order
maximum (m = 0)
First-order maximum (m = –1) Incoming plane
wave of light
P
Diffraction grating
θ
Figure 38.16 Side view of a diffraction grating. The slit separation is d, and the path difference between adjacent slits is dsin !.
▲
PITFALL PREVENTION
38.3
A Diffraction Grating
Is an Interference
Grating
As with diffraction pattern,
diffrac-tion grating is a misnomer, but is deeply entrenched in the language of physics. The tion grating depends on diffrac-tion in the same way as the
double slit—spreading the light
so that light from different slits can interfere. It would be more
correct to call it an interference
screen (far to the right of Figure 38.16) is the result of the combined effects of ference and diffraction. Each slit produces diffraction, and the diffracted beams inter-fere with one another to produce the final pattern.
The waves from all slits are in phase as they leave the slits. However, for some arbi-trary direction !measured from the horizontal, the waves must travel different path lengths before reaching the screen. From Figure 38.16, note that the path difference 0 between rays from any two adjacent slits is equal to d sin !. If this path difference equals one wavelength or some integral multiple of a wavelength, then waves from all slits are in phase at the screen and a bright fringe is observed. Therefore, the condi-tion for maximain the interference pattern at the angle !brightis
(38.10)
We can use this expression to calculate the wavelength if we know the grating spacingdand the angle !bright. If the incident radiation contains several wavelengths, the mth-order maximum for each wavelength occurs at a specific angle. All wavelengths are seen at ! "0, corresponding to m"0, the zeroth-order maximum. The first-order maxi-mum (m"1) is observed at an angle that satisfies the relationship sin !bright"%/d; the second-order maximum (m"2) is observed at a larger angle !bright, and so on.
The intensity distribution for a diffraction grating obtained with the use of a mono-chromatic source is shown in Figure 38.17. Note the sharpness of the principal maxima and the broadness of the dark areas. This is in contrast to the broad bright fringes characteristic of the two-slit interference pattern (see Fig. 37.7). You should also review Figure 37.14, which shows that the width of the intensity maxima decreases as the number of slits increases. Because the principal maxima are so sharp, they are much brighter than two-slit interference maxima.
A schematic drawing of a simple apparatus used to measure angles in a diffraction pattern is shown in Figure 38.18. This apparatus is a diffraction grating spectrometer. The light to be analyzed passes through a slit, and a collimated beam of light is incident on the grating. The diffracted light leaves the grating at angles that satisfy Equation 38.10, and a telescope is used to view the image of the slit. The wavelength can be deter-mined by measuring the precise angles at which the images of the slit appear for the various orders. versus sin !for a diffraction grating. The zeroth-, first-, and second-order maxima are shown.
At the Active Figures link athttp://www.pse6.com, you can choose the number of slits to be illuminated to see the effect on the interference
The spectrometer is a useful tool in atomic spectroscopy, in which the light from an atom is analyzed to find the wavelength components. These wavelength components can be used to identify the atom. We will investigate atomic spectra in Chapter 42 of the extended version of this text.
Another application of diffraction gratings is in the recently developed grating light valve (GLV), which may compete in the near future in video projection with the digital micromirror devices (DMDs) discussed in Section 35.4. The grating light valve consists of a silicon microchip fitted with an array of parallel silicon nitride ribbons coated with a thin layer of aluminum (Fig. 38.19). Each ribbon is about 20/m long and about 5 /m wide and is separated from the silicon substrate by an air gap on the order of 100 nm. With no voltage applied, all ribbons are at the same level. In this situation, the array of ribbons acts as a flat surface, specularly reflecting incident light.
When a voltage is applied between a ribbon and the electrode on the silicon substrate, an electric force pulls the ribbon downward, closer to the substrate. Alternate ribbons can be pulled down, while those in between remain in the higher configuration. As a result, the array of ribbons acts as a diffraction grating, such that the constructive interference for a particular wavelength of light can be directed toward a screen or other optical display system. By using three such devices, one each for red, blue, and green light, full-color display is possible.
The GLV tends to be simpler to fabricate and higher in resolution than compara-ble DMD devices. On the other hand, DMD devices have already made an entry into the market. It will be interesting to watch this technology competition in future years.
Figure 38.19 A small portion of a grating light valve. The alternating reflective ribbons at different levels act as a diffraction grating, offering very-high-speed control of the direction of light toward a digital display device.
Quick Quiz 38.7
If laser light is reflected from a phonograph record or a compact disc, a diffraction pattern appears. This is due to the fact that both devicescontain parallel tracks of information that act as a reflection diffraction grating. Which
device, (a) record or (b) compact disc, results in diffraction maxima that are farther apart in angle?
Quick Quiz 38.8
Ultraviolet light of wavelength 350 nm is incident on adif-fraction grating with slit spacing d and forms an interference pattern on a screen a
distance Laway. The angular positions !brightof the interference maxima are large. The
locations of the bright fringes are marked on the screen. Now red light of wavelength 700 nm is used with a diffraction grating to form another diffraction pattern on the screen. The bright fringes of this pattern will be located at the marks on the screen if
S E C T I O N 3 8 . 4 • The Diffraction Grating 1221
(a) the screen is moved to a distance 2Lfrom the grating (b) the screen is moved to
a distance L/2 from the grating (c) the grating is replaced with one of slit spacing 2d
(d) the grating is replaced with one of slit spacing d/2 (e) nothing is changed.
Conceptual Example 38.6 A Compact Disc Is a Diffraction Grating
Light reflected from the surface of a compact disc is
multicol-ored, as shown in Figure 38.20. The colors and their intensi-ties depend on the orientation of the disc relative to the eye and relative to the light source. Explain how this works.
Solution The surface of a compact disc has a spiral grooved
track (with adjacent grooves having a separation on the
order of 1/m). Thus, the surface acts as a reflection grating.
The light reflecting from the regions between these closely
spaced grooves interferes constructively only in certain direc-tions that depend on the wavelength and on the direction of the incident light. Any section of the disc serves as a diffrac-tion grating for white light, sending different colors in differ-ent directions. The differdiffer-ent colors you see when viewing one section change as the light source, the disc, or you move to change the angles of incidence or diffraction.
Figure 38.20 (Conceptual Example 38.6) A compact disc observed under white light. The colors observed in the reflected light and their intensities depend on the orientation of the disc relative to the eye and relative to the light source.
©
Kristen Brochmann/Fundamental Photographs
Example 38.7 The Orders of a Diffraction Grating
Monochromatic light from a helium–neon laser (% "
632.8 nm) is incident normally on a diffraction grating con-taining 6 000 grooves per centimeter. Find the angles at
which the first- and second-order maxima are observed.
Solution First, we must calculate the slit separation, which
is equal to the inverse of the number of grooves per centimeter:
For the first-order maximum (m"1), we obtain
22.311
!1"
sin !1"
%
d "
632.8 nm
1 667 nm "0.379 6
d" 1
6 000 cm"1.667&10
'4 cm"1 667 nm
For the second-order maximum (m"2), we find
What If? What if we look for the third-order maximum? Do we find it?
Answer For m"3, we find sin!3"1.139. Because sin!
cannot exceed unity, this does not represent a realistic
solu-tion. Hence, only zeroth-, first-, and second-order maxima
are observed for this situation.
49.391
!2"
sin !2"
2%
d "
2(632.8 nm)
1 667 nm "0.759 2
Investigate the interference pattern from a diffraction grating at the Interactive Worked Example link at http://www.pse6.com.
Resolving Power of the Diffraction Grating
The diffraction grating is useful for measuring wavelengths accurately. Like the prism, the diffraction grating can be used to separate white light into its wavelength compo-nents. Of the two devices, a grating with very small slit separation is more precise if one wants to distinguish two closely spaced wavelengths.
For two nearly equal wavelengths %1and %2between which a diffraction grating can just barely distinguish, the resolving powerRof the grating is defined as
(38.11)
where % "(%1,%2)/2 and (% " %2'%1. Thus, a grating that has a high resolv-ing power can distresolv-inguish small differences in wavelength. If N slits of the grating are illuminated, it can be shown that the resolving power in the mth-order diffraction is
(38.12)
Thus, resolving power increases with increasing order number and with increasing number of illuminated slits.
Note that R"0 for m"0; this signifies that all wavelengths are indistinguishable for the zeroth-order maximum. However, consider the second-order diffraction pattern (m"2) of a grating that has 5 000 rulings illuminated by the light source. The resolving power of such a grating in second order is R"5 000&2"10 000. Therefore, for a mean wavelength of, for example, 600 nm, the minimum wavelength separation between two spectral lines that can be just resolved is (% " %/R"6.00&10'2nm. For the third-order principal maximum, R"15 000 and (% "4.00&10'2nm, and so on.
Example 38.8 Resolving Sodium Spectral Lines
When a gaseous element is raised to a very high temperature, the atoms emit radiation having discrete wavelengths. The set
of wavelengths for a given element is called its atomic spectrum
(Chapter 42).Two strong components in the atomic spectrum
of sodium have wavelengths of 589.00 nm and 589.59 nm.
(A) What resolving power must a grating have if these
how many slits of the grating must be illuminated?
Solution From Equation 38.12 and the result to part (A),
One interesting application of diffraction gratings is
holography,the production of three-dimensional images of objects. The physics of holography was developed by Dennis Gabor in 1948, and resulted in the Nobel Prize in physics for Gabor in 1971. The requirement of coher-ent light for holography, however, delayed the realization
of holographic images from Gabor’s work until the
development of lasers in the 1960s. Figure 38.21 shows a hologram and the three-dimensional character of its image.
Figure 38.22 shows how a hologram is made. Light from
the laser is split into two parts by a half-silvered mirror at B.
One part of the beam reflects off the object to be
pho-tographed and strikes an ordinary photographic film. The
other half of the beam is diverged by lens L2, reflects from
mirrors M1 and M2, and finally strikes the film. The two
beams overlap to form an extremely complicated
interfer-ence pattern on the film. Such an interference pattern can
be produced only if the phase relationship of the two waves
is constant throughout the exposure of the film. This
condi-tion is met by illuminating the scene with light coming phase difference, an interference pattern is formed that produces an image in which all three-dimensional informa-tion available from the perspective of any point on the holo-gram is preserved.
In a normal photographic image, a lens is used to focus the image so that each point on the object corresponds to a
single point on the film. Notice that there is no lens used in
Figure 38.22 to focus the light onto the film. Thus, light
from each point on the object reaches allpoints on the film.
As a result, each region of the photographic film on which
the hologram is recorded contains information about all illuminated points on the object. This leads to a remarkable
S E C T I O N 3 8 . 4 • The Diffraction Grating 1223
result—if a small section of the hologram is cut from the
film, the complete image can be formed from the small piece!
(The quality of the image is reduced, but the entire image is present.)
A hologram is best viewed by allowing coherent light
to pass through the developed film as one looks back
along the direction from which the beam comes. The
interference pattern on the film acts as a diffraction
grat-ing. Figure 38.23 shows two rays of light striking the film
and passing through. For each ray, the m"0 and m" #1
rays in the diffraction pattern are shown emerging from
the right side of the film. The m" ,1 rays converge to
form a real image of the scene, which is not the image that is normally viewed. By extending the light rays
corre-sponding to m" '1 back behind the film, we see that
there is a virtual image located there, with light coming from it in exactly the same way that light came from
the actual object when the film was exposed. This is
the image that we see by looking through the
holo-graphicfilm.
Holograms are finding a number of applications. You
may have a hologram on your credit card. This is a special
type of hologram called a rainbow hologram,designed to be
viewed in reflected white light.
M2
Film L1
B L2
Laser
M1
Figure 38.21 In this hologram, a circuit board is shown from two different views. Notice the difference in the appearance of the measuring tape and the view through the magnifying lens.
Figure 38.22 Experimental arrangement for produc-ing a hologram.
Photo by Ronald R. Erickson; hologram by Nicklaus Phillips
Virtual image Hologram
Incoming light ray
Incoming light ray
m = 0
m = –1
m = +1
m = –1
m = 0 Real image
m = +1
38.5
Diffraction of X-Rays by Crystals
In principle, the wavelength of any electromagnetic wave can be determined if a grating of the proper spacing (on the order of %) is available. X-rays, discovered by Wilhelm Roentgen (1845–1923) in 1895, are electromagnetic waves of very short wavelength (on the order of 0.1 nm). It would be impossible to construct a grating having such a small spacing by the cutting process described at the beginning of Section 38.4. However, the atomic spacing in a solid is known to be about 0.1 nm. In 1913, Max von Laue (1879–1960) suggested that the regular array of atoms in a crystal could act as a three-dimensional diffraction grating for x-rays. Subsequent experiments confirmed this prediction. The diffraction patterns from crystals are complex because of the three-dimensional nature of crystal structure. Nevertheless, x-ray diffraction has proved to be an invaluable technique for elucidating these structures and for under-standing the structure of matter.
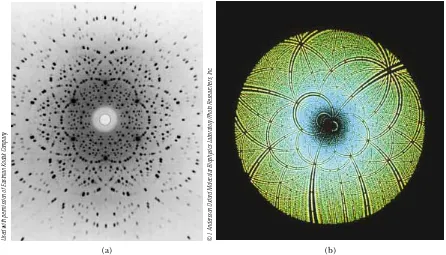
Figure 38.24 is one experimental arrangement for observing x-ray diffraction from a crystal. A collimated beam of monochromatic x-rays is incident on a crystal. The diffracted beams are very intense in certain directions, corresponding to constructive interference from waves reflected from layers of atoms in the crystal. The diffracted beams, which can be detected by a photographic film, form an array of spots known as a Laue pattern, as in Figure 38.25a.One can deduce the crystalline structure by analyz-ing the positions and intensities of the various spots in the pattern. Fig. 38.25b shows a Laue pattern from a crystalline enzyme, using a wide range of wavelengths so that a swirling pattern results.
The arrangement of atoms in a crystal of sodium chloride (NaCl) is shown in Figure 38.26. Each unit cell (the geometric solid that repeats throughout the crystal) is a cube having an edge length a. A careful examination of the NaCl structure shows that the ions lie in discrete planes (the shaded areas in Fig. 38.26). Now suppose that an incident x-ray beam makes an angle !with one of the planes, as in Figure 38.27. The beam can be reflected from both the upper plane and the lower one. However, Photographic
film Collimator
X-ray tube
Crystal X-rays
Figure 38.24 Schematic diagram of the technique used to observe the diffraction of x-rays by a crystal. The array of spots formed on the film is called a Laue pattern.
Figure 38.25 (a) A Laue pattern of a single crystal of the mineral beryl (beryllium alu-minum silicate). Each dot represents a point of constructive interference. (b) A Laue pattern of the enzyme Rubisco, produced with a wide-band x-ray spectrum. This enzyme is present in plants and takes part in the process of photosynthesis. The Laue pattern is used to determine the crystal structure of Rubisco.
©
I. Andersson Oxford Molecular Biophysics Laboratory/Photo Researchers, Inc.
(b) (a)
the beam reflected from the lower plane travels farther than the beam reflected from the upper plane. The effective path difference is 2d sin !. The two beams reinforce each other (constructive interference) when this path difference equals some integer multiple of %. The same is true for reflection from the entire family of parallel planes. Hence, the condition for constructive interference (maxima in the reflected beam) is
(38.13)
This condition is known as Bragg’s law, after W. L. Bragg (1890–1971), who first derived the relationship. If the wavelength and diffraction angle are measured, Equa-tion 38.13 can be used to calculate the spacing between atomic planes.
38.6
Polarization of Light Waves
In Chapter 34 we described the transverse nature of light and all other electromag-netic waves. Polarization, discussed in this section, is firm evidence of this transverse nature.
An ordinary beam of light consists of a large number of waves emitted by the atoms of the light source. Each atom produces a wave having some particular orientation of the electric field vector E, corresponding to the direction of atomic vibration. The direction of polarization of each individual wave is defined to be the direction in which the electric field is vibrating. In Figure 38.28, this direction happens to lie along the y axis. However, an individual electromagnetic wave could have its E vector in the yz plane, making any possible angle with the y axis. Because all directions of vibration from a wave source are possible, the resultant electromagnetic wave is a superposition of waves vibrating in many different directions. The result is an unpolarized light beam, represented in Figure 38.29a. The direction of wave propagation in this figure is perpendicular to the page. The arrows show a few possible directions of the electric field vectors for the individual waves making up the resultant beam. At any given point and at some instant of time, all these individual electric field vectors add to give one re-sultant electric field vector.
As noted in Section 34.2, a wave is said to be linearly polarizedif the resultant electric field Evibrates in the same direction at all times at a particular point, as shown in Figure 38.29b. (Sometimes, such a wave is described as plane-polarized, or simply polarized.) The plane formed by Eand the direction of propagation is called the plane
m"1, 2, 3, $ $ $ sodium chloride (NaCl). The blue spheres represent Cl'ions, and the red spheres
represent Na,ions. The length of the cube
edge is a"0.562 737 nm.
▲
PITFALL PREVENTION
38.4
Different Angles
Notice in Figure 38.27 that the
angle ! is measured from the
reflecting surface, rather than
from the normal, as in the case of
the law of reflection in Chapter
35. With slits and diffraction gratings, we also measured the
angle ! from the normal to the
array of slits. Because of historical tradition, the angle is measured differently in Bragg diffraction, so interpret Equation 38.13 with care.
of polarization of the wave. If the wave in Figure 38.28 represents the resultant of all individual waves, the plane of polarization is the xyplane.
It is possible to obtain a linearly polarized beam from an unpolarized beam by removing all waves from the beam except those whose electric field vectors oscillate in a single plane. We now discuss four processes for producing polarized light from unpo-larized light.
Polarization by Selective Absorption
The most common technique for producing polarized light is to use a material that transmits waves whose electric fields vibrate in a plane parallel to a certain direction and that absorbs waves whose electric fields vibrate in all other directions.
In 1938, E. H. Land (1909–1991) discovered a material, which he called polaroid, that polarizes light through selective absorption by oriented molecules. This material is fabricated in thin sheets of long-chain hydrocarbons. The sheets are stretched during manufacture so that the long-chain molecules align. After a sheet is dipped into a solu-tion containing iodine, the molecules become good electrical conductors. However, conduction takes place primarily along the hydrocarbon chains because electrons can move easily only along the chains. As a result, the molecules readily absorb light whose electric field vector is parallel to their length and allow light through whose electric field vector is perpendicular to their length.
It is common to refer to the direction perpendicular to the molecular chains as the transmission axis. In an ideal polarizer, all light with Eparallel to the transmis-sion axis is transmitted, and all light with Eperpendicular to the transmission axis is absorbed.
Figure 38.30 represents an unpolarized light beam incident on a first polarizing sheet, called the polarizer. Because the transmission axis is oriented vertically in thefigure, the light transmitted through this sheet is polarized vertically. A second polarizing sheet, called the analyzer, intercepts the beam. In Figure 38.30, the analyzer transmission axis is set at an angle ! to the polarizer axis. We call the electric field vector of the first transmitted beam E0. The component of E0 perpen-dicular to the analyzer axis is completely absorbed. The component of E0parallel to the analyzer axis, which is allowed through by the analyzer, is E0 cos!. Because the intensity of the transmitted beam varies as the square of its magnitude, we conclude that the intensity of the (polarized) beam transmitted through the analyzer varies as of an unpolarized light beam viewed along the direction of propagation (perpendicular to the page). The transverse electric field can vibrate in any direction in the plane of the page with equal probability. (b) A linearly polarized light beam with the electric field vibrating in the vertical direction.
Active Figure 38.30 Two polarizing sheets whose transmission axes make an angle !
where Imax is the intensity of the polarized beam incident on the analyzer. This expression, known as Malus’s law,2 applies to any two polarizing materials whose transmission axes are at an angle !to each other. From this expression, we see that the intensity of the transmitted beam is maximum when the transmission axes are parallel (! "0 or 180°) and that it is zero (complete absorption by the analyzer) when the transmission axes are perpendicular to each other. This variation in transmitted intensity through a pair of polarizing sheets is illustrated in Figure 38.31.
Polarization by Reflection
When an unpolarized light beam is reflected from a surface, the reflected light may be completely polarized, partially polarized, or unpolarized, depending on the angle of incidence. If the angle of incidence is 0°, the reflected beam is unpolarized. For other angles of incidence, the reflected light is polarized to some extent, and for one partic-ular angle of incidence, the reflected light is completely polarized. Let us now investi-gate reflection at that special angle.
Suppose that an unpolarized light beam is incident on a surface, as in Figure 38.32a. Each individual electric field vector can be resolved into two components: one parallel to the surface (and perpendicular to the page in Fig. 38.32, represented by the dots), and the other (represented by the brown arrows) perpendicular both to the first component and to the direction of propagation. Thus, the polarization of the entire beam can be described by two electric field components in these directions. It is found that the parallel component reflects more strongly than the perpendicular compo-nent, and this results in a partially polarized reflected beam. Furthermore, the refracted beam is also partially polarized.
Now suppose that the angle of incidence !1is varied until the angle between the reflected and refracted beams is 90°, as in Figure 38.32b. At this particular angle of incidence, the reflected beam is completely polarized (with its electric field vector parallel to the surface), and the refracted beam is still only partially polarized. The angle of incidence at which this polarization occurs is called the polarizing angle!p.
S E C T I O N 3 8 . 6 • Polarizaion of Light Waves 1227
2 Named after its discoverer, E. L. Malus (1775–1812). Malus discovered that reflected light was polarized by viewing it through a calcite (CaCO3) crystal.
Figure 38.31 The intensity of light transmitted through two polarizers depends on the relative orientation of their transmission axes. (a) The transmitted light has maximum intensity when the transmission axes are aligned with each other. (b) The transmitted light has lesser intensity when the transmission axes are at an angle of 451with each other. (c) The transmitted light intensity is a minimum when the transmission axes are perpendicular to each other.
Henry Leap and Jim Lehman
We can obtain an expression relating the polarizing angle to the index of refrac-tion of the reflecting substance by using Figure 38.32b. From this figure, we see that !p ,90°,!2"180°; thus !2"90°'!p. Using Snell’s law of refraction (Eq. 35.8) and taking n1"1.00 for air and n2"n, we have
Because sin!2"sin(90°'!p)"cos!p, we can write this expression for n as n"sin!p/cos!p, which means that
(38.15)
This expression is called Brewster’s law, and the polarizing angle !p is sometimes called Brewster’s angle,after its discoverer, David Brewster (1781–1868). Because n varies with wavelength for a given substance, Brewster’s angle is also a function of wavelength.
We can understand polarization by reflection by imagining that the electric field in the incident light sets electrons at the surface of the material in Figure 38.32b into oscillation. The component directions of oscillation are (1) parallel to the arrows shown on the refracted beam of light and (2) perpendicular to the page. The oscillat-ing electrons act as antennas radiatoscillat-ing light with a polarization parallel to the direc-tion of oscilladirec-tion. For the oscilladirec-tions in direcdirec-tion (1), there is no radiadirec-tion in the perpendicular direction, which is along the reflected ray (see the ! "90°direction in Figure 34.11). For oscillations in direction (2), the electrons radiate light with a polarization perpendicular to the page (the ! "0 direction in Figure 34.11). Thus, the light reflected from the surface at this angle is completely polarized parallel to the surface.
Polarization by reflection is a common phenomenon. Sunlight reflected from water, glass, and snow is partially polarized. If the surface is horizontal, the electric
n"tan!p n" sin!1
sin!2 " sin!p sin!2 1
θ
Refracted beam
Refracted beam
(a) (b)
n1 Incident
beam Reflected
beam
n2 90°
Incident
beam Reflected
beam
n1
n2 1
θ
2
θ
p
θ θp
2
θ
Figure 38.32 (a) When unpolarized light is incident on a reflecting surface, the reflected and refracted beams are partially polarized. (b) The reflected beam is completely polarized when the angle of incidence equals the polarizing angle !p, which satisfies the equation n"tan!p. At this incident angle, the reflected and refracted rays are perpendicular to each other.
field vector of the reflected light has a strong horizontal component. Sunglasses made of polarizing material reduce the glare of reflected light. The transmission axes of the lenses are oriented vertically so that they absorb the strong horizontal component of the reflected light. If you rotate sunglasses through 90 degrees, they are not as effective at blocking the glare from shiny horizontal surfaces.
Polarization by Double Refraction
Solids can be classified on the basis of internal structure. Those in which the atoms are arranged in a specific order are called crystalline;the NaCl structure of Figure 38.26 is just one example of a crystalline solid. Those solids in which the atoms are distributed randomly are called amorphous. When light travels through an amorphous material, such as glass, it travels with a speed that is the same in all directions. That is, glass has a single index of refraction. In certain crystalline materials, however, such as calcite and quartz, the speed of light is not the same in all directions. Such materials are characterized by two indices of refraction. Hence, they are often referred to as double-refractingor birefringentmaterials.
Upon entering a calcite crystal, unpolarized light splits into two plane-polarized rays that travel with different velocities, corresponding to two angles of refraction, as shown in Figure 38.33. The two rays are polarized in two mutually perpendicular directions, as indicated by the dots and arrows. One ray, called the ordinary (O) ray, is characterized by an index of refraction nO that is the same in all directions. This means that if one could place a point source of light inside the crystal, as in Figure 38.34, the ordinary waves would spread out from the source as spheres.
The second plane-polarized ray, called the extraordinary (E) ray, travels with different speeds in different directions and hence is characterized by an index of refraction nEthat varies with the direction of propagation. Consider again the point source within a birefringent material, as in Figure 38.34. The source sends out an extraordinary wave having wave fronts that are elliptical in cross section. Note from Figure 38.34 that there is one direction, called the optic axis,along which the ordi-nary and extraordiordi-nary rays have the same speed, corresponding to the direction for which nO"nE. The difference in speed for the two rays is a maximum in the direc-tion perpendicular to the optic axis. For example, in calcite, nO"1.658 at a wavelength of 589.3 nm, and nE varies from 1.658 along the optic axis to 1.486 perpendicular to the optic axis. Values for nO and nE for various double-refracting crystals are given in Table 38.1.
S E C T I O N 3 8 . 6 • Polarizaion of Light Waves 1229
Unpolarized light
E ray
O ray Calcite
Figure 38.33 Unpolarized light incident on a calcite crystal splits into an ordinary (O) ray and an extraordinary (E) ray. These two rays are polarized in mutually
perpendicular directions. (Drawing not to scale.)
E
O
S Optic axis