ISSN: 2528-617X
IMPROVING RELIABILITY ON BKS PRODUCTION FACILLITIES
THROUGH NEW MAINTENANCE STRATEGY AND DESIGNING
PERFORMANCE MANAGEMENT SYSTEM IN CENTRAL
MAINTENANCE TEAM AT O&M SUB-DIVISION PT XYZ
Daniel Djarot Subyantoro1, Gatot Yudoko1
1School of Business Management, Institute of Technology Bandung, Indonesia E-mail: [email protected]
Abstract
BKS Productions is an operation unit in Sumatra Oil of PT XYZ, which operation area located in Riau province. The crude oil production unit is more than 25,000 barrels of oil per day (BOPD) in 2015 and produced as much as 1 - 1.3 million barrels water per day (BWPD). The produced water utilized for crude oil secondary production process which known as Enhanced Oil Recovery (EOR). To maintain crude oil production and also compliance to GOI regulations on environmental, the high reliability and availability on faclities is important, The CM team challenges from external are: the fall of global oil prices which reached the lowest point at 29 USD/barrel in February 2016, the natural declining in crude oil production, GOI regulations on environment stewardship and cost recovery, the production sharing contract continuity, the autonomous regions law and others. From internal are: corporate optimization programs, reduction of operating and capital budgets, the efficiency programs in all aspect of operations including in work force of both PT XYZ and business partner. Based on the research methodology that conducted and some focused group discussion resulted the •down scoping•or •cascading•strategy as central maintenance teams strategy. This strategy is used to establish milestone, time line for execution, key performance indicator (KPI) and performance dashboard based on the balanced scorecard and strategy execution. The design of performance management system could accommodate result of root cause analysis that affected to the reliability and availability performance of critical equipment. Those are: maintenance program, Preventive Maintenance or inspection programs, the equipment performance data accuration, spare part availability, employee skill improvement.
Keywords: reliability, availability, critical equipment, the balanced scorecard, KPI, dashboard
INTRODUCTION
Background
BKS Production is an operation unit in Sumatra Oil - Operation and Maintenance (O&M) North that located in Riau province at the center of Rock Block and produced more than 25,000 BOPD of crude oil in 2015 and 1 •1.3 millions barrel water per day (BWPD) that were injected, disposed and discharged to the jungle. The excess of production water must be handled carefully in order to comply with Goverment of Indonesia (GOI) regulation on environmental.
system, electrical and control system, safety system, produced water system, air utility system. The Equipment Reliability and Intergrity Procedures (ERIP) stated that the minimum required level of the equipment reliability is 97.5%, meanwhile the minimum required equipment availability is 95% refer to Data Input Output Norm (DION) for maintenance management system,
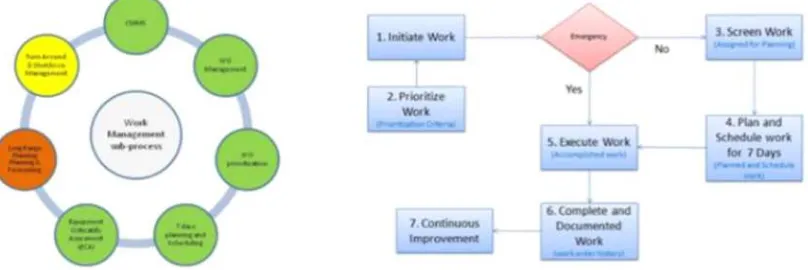
As a PTYZ[sbase business, maintenance activities use Equipment Reliability and Integrity Process (ERIP) as a guidance to acheive the goal for sustaining reliability. The figure 1 shows 7 sub-process in work management that appear in ERIP stage 1, 2, and 3 that being a reference procedures and main focused for maintenance activities. those are: Computerized Maintenance Management System (CMMS), Work Order (WO) management, WO prioritization, 7 days planning & scheduling, Equipment Criticallity Assesment (ECA), Long Range Planning Scheduling (LRPS) & Forecasting, Turn around & shutdown management. The work management process. The implementation of work management process and other related procedures that support the process in maintenance team could be shown below:
Figure 1 ERIPsWork Management and Prioritization Flow Process
Business Situation
The current global environment in oil and gas indutry had directly influence PT XYZ as one the world top 5 in oil and gas industry. The PT XYZ Indonesia Business Unit (IBU) as a subsidiary company in Indonesia changes its operational strategy by restructuring the organization, asset rationalization and cost optimization. Several condition and effort that will drive the strategy: improvement on business processes, PSC Contract expiration, minimize the decline rate and manage the lifting cost, local community issues, asset/equipment reliability and availibility, strong law enforcement in environmental stewardships.
Bussiness Issues
ISSN: 2528-617X
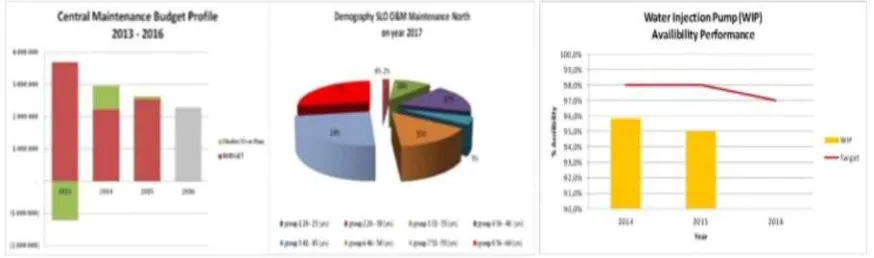
current situation, to align with business unit priorities : |Safety, Compliance, Production .Qbif^_fifqv} and deliver high reliability, availability and efficiencies as a world class company through PT XYZ operational excelence, the availability performance of Water Injection Pumps (WIPs) as critical equipment in BKS Production that still under target.
Figure 2 CM team budget profile, employee demography and WIP availability
Problem Formulation
1. How to establish New maintenance strategy in current situation that align with corporate and business strategy to sustain and improve reliability and availibility of equipment. 2. How to develop a performance management system to achieve business goal, deliver
safe incident free operation, comply to all regulation and provide high reliability asset/equipment in BKS Production facilities/area
BUSINESS CASE EXPLORATION
The Strategic Management Process
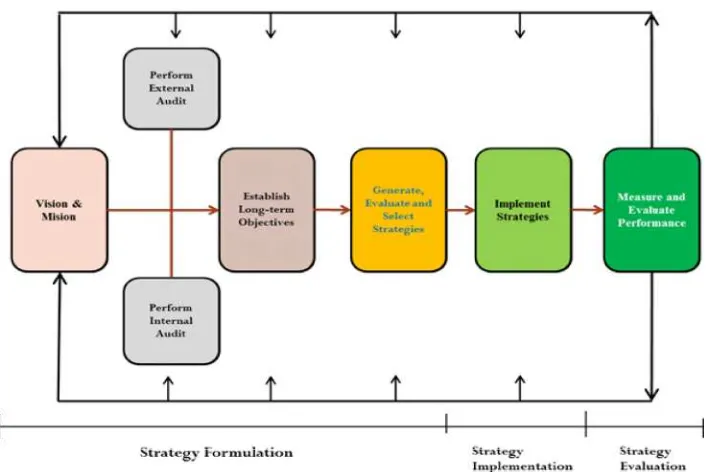
A Strategic Management Process framework as shown in Figure 3 was used to explore and indentify the business issues, conduct evaluation or analysis, determine a recommendation and conclude a problem solution of the business. The figure described strategic management process framework that shown steps to align the issues tocompanysvision and mission then to find the solution by formulizing the strategy and develop an execution strategy. Fred R. David inStrategic management concept and casesstated that
•Ttrategic management can be defined as the art and science of formulating, implementing, and evaluating cross-functional decisions that enable an organization to achieve its objectives. As this definition implies, strategic management focuses on integrating management, marketing, finance/accounting, production/operations, research
Figure 3.3. Comprehensive ofof the Strategic Management Process Sources: Fred P.P. David, 2011-p15
External Environment Analysis
The PESTEL analysis is choosen to identify and examine variations of external environment analysis that affected PT XYZ and its business entity in Indonesia especially in Sumatra Oil Operations. Those aspects are:
Political factors
Political factors basically are how the government interfering in the economy, especially in oil and gas industry, those factors is:
1.
1. Production Sharing Contract (PSC) contract, the PSC regulated in the law of the 2.
2. Republic of Indonesia for oil and gas No. 22 of 2001 section IV that regulating the upstream business activities.
3.
3. Regional Autonomy, the alignment between central and local government in term of the application of GOI regulations. PT XYZ operation in the Sumatra operations are in 5 districts in Riau province.
Economic Factors
The economic growth, interest rates, exchange rates and the inflation rate have greatly affect how businesses operate and make decisions, such as:
1.
ISSN: 2528-617X
average oil 830 Thousand Barrel Oil per Day (MBOPD); Lifting average gas 1155 Mils Barrel Oil Equivalent per Day (MBOEPD).
2. Global Oil Price,. In the last 2 years the crude oil had been slide from the price level of > 110 USD to <30 USD.
Social and Demographic factors
The demographic and social data of Riau province conditions as published on the book of Statistik Daerah Provinsi Riau 2015 (katalog BPS, 1101002,14, 2015)shows that in 2014 the data are as follows:productivity ages 65.8%, rate of employment 63.3%, the level open unemployment 6.6%, Human Development Index (HDI) 70.33.
Technological factors
Oil and gas industry is a technology-intensive and high capital industry, so that only the company with strong financial capability could enter this industry. PT XYZ had been used a secondary process is called Enhanced Oil Recovery (EOR) technologies in exploration and production of oil and gas to increase the production is known as
Environmental factors
The strict environmental laws and regulation had drive commitments for oil and gas ccompany to comply with the regulations. There are some risks in exploration and production that could affected ecological and environmental changes, such as: Oil Spill, Emission, Efluent water discharge.
Legal factors
In the oil and gas industry in Indonesia there are: Law (UU), Government Regulation (PP), President Decisions (kepres), Minister Regulation (Permen), Minister Decisions (Kepmen) and governance guidelines employment and general guidelines (PTK), which affected the pattern of operations strategy in the field due to more variances of stakeholders where each of them require different engangement strategies.
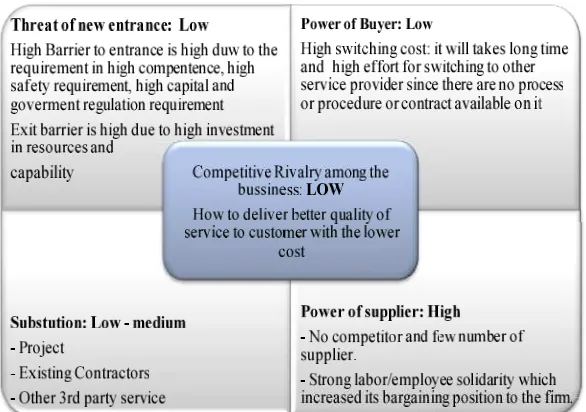
Industy Analysis
Figure 4.4.Qortersfive forces model ofof Sumatra Oil - O&M Maintenance North
The attractiveness in this context refers to the overall industry profitability, meanwhile an "unattractive" industry is one in which the combination of these five forces acts to drive down overall profitability.
Internal Factor Analysis
The competitiveness of PT XYZ resources determine through it resources, capability and competences analysis as follow:
1.
1. Resources
As a world class company PT XYZ had a complete set of tangible and intangible resources that required for its operations: high skill employee, advance technology, reputation and a culture in place.
2.
2. Capability
|@ B^m^_fifqv fp qeb `^m^`fqv clo ^ pbq lc obplro`bp ql mboclojb ^ q^ph lo ^k ^`qfsfqv fk ^k fkqbdo^qfsb j^kkbo}(Hit-Ireland-Hoskinsson, 2011: p1616).). PT XYZ had been exist in Indonesia for more than 90 years, it proved the capability to survive on its bussiness, the organization capabilitys strength through Pperation Fxcellence Nanagement Tystem (OEMS) could adapt and deploy the resources to face the organization challenge, such as: low oil price environment, Optimization program and local commonity issues. 3.
3. Competencies
ISSN: 2528-617X
Strategic Factor Analysis
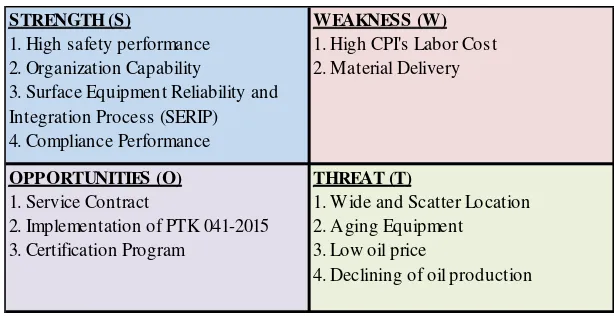
The next step is to summarize the identified factors using the Strategic factor analysis. The VRIO (Valuable, Rare, costly to Imititate, Organize to capture value) analysis used to access the importance of each factor that may consider strength or weakness. The External factors, which generate accepted category of opportunity and threat.
Table 1 Strength Weakness Opportunity Threat (SWOT) Matrix
The Internal and External factors that influence CM team was developed based on the result of survey that conducted on September 2015 and a Focus Group Disccusion (FGD) that conducted during CM team workshop on December 17, 2015 attended by Team Manager, Team Leader, Group leaders and Technicians. Summary Factor Analysis (SFA) combined the internal and external factor had been condensed by decision maker are being a SWOT (Strength, Weakness, Opportunity and Threat) are as seen on the table below:
Value Chain Analysis
The value chain analysis allows the firm to understand the parts of its operations that create value and those that do not, because the firm objective is profit which could happened when the value created is greater than the costs incurred to create that value. There are 2 (two) main activities in DNs value chain analysis<
1. Primary Activities:focused into three majorsactivities, those are: Operation, services: Inbound Logistics
2. Support Activities, focus on people development and procurement Support activities, such as: Firm Infrastructure, Human Resource, Technology Development, Supply Chain Management (procurements)
Root Cause Problem Structure
To elaborate and identified the root cause of the problem and to prioritize the action that should be adress first, the fishbone diagram and current situation analysis as a tool.
STRENGTH (S)
1. High safety performance 2. Organization Capability
3. Surface Equipment Reliability and Integration Process (SERIP) 4. Compliance Performance
WEAKNESS (W) 1. High CPI's Labor Cost 2. Material Delivery
OPPORTUNITIES (O) 1. Service Contract
2. Implementation of PTK 041-2015 3. Certification Program
THREAT (T)
1. Wide and Scatter Location 2. Aging Equipment
3. Low oil price
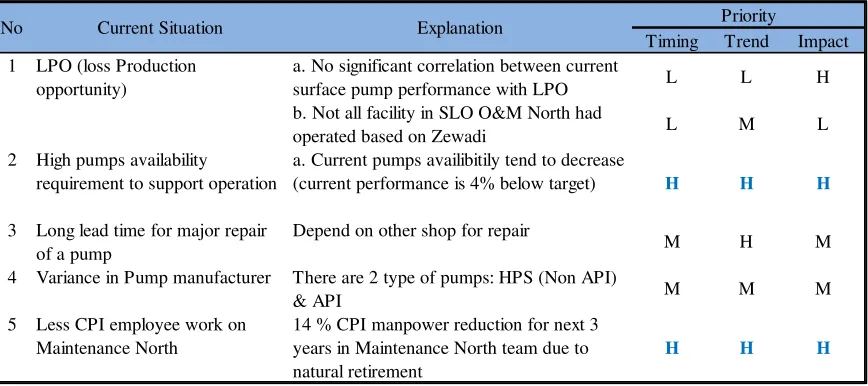
Situation Analysis
The table 2 shows current analysis to prioritize the problem based on the time, trend and impact so that the solution for the current condition could solve the problem in timely manner.
Table 2 Current situation analysis in CM team
Fishbone Diagram
The diagram is to identify controlable problems that affected reliability and availibility performance are: maintenance program, PM or inspection program, performance data accuration (for equipment), spare part availibility, employee skill improvement.
BUSINESS SOLUTION
Functional Strategy
The functional level strategy approached in functional area which is to maximize resource productivity by developing and nurturing a distinctive competence to provide a company or business unit with a competitive advantage. The orientation of a functional strategy is driven by its parent business units strategy/ Uhe CM team had selected Down Scoping or Cascading (Kaplan, Norton) as a functional level strategy to align with the corporate strategy, business unit strategy, vision and mission for the current state. The main intention of this strategy is to:optimize operational cost, increase productivity and emphasis in strategic control. Following are some perspectives of the selected functional strategy that fit in CM team.
1. Financial: maximize the financial value of a firm, those are: Operational Cost Management to achieve sustainably Profitable Operations; Selective investment on aging assets for maximizing profit
2. Maintenance Operations: determines how and where a service is to be delivered, should also deal with the optimum level of technology the firm should use in its
Timing Trend Impact
a. No significant correlation between current
surface pump performance with LPO L L H
b. Not all facility in SLO O&M North had
operated based on Zewadi L M L
2 High pumps availability
requirement to support operation
a. Current pumps availibitily tend to decrease
(current performance is 4% below target) H H H
3 Long lead time for major repair of a pump
Depend on other shop for repair
M H M
4 Variance in Pump manufacturer There are 2 type of pumps: HPS (Non API)
& API M M M
5 Less CPI employee work on Maintenance North
IS
ISSN: 2528-617X
operations processes, those are: Deliver high quality ofof service with safe incident free operation (SIFO) and comply with GOI and CVX regulations through operational excellences; Achieve optimum reliability ofof asset through excellent implementation ofof ERIP; Strengthen organizational capability; Enhance applicable technology toto optimize operation.
3.
3. Human Capital:the related strategies are: Strengthen organizational capability; Focus on core competences, looking for opportunity toto outsource and optimize total number of labor
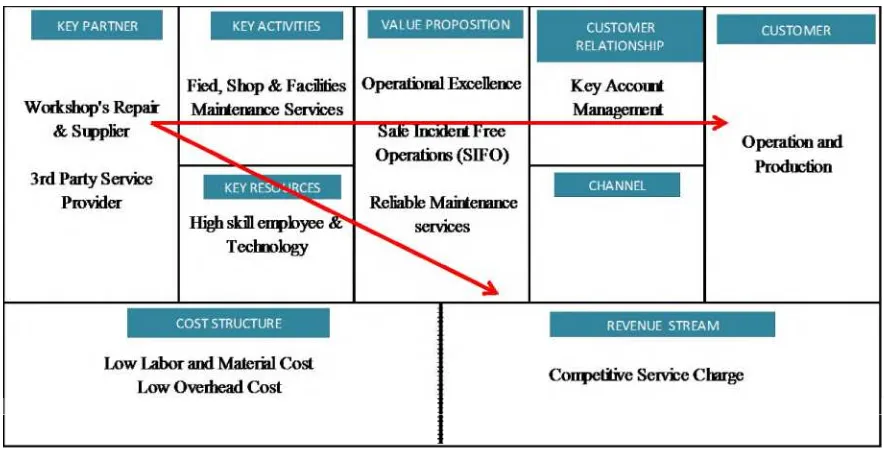
Business Model Development
Osterwalder & Pigneur inin the book ofof Business Model Generation, (2010 : 14) defined that
•A business model describes the rationale of how an organization creates, delivers, and
captures value/• The nine building block ofof a business model template has been developed by
by Osterwalder that called asas a business model canvas have four main areas of a business: customers, offer, infrastructure, and financial viability. The figure 5 shows a new business model ofof CMCM team strategy that based onon partnership and resources toto deliver high quality of
of services with competitive service cost toto customer through operational excellences.
Figure 5.5. Sumatra Oil O&M&M - CMCM team business model
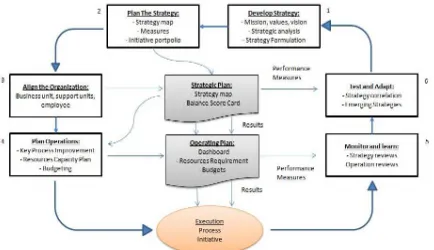
Strategic Plan
Refer toto Kaplan and Norton inin bookthe Execution Premium: linking strategy toto operations for competitive advantage (2008: 3)3) presented a summary after a survey inin 1996 about the state ofof strategy execution.
understood the`ljm^kv•pstrategy. The employee who do not understand the strategy can not linked the daily activities to its successfullbub`rqflk-}
The focused of stategic plan is to develop strategy mapping and the Balanced Scorecard (BSC) for generating an operating plan which consist of: dashboard, resource requirement, budget etc. The performance of strategic and operating plan implementation shall be measured to monitor the effectiveness and for future evaluation or review. The figure 6 is a management system process that link the strategy to operation:
Figure 6. The Management System: linking strategy to operations Sources: Kaplan & Norton (2008)
Strategy Mapping
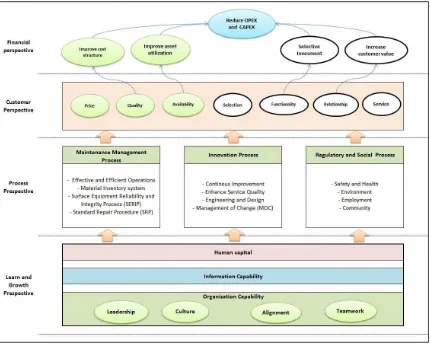
The figure 7 below is CM team strategy map that cover four perspective used to develop the BSC, the strategy map is a value creation process that describes a series of cause and effect linkages among objectives and perspetives.
ISSN: 2528-617X
Figure 7. Sumatra Oil O&M - CM team Strategy Map
The Balanced Scorecard (BSC)
There are two main key process improvement area that become a Balanced Scorecard themes as shown on the above strategy maps, those are: Optimize Operation Cost and Increase Productivity,which is align with CM missions. The Combination of both themes, the BSC objectives will summary as follow:
1. Financial perspetive: reduce operational expenses through efficiency (cost management), simplify process, effective manpower utilization; reduce overhead cost of maintenance operation.
2. Customer perspective: improve service quality by reducing repeated work, unplan downtime, low service charge and asset rationalization; deliver high reliability and availibility and minimize unplan work.
3. Internal Process: operational excellence by Safe and Incident Free Operation (SIFO), excellent compliance to GOI regulation and PTYZ[sbusiness process and procedure; deliver effective and efficient maintenance operation through ERIP implementation. 4. Learning & Growth: optimizing internal company resources by enhancing knowledge
Tabel 3 Balanced scorecard of Optimize OperationDoststheme
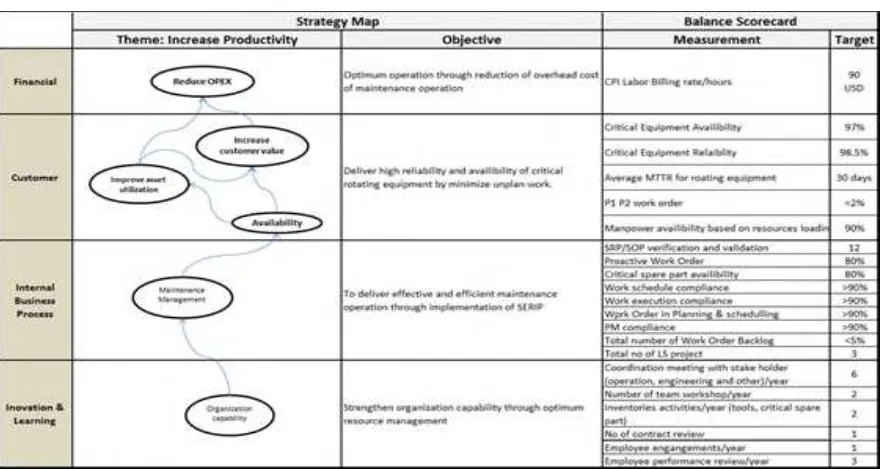
Table 4 Balanced scorecard of increase productivity theme
IMPLEMENTATION
Milestone
ISSN: 2528-617X
The figure 9 present a time line for execution was developed to ensure all activities had been assigned responsible persons and the target for completion are clear.
Figure 8. CM team milestone and time line for execution for 2016
Key Performance Indicator (KPI)
Performance Metrics
All milestone, timeline activities and variable performance as stated in the Balanced Scorecard. Table 5 shows important metrics that supported CM team to achieve the goal:
Table 6 KPI for Operation and Organization Capability (OC) Metric
The table 5 & 6 above shows main parameter ofDNs team KPI that ormulated to align to strategy and objective of the BCS, the set of metrics, objective and target. There are 4 perspectives, those are: Operational Excellences (OE) Metrics, Financial metrics, Operation metrics and Organization Capability.
Performance Dashboard
The dashboard had been developed to give high level information on the current performance status and gaps of the CM team and an indicator for the achievement in 2016. The figure 9 shows lagging and leading dashboard of CM team performance as 2 main indicators of performance:
1. Lagging Indicator consist of following indicators:
a) a Safety performance that support Safe and Incident Free Operations (SIFO): b) Fatality, Day Away of Work (DAFW), Total Recordable Incident (TRI) and c) Motor Vehicle Crash (MVC)
d) Total number of oil spill incident e) IBU compliance
f) WIP availibility and reliability g) OEB
ISSN: 2528-617X
the leading indicators chart are: Compliance Performance, Safety Performance, Financial performance, Organization Capability, Work Management Performance
Figure 9. Lagging and Leading Dasboard of CM Team
REFERENCES
Barney, J. B., 1991, Firm Resources and Sustained Competitive Advantage, Journal of Management Vol. 17 No.1: 99•120.
Biro Pusat Statistik Provinsi Riau, 2015, Katalog BPS: 1101002.14: Statistik Daerah Provinsi Riau 2015, BPS Riau
PT XYZ ASSBU_SERI_team, 2008, Equiment Reliability and Integrity DION: Digital Input Output Norms, Revisi 04
David, F.R, 2011, Strategic Management: Concepts and Cases (13th ed.), New Jersey, Person Education.
Ireland, R.D., Hoskisson, R.E,. & Hit, M.A, 2013, The Management of Strategy: Concept and Cases( 10th International Ed.), Canada, South-Western, Cangage Learning.
Kaplan, S.R., & Norton, P.D., 1996, The Balaced Scorecard: Translating Strategy Into Action, Boston, Havard Business School Press.
Kaplan, S.R., & Norton, P.D., 2008, The Execution Premium: Linking Strategy to Operations for Competitive Advantage, Boston, Havard Business School Publishing Co.
Kementerian Keuangan Republik Indonesia, 2015, Keterangan Press: Anggaran Pendapatan dan Belanja Negara Tahun 2016, Direktorat Jendral Anggaran, Jakarta
Osterwalder, A & Pigneur, Y., 2010, Business Model Generation: A Handbook for Visioneries, Game Changers, and Challengers, New Jersey, Jhon Wiley & Son, Inc.
Presiden Republik Indonesia, 1999, Peraturan Pemerintah Nomor 41 tahun 1999 tentang Pengendalian Pencemaran Udara, Menteri Negara Sekretariat Negara Republik Indonesia, Jakarta
Undang Undang Negara Republik Indonesia,Nomor 22 tahun 2001 tentang Minyak dan Gas Bumi