PROSIDING
Volume 2
(Material, Struktur & Konstruksi, Transportasi)
Meningkatkan Daya Saing Industri Konstruksi Dalam Persaingan di Tingkat Global Menuju Pembangunan
Infrastruktur Berkelanjutan
Editor:
Anissa Noor Tajudin, S.T., M.Sc.
Arif Sandjaya, S.T., M.T.
Jurusan Teknik Sipil Fakultas Teknik
Universitas Tarumanagara
PROSIDING
Meningkatkan Daya Saing Industri Konstruksi Dalam Persaingan di Tingkat Global Menuju Pembangunan Infrastruktur Berkelanjutan
Volume 2
ISBN: 978-602-60662-3-7
Editor:
Anissa Noor Tajudin, S.T., M.Sc.
Arif Sandjaya, S.T., M.T.
Desain Sampul:
Anastasia Andrea Gunawan, S.Ds.
Penerbit
Jurusan Teknik Sipil Fakultas Teknik Universitas Tarumanagara Jakarta
Redaksi
Jl. Let. Jend. S. Parman No. 1 Jakarta Barat
Telp: 021-5672548 ext. 331 Email: [email protected]
Cetakan pertama, Oktober 2017
Hak cipta dilindungi Undang-undang
Dilarang memperbanyak karya tulis ini dalam bentuk dan dengan cara apapun tanpa memiliki izin
DAFTAR ISI
HALAMAN JUDUL ... i
KATA PENGANTAR ... iii
SAMBUTAN KETUA PANITIA KoNTekS 11 ... v
SAMBUTAN KETUA PROGRAM STUDI TEKNIK SIPIL FT UAJY ... vii
SAMBUTAN REKTOR UNIVERSITAS TARUMANAGARA ... ix
DAFTAR ISI ... xi
KELOMPOK PEMINATAN MATERIAL
MEMPERKIRAKAN MUTU BETON MENGGUNAKAN CONCRETE HAMMER TEST, ULTRASONIC PULSE VELOCITY TEST DAN CORE DRILL TEST
MTR-1
Widodo Kushartomodan Priscilla Karla
ANALISIS KARAKTERISTIK BLOK BAHAN PASANGAN DINDING YANG MEMAKAI BAHAN BEKAS GARUKAN ASPAL BETON DENGAN ASPAL SISA SEBAGAI PEREKAT
MTR-7
I Nyoman Arya Thanaya, I Gusti Raka Puranto dan Kadek Windy Tiarnanda Arissa
PERHITUNGAN DENSITAS ASPAL DENGAN MENGGUNAKAN KONVERSI AASHTO T 166 KE AASHTO T 275
MTR-17
Retno Utami dan Aceng Subagdja
KARAKTERISTIK SAMPAH ORGANIK DAN TANAH MEDITERAN MENJADI SEMEN ORGANIK
MTR-23
Muhammad Syarif, Victor Sampebulu, Nasruddin Junus dan Hartawan Madeali
KINERJA LAPIS PENGIKAT MENGGUNAKAN ASPAL PEN 40/50 TANPA POLIMER (BAGIAN DARI STUDI PERPETUAL PAVEMENT DI INDONESIA)
MTR-31
Ranna Kurnia
KAJIAN PERBANDINGAN KARAKTERISTIK CAMPURAN AC-BC MENGGUNAKAN AGREGAT BATU PECAH SUKADANA, LAMPUNG DAN CLERENG, DIY
MTR-41
Miftahul Fauziah dan Nora Anggraini
REKAYASA SEMEN KOMPOSIT LIMBAH SERUTAN BAMBU BERTULANGAN BAMBU UNTUK BAHAN PERKERASAN JALAN
MTR-49
I Gusti Lanang Bagus Eratodi, Putu Budi Arnaya dan Putu Ariawan
PENGARUH PENGGUNAAN RESIN EPOXY PADA CAMPURAN BETON POLIMER YANG MENGGUNAKAN SERBUK GERGAJI KAYU
MTR-57
Reni O. Tarru, Yusri limbongallo, Yulius Pakiding, Johan dan Yandri
PENGARUH KADAR FLY ASH TERHADAP KINERJA BETON HVFA MTR-65 Angelina Eva Lianasari dan Choirul Prahastama Aji
xiv
SISTEM IDENTIFIKASI STRUKTUR DENGAN MENGGUNAKAN METODE FREQUENCY DOMAIN DECOMPOSITION-NATURAL EXCITATION TECHNIQUE
SK-111
Richard Frans dan Yoyong Arfiadi
UJI PEMBEBANAN PADA PELAT REACTIVE POWDER CONCRETE SK-121 Daniel Christianto, Widodo Kushartomo, Fanywati Itang dan Cynthia Hindrawan
KELOMPOK PEMINATAN TRANSPORTASI
THE INFLUENCING FACTORS OF ROUTE CHOICE BEHAVIOUR TRP-1 Dewa Made Priyantha Wedagama
SATISFACTION LEVEL OF TARUMANAGARA UNIVERSITY STUDENTS ON PEDESTRIAN FACILITIES SURROUNDING CAMPUS (ON S. PARMAN ROAD)
TRP-7
Leksmono Suryo Putranto and Benedictus Yosia
PENGARUH KENDARAAN PARKIR TERHADAP KINERJA PERSIMPANGAN TANPA LAMPU LALU LINTAS
TRP-13
Abdul Kudus Zaini
ANALISIS BIAYA KEMACETAN LALU LINTAS DI KAWASAN PARIWISATA KUTA, PROVINSI BALI
TRP-19
Putu Alit Suthanaya, Jaya Wikrama dan Syebastian Petrus
PERLUNYA KEBIJAKAN PARKIR SEBAGAI PENGENDALIAN LALULINTAS DI KAMPUS UNIVERSITAS MUHAMMADIYAH SURAKARTA
TRP-27
Telly Rosdiyani, Nurul Hidayati dan Gotot Slamet M
KARAKTERISTIK PEMILIHAN MODA SEPEDA MOTOR KELOMPOK MAHASISWA UNIVERSITAS ISLAM RIAU (Studi Kasus : Fakultas Teknik)
TRP-37
Muchammad Zaenal Muttaqin
EVALUASI DIMENSI SALURAN DRAINASE PERMUKAAN DI JALAN SETIABUDHI KOTA BANDUNG
TRP-45
Angga Marditama Sultan Sufanir
STUDI PEMAHAMAN MAHASISWA SEBAGAI PENGENDARA TERHADAP RAMBU LALU LINTAS DAN MARKA JALAN DI KOTA PADANG
TRP-53
Titi Kurniati dan Eko Prima Indra
INDENTIFIKASI KONDISI JALAN PROPINSI DI PROPINSI RIAU TRP-63 Horas Saut Maringan Marpaung
ANALISIS PEMILIHAN MODA ANTARA JAKARTA LRT DENGAN KENDARAAN PRIBADI MENGGUNAKAN MODEL PEMILIHAN DISKRIT
TRP-73
Dwi Novi Wulansari dan Milla Dwi Astari
ANALISIS DAMPAK LALU LINTAS PADA KEGIATAN OPERASIONAL BUS AKDP DI JALAN ANDI MAPPANYUKI -RANTEPAO
TRP-81 Ermitha D Rombe, Harni E. Tarru, Yacob Bokko dan Dari Tangkearung
Konferensi Nasional Teknik Sipil 11 Universitas Tarumanagara, 26-27 Oktober 2017
THE INFLUENCING FACTORS OF ROUTE CHOICE BEHAVIOUR
Dewa Made Priyantha Wedagama1
1Jurusan Teknik Sipil, Universitas Udayana, Bukit Jimbaran, Badung, Bali Email: [email protected]
ABSTRACT
The route choice behaviour analysis is essentially required to assess the current and the need of further infrastructures. In addition, the analysis can be employed as a tool to divert the current traffic flows in the most effective path. In order to reduce traffic congestion in southern Bali, a toll road of Bali Mandara was constructed and operated connecting among three main locations of Denpasar, Nusa Dua and Ngurah Rai Airport. This study aimed to analyse the contributing factors of motorists to select a route using a structural equation model (SEM). Toll road of Bali Mandara in Bali was used as the case study area. A total of 400 motorists are interviewed on three separated locations in Benoa, Ngurah Rai Airport and in Nusa Dua respectively. Number of effective respondents included in the analysis however, were 381 (95%) motorists. SEM is developed to investigate the causal relationship among motorists’ characteristics, perceptions and the route selected. Motorists’
characteristics cover gender, household size and income and daily average of travel distance while, motorists’ perceptions consist variables of comfort and security. The model results indicated that perceptions are significantly found to contribute motorists’ decisions to do their trips via the toll road of Bali Mandara. The study found that when the measures of perceptions increase by one unit, measures of motorists to select toll road of Bali Mandara for their trips would increase by 0.25 unit.
Key words: route choice behaviour, structural equation model, toll road.
1. INTRODUCTION
Throughout the previous years, transportation engineers have been seeking after the expansive number of people to comprehend the individual conduct in route choice decision. The total conduct relies on upon the individual choices.
Every last individual choice eventually makes an effect on the traffic flows. In this manner, each individual trip is within the center of all traffic forecasting and assignment. By chance, there is no any acknowledged single model which is equipped for anticipating the motorists’ behaviour (Pal, 2004).
The rudimentary traffic route choice method is a model for the traveler on route selection. The model manages the ideal of motorists’ route choices while at same time keeping the other variables including origin, destination, departure times, modes of transport and trip purposes fixed. This analysis focuses on the manner of thinking of the motorists. A motorist has to select a route based on several route alternatives depending on his/her attributes and traffic system attributes (Pal, 2004).
The individual characteristics of motorists are important in the route choice analysis, for instance low income motorists in comparison to those higher incomes more frequently used the main route and less regularly switched their routes. In addition, motorists who had high score on sensation seeking tend to change their routes more consistently (Albert, et.al, 2011). Meanwhile, the other significant variables to analyse route choice include congestion level, travel time and travel distance. (Prato, et.al, 2012). In summary, individual characteristics, trip purposes and route attributes played significantly to influence motorists’ route choices (Pal, 2004). Route choice behavior analysis is important as a significant tool in traffic assignment model. More specifically, this tool is employed to diver the existing traffic efficiently. In addition, it can be utilised to assess the usage of the current and the need of further infrastructures.
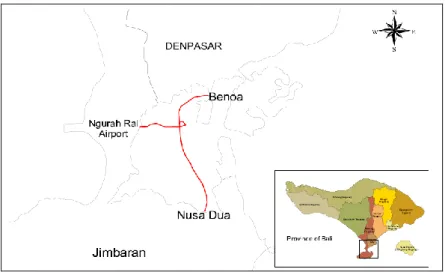
Meanwhile, in the southern of Bali particularly in tourism area covering Kuta, Jimbaran, Sanur and Nusa Dua, the roadways have been experiencing queue and delays. In order to alleviate this traffic congestion, a toll road of Bali Mandara have been built and operated since 2013. This toll road primarily connects among three main locations of Denpasar, Ngurah Rai Airport and Nusa Dua. In order to analyse the performance of this toll road, a route choice behaviour analysis will be able to provide some important information related to the reasons of motorists to use this infrastructure. This study therefore, aims to analyse motorists’ influencing factors of route choice behaviour using toll road of Bali Mandara as a case study area.
TRP-2
2. PRINCIPAL COMPONENT ANALYSIS AND STRUCTURAL EQUATION MODEL
A method of Principal Component Analysis (PCA) is used in this study to classify certain attributes of similar underlying values. PCA is able to put off multicollinearity among the attributes by means of segregating between uncorrelated and correlated linear combinations of covariates. Additionally, PCA is employed to justify that the particular linear combinations generating maximum variance (Hooper, et.al, 2008). In this study, PCA particularly is utilized to analyse the ordinal variable that is motorists’ perceptions which were coded on a 5-point Likert scale. The PCA is then followed with reliability analysis measured with a Cronbach’s Alpha. These PCA and reliability analysis are both performed with IBM SPSS version 20.
This study is to perform PCA in which rotated principal component loadings and reliability values more than 0.7 with 20 % or more explained variances (Hooper, et.al, 2008). The minimum accaeptable value of cronbach’s alpha coefficient is of 0.7 or greater (Kline in Fyhri and Backer-Grøndahl, 2012; Ma et.al in Hassan and Abdel-Aty, 2013). Meanwhile, an alpha value of 0.8 shows that the scales have high levels of internal consistency (Loo, et.al, 2015). In theory, a cronbach’s alpha is a coefficient of consistency quantifying the goodness of variables or items in evaluating a single and unidirectional latent constructs (Ma, et.al in Hassan and Abdel-Aty, 2013).
A Structure Equation Model (SEM) is subsequently used to identify the causal relationships among latent/hypothetical/unobserved and observed variables. The use of latent variables are to remove measurement errors so as to more logical coefficients are obtained. All coefficients in the SEM model are examined concurrently with the aim of evaluating the significance and strength of a certain relationship within the complete model can be performed. SEM can be thought of the mixture between two types of statistical techniques containing factor analysis and simultaneous equation models. SEM consist of exogenous and endogenous variables allowing the model to handle indirect, multiple, and inverse relationships (Hooper, et.al, 2008).
Several measures of goodness of fits to validate the model fits comprise the Chi-Squared test, Root Mean Square Error of Approximation (RMSEA), Goodness-of-Fit Index (GFI) and Adjusted Goodness-of-Fit Index (AGFI) (Hooper, et.al, 2008). In addition, the relative chi square which is the ratio between
2and df (degree of freedom) has been employed to evaluate the model fit (Wheaton et al, 1977 and Tabachnick and Fidell, 2007 in Hooper, et.al, 2008). Further, some evaluating measures are also used including Normed Fit Index (NFI), and Comparative Fit Index (CFI). Table 1 outlines criteria from Schermelleh-Engel and Moosbrugger (2003) to asses goodness-of-fit for overall SEMs.Table 1. SEM-goodness of fit (Schermelleh-Engel and Moosbrugger, 2003)
Fit Measures Good Fit Acceptable Fit
Root Mean Square Error of Approximation (RMSEA) 0 <RMSEA< 0.05 0.05
RMSEA
0.10Normed Fit Index (NFI) 0.95
NFI
1 0.90
NFI
0.95Comparative Fit Index (CFI) 0.97
CFI
1 0.95
CFI
0.97Goodness-of-Fit Index (GFI) 0.95
GFI
1 0.90
GFI
0.95Adjusted Goodness-of-Fit Index (AGFI) 0.90
AGFI
1 0.85
AGFI
0.90In accordance to Lai (2011), Parsimony Normed Fit Index (PNFI) is employed as a fit index and to assess goodness- of-fit for overall SEMs as shown in Table 2. In this study, SEM is constructed using IBM SPSS AMOS software (version 23). Interested readers on PCA and SEM are referred to Hair et al. (2010) for detailed discussions.
Table 2. SEM-goodness of fit (Lai, 2011) Test Statistics Fit Indices Indicator Value Absolute fit test
2/df < 5p-value < 0.05 RMSEA < 0.08 Incremental fit test NFI
CFI
Between 0 and 1, close to 1 is better Between 0 and 1, close to 1 is better Parsimonious fit test PNFI > 0.5
3. METHODS
A questionnaire was proposed after reviewing relevant literatures (Albert, et.al, 2011; Pal, 2004; Prato, et.al, 2012).
The questionnaire consists of 13 items allocated into 3 parts as shown in Table 3. Part I of the questionnaire is intended to collect information of route selected by motorists (whether to or not to use toll road of Bali Mandara). In Part II, facts of motorists’ (individual) characteristics are collected consisting gender, household size, monthly household income and daily average travel distance. Last part contains motorists’ perception on the reasons using the toll road of Bali Mandara. In this part, the respondents were asked to provide their responses on a 5-point Likert scale along with their satisfaction of the selected route. The 5-point Likert scale ranges from 1(very unsatisfactory) to 5 (very satisfactory). The motorists were interviewed at three (3) separated places located in Benoa, Ngurah Rai Airport and Nusa Dua between November and Desember 2016. They were also asked to pick only one best answer.
All factors are considered as the independent variables in the study.
Table 3. Items in the questionnaire I. Route selected (0: not to use toll road; 1: use toll road )
II. Motorists’ characteristics
a. X1: Gender (0: female ; 1: male).
b. X2: Household size (0: 1 person; 1: 2 persons; 2: 3 persons; 4: more than 3 persons)
c. X3: Monthly household income (0: < 2 million rupiahs; 1: 2 - 4 million rupiahs; 2: > 4 million rupiahs) d. X4: Daily average travel distance (0: < 10 kms; 1: 10 - 20 kms; 2: > 20 kms)
III. Motorists’ perceptions towards the use of toll road of Bali Mandara a. X5:Tariff (1: Very unsatisfactory; 5: very satisfactory)
b. X6:Efficiency/travel time (1: Very unsatisfactory; 5: very satisfactory) c. X7:Accessibility (1: Very unsatisfactory; 5: very satisfactory)
d. X8:Information system (1: Very unsatisfactory; 5: very satisfactory) e. X9:Traffic flows (1: Very unsatisfactory; 5: very satisfactory)
f. X10:Road surface conditions (1: Very unsatisfactory; 5: very satisfactory) g. X11:Road safety (1: Very unsatisfactory; 5: very satisfactory)
h. X12:Comfort (1: Very unsatisfactory; 5: very satisfactory) i. X13:Road security (1: Very unsatisfactory; 5: very satisfactory) j. X14:Lighting system (1: Very unsatisfactory; 5: very satisfactory) k. X15:Traffic sign (1: Very unsatisfactory; 5: very satisfactory) l. X16:Toll road service (1: Very unsatisfactory; 5: very satisfactory) m. X17:Road side view (1: Very unsatisfactory; 5: very satisfactory)
There were 400 questionnaires circulated for these three locations. The effective responses however were 381 (95%) included in the model development. As shown in Figure 1, these places of Benoa, Nusa Dua and Ngurah Rai Airport were selected to collect the information because these locations are the turning point for motorists whether they use or not to use toll road for their trips. There were 45.41% and 54.59 % of the respondents using toll and non-toll roads respectively consisting 236 (61.94%) males and 145 (38.06%) females.
Figure 1. Case study area – toll road of Bali Mandara
TRP-4
This study is basically focused on the practise of self-reported perceptions on using the toll road of Bali Mandara.
The main reason is because a self-reported technique allows a researcher to carry out anonymous surveys that offer in-depth information and its motivational factors (Lajunen et al., 2004 in Steg & van Brussel, 2009). In the meantime, before the model construction the hypotheses below are firstly constructed to examine the relationship among the variables shown in Table 3:
H1: motorists’ (individual) characteristics are expected to influence route choice behaviour.
H2: motorists’ (individual) characteristics are expected to influence motorists’ perceptions.
H3: motorists’ perceptions are expected to influence route choice behaviour 4. RESULTS AND ANALYSIS
The developed model contains endogenous and exogeneous variables. Motorists’ perception contains ordinal data, so that the PCA is used to select variables of motorists’ perception to be included in the model development. Table 4 demonstrated the reliability analysis of observed variables that satisfying the PCA criteria described earlier. The table shows the two components of motorists’ perceptions consisting comfort (X12) and security (X13) in using toll roads. These two variables were kept in a perception latent variable describing 21.694% of the variances. The loading factors of comfort (X12) and security (X13) in using toll roads were 0.755 and 0.745 respectively with a consistency level of 0.592. An alpha value of 0.59 however, indicates the scales have low levels of internal consistency (Loo, et.al, 2015)
Table 4. PCA and reliability analysis of observed variables
Observed variables Mean Standard Deviation
Reliability Loading
factors
% Variance explained
Cronbach’s Alpha Comfort in using toll road 3.769 0.668 0.755
21.694 0.592
Security in using toll road 3.785 0.693 0.745
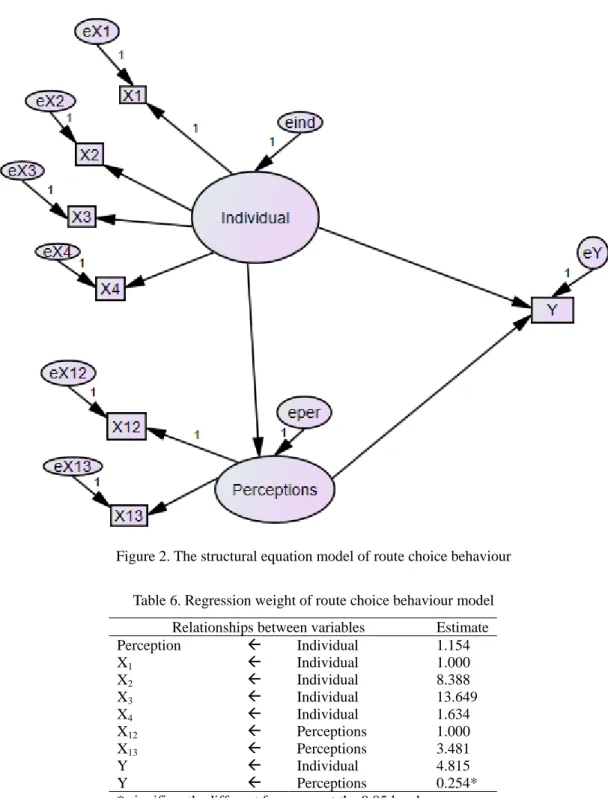
Figure 2 exhibits the SEM for this study with a reference to hypotheses explained earlier and the correlations between observed and latent variables. The criteria from the Schermelleh-Engel and Moosbrugger (2003) and Lai (2011) presented in Table 2 are used to validate the goodness of fit of the constructed model as shown in Table 5.
Based on Tables 2 and 5, the constructed model are statistically acceptable.
Table 5. Model validation
Fit Measures
2 df p-value
2/df RMSEA NFI CFI GFI AGFI PNFI Route choice 63.496 12 0.000 5.291 0.10 0.739 0.768 0.956 0.898 0.422Figure 2 describes the causal relationships between influencing factors towards route choice behaviour. There are two latent variables of individual representing motorists’ characteristics and perceptions consisting comfort (X12) and security in using toll road (X13). Meanwhile, motorists’ characteristics contain of gender (X1), household size (X2), monthly household income (X3) and daily average travel distance (X4). The route selected whether to or not to use toll road of Bali Mandara is considered as an endogenous variable, while these latent variables consisting motorists’ characteristics and perceptions are indicated as exogenous variables.
Table 6 shows the analysis results of SEM. Only a variable of motorists’s perception (estimate = 0.254) is significantly different from zero at the 0.05 level and is affecting motorists positively on selecting toll road of Bali Mandara to do their trips. Table 6 also specifies that only one assumption (H3) for the SEM that is statistically accepted. In details, comfort and security reasons are two variables that affecting motorists to use toll road of Bali Mandara. Further, Table 6 advise that when the measures of perceptions increase by one unit, measures of motorists to choose using toll road of Bali Mandara would increase by 0.25 unit.
Figure 2. The structural equation model of route choice behaviour
Table 6. Regression weight of route choice behaviour model Relationships between variables Estimate
Perception Individual 1.154
X1 Individual 1.000
X2 Individual 8.388
X3 Individual 13.649
X4 Individual 1.634
X12 Perceptions 1.000
X13 Perceptions 3.481
Y Individual 4.815
Y Perceptions 0.254*
* significantly different from zero at the 0.05 level Where:
X1: Gender.
X2: Household size.
X3: Monthly household income.
X4: Daily average travel distance.
X12: Comfort.
X13: Road security.
Y : Toll road route selection.
TRP-6 5. CONCLUSIONS
This study found a variable of motorists’s perception significantly and positively affecting motorists on the toll road of Bali Mandara selection to do their trips. Both components of comfort (X12) and security in using toll road (X13) made up the variable of perception. As the measures of perceptions increase by one unit, measures of motorists to choose using toll road of Bali Mandara would increase by 0.25 unit. Further studies on motorists’ perceptions towards route choice in Bali are advised to establish more predictive on traffic forecasting and assignment.
REFERENCES
Albert, G., Toledo, T., and Ben-Zion, U. (2011). “The role of personality factors in repeated route choice behavior:
behavioral economics perspective”. European Transport \ Trasporti Europei , No. 48, 47-59.
Fyhri, A., and Backer-Grøndahl, A. (2012). “Personality and risk perception in transport”. Accident Analysis and Prevention, Vol. 49, 470-475.
Hair, J.F., Black, W.C., Babin, B.J., and Anderson, R.E. (2010) Multivariate Data Analysis 7th Edition. Pearson Prentice Hall, New York.
Hassan, H.M., and Abdel-Aty, M.A. (2013). “Exploring the safety implications of young drivers’ behavior, attitudes and perceptions”. Accident Analysis and Prevention, Vol. 50, 361– 370.
Hooper, D., Coughlan, J., and Mullen, M. (2008). “Structural equation modelling: guidelines for determining model fit”. Electronic Journal of Business Research Methods, 6(1), 53-60.
Lai, S.F. (2011). “The accident risk measuring model for urban arterials”. the 3rd International Conference on Road Safety and Simulation, Indianapolis, USA, September 14-16.
Loo, L.Y.L., Corcoran, J., Mateo-Babiano, D., and Zahnow, R. (2015) “Transport mode choice in South East Asia:
investigating the relationship between transport users’s perception and travel behaviour in Johor Bahru, Malaysia”. Journal of Transport Geography, Vol.46, 99-111.
Pal, A. (2004). Modeling of commuters' route choice behavior. Theses and Dissertations. Paper 1531. The University of Toledo, Ohio.
Prato C., Bekhor S., and Pronello C. (2012). “Latent variables and route choice behavior”. Transportation, 39(2), 299-319.
Schermelleh-Engel, K., and Moosbrugger, H. (2003). “Evaluating the fit of structural equation models: tests of significance and descriptive goodnessof-fit measures”.Methods of Psychological Research Online, 8(2), 23-74.
Steg, L and van Brussel, A. (2009). “Accidents, aberrant behaviours, and speeding of young moped motorcyclists”.
Transportation Research Part F, 12, 503-511.
The Influencing Factors of Route Choice Behaviour
by Pri Wedagama
Submission date: 12-Dec-2017 08:55PM (UTC+0700) Submission ID: 894762108
File name: Konteks11.pdf (1.54M) Word count: 2895
Character count: 15724
13 %
SIMILARIT Y INDEX
13 %
INT ERNET SOURCES
4 %
PUBLICAT IONS
3 %
ST UDENT PAPERS
1 7 %
2 2 %
3 2 %
4 1 %
5 1 %
6 1 %
The Influencing Factors of Route Choice Behaviour
ORIGINALITY REPORT
PRIMARY SOURCES
media.neliti.com
Int ernet Source
www.jstage.jst.go.jp
Int ernet Source
www.readbag.com
Int ernet Source
Submitted to University of St. Gallen
St udent Paper
Hassan, Hany M.. "Investigation of the Self- Reported Aberrant Driving Behavior of Young Male Saudi Drivers: A Survey-Based Study", Journal of Transportation Safety & Security, 2015.
Publicat ion
studentsrepo.um.edu.my
Int ernet Source
Exclude quotes Of f Exclude bibliography On
Exclude matches < 1%