LAMPIRAN 1
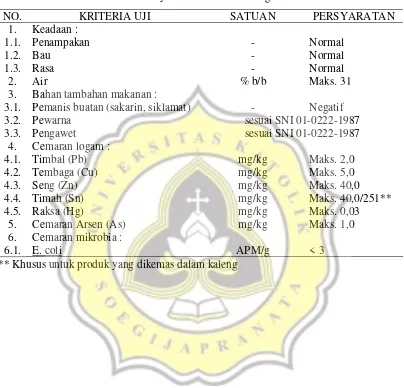
Standar Nasional Indonesia (SNI 01-3710-1995)
Tabel Syarat Mutu Buah Kering
NO. KRITERIA
UJI
SATUAN
PERSYARATAN
1. Keadaan
:
1.1. Penampakan
-
Normal
1.2. Bau
-
Normal
1.3. Rasa
-
Normal
2.
Air
% b/b
Maks. 31
3.
Bahan tambahan makanan :
3.1. Pemanis buatan (sakarin, siklamat)
-
Negatif
3.2. Pewarna
sesuai SNI 01-0222-1987
3.3. Pengawet
sesuai SNI 01-0222-1987
4. Cemaran
logam
:
4.1. Timbal (Pb)
mg/kg
Maks. 2,0
4.2. Tembaga (Cu)
mg/kg
Maks. 5,0
4.3. Seng (Zn)
mg/kg
Maks. 40,0
4.4. Timah (Sn)
mg/kg
Maks. 40,0/251**
4.5. Raksa (Hg)
mg/kg
Maks. 0,03
5.
Cemaran Arsen (As)
mg/kg
Maks. 1,0
6. Cemaran
mikrobia
:
6.1. E.
coli APM/g
<
3
** Khusus untuk produk yang dikemas dalam kaleng
LAMPIRAN 2
LEMBAR KUISIONER
Dihadapan saudara terdapat 12 jenis manisan melon. Saudara diminta memberi
penilaian berdasarkan tingkat kesukaan saudara dengan range nilai yang telah tersedia.
Atas kerja sama saudara, saya ucapkan terima kasih.
Kriteria
235 248 255 305 332 375
Warna
Aroma
Rasa
Tekstur
Overall
Kriteria
418 422 455 536 542 599
Warna
Aroma
Rasa
Tekstur
Overall
Range Nilai :
1 : Tidak Suka
2 : Agak Suka
3 : Suka
4 : Sangat Suka
5 : Sangat Suka Sekali
***GOD BLESS YOU***
LAMPIRAN 3
Dalam evaluasi sensoris ini disediakan 12 jenis sampel yang masing-masing telah diberi
kode yang berbeda. Kode dari masing-masing sampel tersebut adalah sebagai berikut :
235 = 0 jam, 1.5 cm
248 = 12 jam, 1.5 cm
255 = 24 jam, 1.5 cm
305 = 72 jam, 1.5 cm
332 = 0 jam, 2 cm
375 = 12 jam, 2 cm
418 = 24 jam, 2 cm
422 = 72 jam, 2 cm
455 = 0 jam, 2.5 cm
536 = 12 jam, 2.5 cm
542 = 24 jam, 2.5 cm
599 = 72 jam, 2.5 cm
LAMPIRAN 4
Uji Normalitas Manisan Melon Kering
Tests of Normality
.160 9 .200* .965 9 .844
.154 9 .200* .983 9 .978
.175 9 .200* .924 9 .427
.164 9 .200* .936 9 .543
Perendaman 0 jam 12 jam 24 jam 72 jam Kadar_Air
Statistic df Sig. Statistic df Sig.
Kolmogorov-Smirnova Shapiro-Wilk
This is a lower bound of the true significance. *.
Lilliefors Significance Correction a.
Tests of Normality
.139 12 .200* .955 12 .710
.156 12 .200* .923 12 .310
.146 12 .200* .969 12 .905
Ketebalan 1.5 cm 2 cm 2.5 cm Kadar_Air
Statistic df Sig. Statistic df Sig.
Kolmogorov-Smirnova Shapiro-Wilk
This is a lower bound of the true significance. *.
Lilliefors Significance Correction a.
Tests of Normality
.317 9 .009 .767 9 .009
.267 9 .064 .843 9 .062
.208 9 .200* .899 9 .248
.206 9 .200* .884 9 .172
Perendaman 0 jam 12 jam 24 jam 72 jam Vitamin_C
Statistic df Sig. Statistic df Sig.
Kolmogorov-Smirnova Shapiro-Wilk
This is a lower bound of the true significance. *.
Lilliefors Significance Correction a.
Tests of Normality
.223 12 .101 .853 12 .040
.249 12 .039 .914 12 .239
.260 12 .024 .863 12 .053
Ketebalan 1.5 cm 2 cm 2.5 cm Vitamin_C
Statistic df Sig. Statistic df Sig.
Kolmogorov-Smirnova Shapiro-Wilk
Lilliefors Significance Correction a.
Tests of Normality
.207 9 .200* .934 9 .525
.194 9 .200* .922 9 .408
.208 9 .200* .885 9 .179
.251 9 .108 .828 9 .042
Perendaman 0 jam 12 jam 24 jam 72 jam Kadar_Sukrosa
Statistic df Sig. Statistic df Sig.
Kolmogorov-Smirnova Shapiro-Wilk
This is a lower bound of the true significance. *.
Lilliefors Significance Correction a.
Tests of Normality
.225 12 .094 .909 12 .209
.183 12 .200* .890 12 .117
.183 12 .200* .893 12 .127
Ketebalan 1.5 cm 2 cm 2.5 cm Kadar_Sukrosa
Statistic df Sig. Statistic df Sig.
Kolmogorov-Smirnova Shapiro-Wilk
This is a lower bound of the true significance. *.
Lilliefors Significance Correction a.
Tests of Normality
,267 9 ,065 ,912 9 ,330
,185 9 ,200* ,862 9 ,100
,184 9 ,200* ,885 9 ,178
,203 9 ,200* ,915 9 ,349
Perendaman 0 jam 12 jam 24 jam 72 jam Kadar_Abu
Statistic df Sig. Statistic df Sig.
Kolmogorov-Smirnova Shapiro-Wilk
This is a lower bound of the true significance. *.
Lilliefors Significance Correction a.
Tests of Normality
,172 12 ,200* ,916 12 ,256
,125 12 ,200* ,962 12 ,812
,256 12 ,029 ,877 12 ,080
Ketebalan 1.5 cm 2 cm 2.5 cm Kadar_Abu
Statistic df Sig. Statistic df Sig.
Kolmogorov-Smirnova Shapiro-Wilk
This is a lower bound of the true significance. *.
Lilliefors Significance Correction a.
Tests of Normality
.263 9 .073 .923 9 .416
.226 9 .200* .903 9 .270
.279 9 .042 .882 9 .166
.225 9 .200* .896 9 .232
Perendaman 0 jam 12 jam 24 jam 72 jam Hardness
Statistic df Sig. Statistic df Sig.
Kolmogorov-Smirnova Shapiro-Wilk
This is a lower bound of the true significance. *.
Lilliefors Significance Correction a.
Tests of Normality
.196 12 .200* .932 12 .406
.182 12 .200* .917 12 .262
.199 12 .200* .930 12 .377
Ketebalan 1.5 cm 2 cm 2.5 cm Hardness
Statistic df Sig. Statistic df Sig.
Kolmogorov-Smirnova Shapiro-Wilk
This is a lower bound of the true significance. *.
Lilliefors Significance Correction a.
Tests of Normality
.187 9 .200* .896 9 .230
.218 9 .200* .841 9 .059
.175 9 .200* .868 9 .118
.262 9 .076 .801 9 .021
Perendaman 0 jam 12 jam 24 jam 72 jam Chewiness
Statistic df Sig. Statistic df Sig.
Kolmogorov-Smirnova Shapiro-Wilk
This is a lower bound of the true significance. *.
Lilliefors Significance Correction a.
Tests of Normality
.241 12 .052 .837 12 .026
.229 12 .084 .769 12 .004
.237 12 .060 .890 12 .117
Ketebalan 1.5 cm 2 cm 2.5 cm Chewiness
Statistic df Sig. Statistic df Sig.
Kolmogorov-Smirnova Shapiro-Wilk
Lilliefors Significance Correction a.
LAMPIRAN 5
Uji Post Hoc Two Way Anova :
* Kadar Air Manisan Melon Kering
kadar_air
Duncana,b
9 19.8589
9 20.3867
9 20.4833
9 20.6289
1.000 .225
perendaman 0 jam 12 jam 24 jam 72 jam Sig.
N 1 2
Subset
Means for groups in homogeneous subsets are displayed. Based on Type III Sum of Squares
The error term is Mean Square(Error) = .152. Uses Harmonic Mean Sample Size = 9.000. a.
Alpha = .05. b.
kadar_air
Duncana,b
12 20.1225
12 20.3517 20.3517
12 20.5442
.163 .238
ketebalan 1.5 cm 2 cm 2.5 cm Sig.
N 1 2
Subset
Means for groups in homogeneous subsets are displayed. Based on Type III Sum of Squares
The error term is Mean Square(Error) = .152. Uses Harmonic Mean Sample Size = 12.000. a.
Alpha = .05. b.
kadar_abu
Duncana,b
9 1.3778
9 1.7778
9 1.9556 1.9556
9 2.1444
1.000 .106 .087
perendaman 72 jam 24 jam 12 jam 0 jam Sig.
N 1 2 3
Subset
Means for groups in homogeneous subsets are displayed. Based on Type III Sum of Squares
The error term is Mean Square(Error) = .051. Uses Harmonic Mean Sample Size = 9.000. a.
Alpha = .05. b.
kadar_abu
Duncana,b
12 1.6333
12 1.7083
12 2.1000
.422 1.000
ketebalan 2.5 cm 2 cm 1.5 cm Sig.
N 1 2
Subset
Means for groups in homogeneous subsets are displayed. Based on Type III Sum of Squares
The error term is Mean Square(Error) = .051. Uses Harmonic Mean Sample Size = 12.000. a.
Alpha = .05. b.
vitamin_C
Duncana,b
9 19.9256
9 21.3922 21.3922
9 21.9789
9 24.5211
.088 .483 1.000
perendaman 72 jam 24 jam 12 jam 0 jam Sig.
N 1 2 3
Subset
Means for groups in homogeneous subsets are displayed. Based on Type III Sum of Squares
The error term is Mean Square(Error) = 3.055. Uses Harmonic Mean Sample Size = 9.000. a.
Alpha = .05. b.
vitamin_C
Duncana,b
12 21.5633
12 21.7833
12 22.5167
.219 ketebalan
2 cm 2.5 cm 1.5 cm Sig.
N 1
Subset
Means for groups in homogeneous subsets are displayed. Based on Type III Sum of Squares
The error term is Mean Square(Error) = 3.055. Uses Harmonic Mean Sample Size = 12.000. a.
Alpha = .05. b.
kadar_sukrosa
Duncana,b
9 9.3189
9 9.6667
9 10.2011
9 18.5611
.755 1.000
perendaman 72 jam 24 jam 0 jam 12 jam Sig.
N 1 2
Subset
Means for groups in homogeneous subsets are displayed. Based on Type III Sum of Squares
The error term is Mean Square(Error) = 31.103. Uses Harmonic Mean Sample Size = 9.000. a.
Alpha = .05. b.
kadar_sukrosa
Duncana,b
12 10.0008
12 11.4550
12 14.3550
.082 ketebalan
2.5 cm 2 cm 1.5 cm Sig.
N 1
Subset
Means for groups in homogeneous subsets are displayed. Based on Type III Sum of Squares
The error term is Mean Square(Error) = 31.103. Uses Harmonic Mean Sample Size = 12.000. a.
hardness
Duncana,b
9 .8600
9 1.3267
9 1.3700
9 1.8256
1.000 .819 1.000
perendaman 72 jam 12 jam 24 jam 0 jam Sig.
N 1 2 3
Subset
Means for groups in homogeneous subsets are displayed. Based on Type III Sum of Squares
The error term is Mean Square(Error) = .158. Uses Harmonic Mean Sample Size = 9.000. a.
Alpha = .05. b.
hardness
Duncana,b
12 .9833
12 1.4708
12 1.5825
1.000 .498
ketebalan 2 cm 2.5 cm 1.5 cm Sig.
N 1 2
Subset
Means for groups in homogeneous subsets are displayed. Based on Type III Sum of Squares
The error term is Mean Square(Error) = .158. Uses Harmonic Mean Sample Size = 12.000. a.
Alpha = .05. b.
chewiness
Duncana,b
9 .0389
9 .0689
9 .1022
9 .1856
.109 perendaman
24 jam 72 jam 0 jam 12 jam Sig.
N 1
Subset
Means for groups in homogeneous subsets are displayed. Based on Type III Sum of Squares
The error term is Mean Square(Error) = .029. Uses Harmonic Mean Sample Size = 9.000. a.
Alpha = .05. b.
chewiness
Duncana,b
12 .0675
12 .0700
12 .1592
.228 ketebalan
2.5 cm 2 cm 1.5 cm Sig.
N 1
Subset
Means for groups in homogeneous subsets are displayed. Based on Type III Sum of Squares
The error term is Mean Square(Error) = .029. Uses Harmonic Mean Sample Size = 12.000. a.
Alpha = .05. b.
LAMPIRAN 6
Descriptive Statistics
Dependent Variable: kadar_air
19.4767 .65248 3
19.9067 .63090 3
20.1933 .43501 3
19.8589 .59231 9
20.1933 .24826 3
20.3867 .22368 3
20.5800 .08660 3
20.3867 .24047 9
20.3367 .38175 3
20.4833 .38175 3
20.6300 .52421 3
20.4833 .39711 9
20.4833 .14503 3
20.6300 .29000 3
20.7733 .14503 3
20.6289 .21751 9
20.1225 .53111 12
20.3517 .45106 12
20.5442 .37391 12
20.3394 .47654 36
ketebalan 1.5 cm 2 cm 2.5 cm Total 1.5 cm 2 cm 2.5 cm Total 1.5 cm 2 cm 2.5 cm Total 1.5 cm 2 cm 2.5 cm Total 1.5 cm 2 cm 2.5 cm Total perendaman 0 jam
12 jam
24 jam
72 jam
Total
Mean Std. Deviation N
Descriptive Statistics
Dependent Variable: kadar_abu
2.1333 .15275 3
1.9333 .15275 3
2.3667 .30551 3
2.1444 .26510 9
2.7000 .43589 3
1.8333 .32146 3
1.3333 .05774 3
1.9556 .65786 9
2.2000 .10000 3
1.5000 .17321 3
1.6333 .25166 3
1.7778 .35978 9
1.3667 .05774 3
1.5667 .23094 3
1.2000 .10000 3
1.3778 .20480 9
2.1000 .53767 12
1.7083 .27122 12
1.6333 .50332 12
1.8139 .48648 36
ketebalan 1.5 cm 2 cm 2.5 cm Total 1.5 cm 2 cm 2.5 cm Total 1.5 cm 2 cm 2.5 cm Total 1.5 cm 2 cm 2.5 cm Total 1.5 cm 2 cm 2.5 cm Total perendaman 0 jam
12 jam
24 jam
72 jam
Total
Mean Std. Deviation N
Descriptive Statistics
Dependent Variable: vitamin_C
24.7167 2.03227 3
23.5433 2.68844 3
25.3033 1.01614 3
24.5211 1.92352 9
24.7167 2.03227 3
21.1967 1.01614 3
20.0233 1.01614 3
21.9789 2.45420 9
21.1967 1.01614 3
21.7833 2.68844 3
21.1967 2.68844 3
21.3922 1.98948 9
19.4367 1.01614 3
19.7300 .88000 3
20.6100 .88000 3
19.9256 .96176 9
22.5167 2.75313 12
21.5633 2.23440 12
21.7833 2.55416 12
21.9544 2.48444 36
ketebalan 1.5 cm 2 cm 2.5 cm Total 1.5 cm 2 cm 2.5 cm Total 1.5 cm 2 cm 2.5 cm Total 1.5 cm 2 cm 2.5 cm Total 1.5 cm 2 cm 2.5 cm Total perendaman 0 jam
12 jam
24 jam
72 jam
Total
Mean Std. Deviation N
Descriptive Statistics
Dependent Variable: kadar_sukrosa
13.5200 2.92732 3
9.7933 4.46959 3
7.2900 2.41663 3
10.2011 3.99595 9
25.0933 6.98974 3
18.4600 10.16714 3
12.1300 4.26536 3
18.5611 8.60929 9
8.9800 4.17165 3
10.1800 5.11203 3
9.8400 5.49855 3
9.6667 4.32774 9
9.8267 4.43217 3
7.3867 5.79739 3
10.7433 6.43433 3
9.3189 5.09129 9
14.3550 7.89224 12
11.4550 7.23756 12
10.0008 4.55984 12
11.9369 6.77815 36
ketebalan 1.5 cm 2 cm 2.5 cm Total 1.5 cm 2 cm 2.5 cm Total 1.5 cm 2 cm 2.5 cm Total 1.5 cm 2 cm 2.5 cm Total 1.5 cm 2 cm 2.5 cm Total perendaman 0 jam
12 jam
24 jam
72 jam
Total
Mean Std. Deviation N
Descriptive Statistics
Dependent Variable: hardness
2.6733 .30022 3
1.2867 .38553 3
1.5167 .19655 3
1.8256 .69538 9
1.6933 .58398 3
.7767 .22480 3
1.5100 .82486 3
1.3267 .66667 9
1.2933 .36856 3
1.2767 .41356 3
1.5400 .07550 3
1.3700 .30733 9
.6700 .25120 3
.5933 .22189 3
1.3167 .35133 3
.8600 .42113 9
1.5825 .83206 12
.9833 .42184 12
1.4708 .40372 12
1.3456 .62798 36
ketebalan 1.5 cm 2 cm 2.5 cm Total 1.5 cm 2 cm 2.5 cm Total 1.5 cm 2 cm 2.5 cm Total 1.5 cm 2 cm 2.5 cm Total 1.5 cm 2 cm 2.5 cm Total perendaman 0 jam
12 jam
24 jam
72 jam
Total
Mean Std. Deviation N
Descriptive Statistics
Dependent Variable: chewiness
.1100 .14933 3
.0567 .08963 3
.1400 .06245 3
.1022 .09947 9
.3567 .55734 3
.1567 .00577 3
.0433 .04041 3
.1856 .31137 9
.0400 .02646 3
.0667 .05508 3
.0100 .01732 3
.0389 .04014 9
.1300 .01000 3
.0000 .00000 3
.0767 .04933 3
.0689 .06194 9
.1592 .27583 12
.0700 .07385 12
.0675 .06341 12
.0989 .16958 36
ketebalan 1.5 cm 2 cm 2.5 cm Total 1.5 cm 2 cm 2.5 cm Total 1.5 cm 2 cm 2.5 cm Total 1.5 cm 2 cm 2.5 cm Total 1.5 cm 2 cm 2.5 cm Total perendaman 0 jam
12 jam
24 jam
72 jam
Total
Mean Std. Deviation N
LAMPIRAN 7
Berikut adalah waktu, suhu dalam dan suhu luar STD juga RH didalam STD yang
dicatat dari pengukuran dengan alat thermohigrometer selama penimbangan sampel
guna menentukan laju pengeringan manisan nanas :
Pengambilan
Jam
Suhu dalam (ºC)
Suhu Luar (ºC)
RH (%)
0 14.45
28.4
25.6
68
2 09.15
30 29.5
71
4 11.15
51.5
29.2
60
6 09.15
38.4
25.7
75
8 11.15
47.8
28 64
10 13.15
66.4 30.4 54
12 09.30
31 29.2 66
14 11.30
63 31.5 53
16 12.00
65.4 31.2 58
18 10.15
59.1 29.4 57
20 12.15
85 32 45
22 14.15
110 33.2 55