THE EFFECT OF FINANCIAL PERFORMANCE AND FIRM SIZE ON STOCK
PRICES OF MANUFACTURING COMPANY IN 2013-2016
Olivia Christina1, Robiyanto2
1,2Fakultas Ekonomika dan Bisnis, Universitas Kristen Satya Wacana, Salatiga e-mail: 1[email protected], 2[email protected]
ABSTRACT
This study aimed to find out the effect of financial performance which consist of return on equity, current ratio, debt to equity ratio and firm size i.e Ln_total asset to the stock price of manufacturing companies which are listed in Indonesia Stock Exchange period 2013-2015. The secondary data source of this research has been obtained from IDX and ICMD. The data analysis technique has been carried out by using multiple regressions analysis. Based on the partial testing hypothesis, ROE and Ln_total asset have a significant positive effect on stock prices, while CR and DER has no significant positive effect on stock prices. For simultaneous testing, independent variables has simultaneous effect on dependent variable, so that it can be concluded that the model is feasible to be applied. The result of the hypothesis test has been carried out by using partial test (t test) shows that debt to equity ratio, return on asset and return on equity has significant influence to the stock price.
Kata Kunci: Return on Equity, Current Ratio, Debt to Equity Ratio, Total Asset, Stock price 1. INTRODUCTION
The manufacturing company is an industry that requires a lot of funds to operates an activity. One of the things that was done was to rely on capital from investors. The company must be able to maintain their financial health to survive and compete in order to obtain the sufficiency of funds, one of which is to sell the company's shares to the public/investors through the capital markets.
The capital market is a meeting place between parties that have excess funds with parties which needs funds by trading securities, according to Tandelilin (2010). Fahmi (2012) stated that the capital market is a place where the various parties, especially the company that sell the stock and bonds, with purpose to proceeds the sales that will be used as additional funds or to strengthen the company's capital. In Indonesia, Indonesia Stock Exchange (IDX) have a role as the capital markets. The stock exchange is a place that provides systems and tools to bridge between buy and sell deals the securities of other parties with the purpose of securities trading.
Tandelilin (2010), stock is a letter of evidence of stock ownership in a company. The stock was able to attract the attention of investors because stocks can provide a higher yield than other instruments. The yield over
be ignored. The higher expected rate of return, then the risks faced by investors will also be higher. Based on these, the investor must be observant and consider well before investing in stocks.
Related to this research, the stock price becomes a factor for investors in terms of investment decision making. Stock prices that expected by investors is stock that have a stable price and have a graph pattern tends to rise over time, but in fact, stock price tend to fluctuated, so that can be a risk for the investor. In its movement, there are various factors that could affect the stock price of a company, such as financial performance. Rudianto (2013) stated that the financial performance are the results or achievements that have been attained by the company's management in carrying out its function of managing company assets effectively during a certain period. Financial performance is urgently needed by the company to find out and evaluating about the success rate of companies based on financial activities which have been implemented. Brigham (2012) stated that good financial performance will cause stock prices being high. Indicator to see the financial performance of a company among them is, the ratio of profitablilitas indicated by Return On Equity; liquidity ratios, indicated by Current Ratio; and solvency ratio indicated by Debt to Equity Ratio (Sutrisno 2009).
Related on profitability, Hutami (2012) proves that ROE has a significant effect with stock prices. But the result from Kataren (2011) showed the difference, which ROE has no significant effect with stock prices. Research conducted by Setiyawan (2014) concerning the liquidity ratio, indicating that CR has significant effect with stock prices, while Kataren (2011) shows that the current ratio has no significant effect ratio with stock prices. Another variable i.e solvency, research conducted by Gunawan and Wijayanti (2003), Dwiparatama (2010), and Sunaryo (2011) shows that the DER has negative effect with stock prices, while Amalia showed the different result that DER has significant effect with stock prices.
In previous research still found a difference results between one variable with another variable, and this research aims to find out whether the variables of financial performance and variable of firm size have an effect on stock price of manufacturing company. The benefits from this research would be useful for investors as a consideration in investment decisions on manufacturing company taking into account the financial performance and firm size as variables that can effected stock prices. On the other hand, the benefit for the company is, so the company was able to see how good their company's performance and the size of the company, so it's not graded poorly for investors.
2. LITERATURE REVIEW AND HYPOTHESIS DEVELOPMENT
2.1 Signalling Theory
Signal theory explains that companies provide information to investors in the form of financial statements as a signal to the market. Good financial reports is a signal or a sign that the company also has been operating well. A good signal will be responded properly by others. Information is an important element for investors because it presents the explanation, notes, or historical data of the company, either bad or good performance in the past, current or future for the exixtence of a company and about the securities market. The complete, accurate, relevant, timely information is needed by investors in the capital market as an analysis tool for investment decisions.
Accounting information announcement gave the signal that the company has good prospects in the future, so investors are interested in trading stocks, thus the market will react which is reflected through changes in the volume of stock trading. Therefore, the relationship between good information publication of the financial statements, either financial or social political conditions against fluctuations in the volume of stock trading can be seen in market efficiency. When the financial statemenet of a company shows good prospects, it means the price and return of stock will also be higher.
2.2 Stock and Stock Price
The stock is evidence of ownership or the capital remittance of a limited company, acquired through the
and shareholders have a right of claim against income and assets of the company. Then according to Darmadji (2006) stocks is a sign of inclusion or the ownership of a person or entity within a corporation or limited company. A number of stocks certainly have the status of ownership, i.e. by the shareholders themselves. Shareholders are the owners of a company that represents by management to run the company's operations.
Tandelilin (2010) stated, stock prices that occurred in the market will be important for the company because that price will determine the magnitude of value in a company, or in other words the stock price is price that occurs on the market that can determine the wealth of the company to issuing stock. The price of the stock market index is a measure of the company's achievements, i.e. how far management has been successfully managing the company. According to Sartono (2008), the stock price is formed through the mechanism of supply and demand in the capital markets. When a stock is has an excess of demand, then stock prices tend to rise while if stocks excess of supply, then the stock price tends to fall.
2. 3 Financial performance
Financial performance is the determination of measures that can be used to benchmark the success of a company to generate profit. The financial performance of the company is one of the factors that can be seen by candidate of investors to determine the investment shares. The company's financial performance can be an indicator from the fluctuative of stock prices in a company. Wibowo (2014) stated that the good and bad things of a company can be described through the financial performance. This can be known by analyzing and using financial analysis tools to find out financial condition and financial achievements of a company in certain time. Sutrisno (2009) stated that financial performance can be seen from several ratios include profitability ratio, likuidity ratio, and ratio of solvency.
2.3.1 Ratio of Profitability
According to Kasmir (2012), the ratio of profitability is a ratio that assess the ability of a company to obtaining profits. This ratio also gives a measure of the effectiveness in management. Companies that have a high profitability ratio shows that the company is able to get the high advantage, so that the company's financial performance has increased. Profitability can be seen from Return On Equity ratio, which is a measurement from available income to the owners of such companies, this applies both common shareholders nor preferred shareholders over the capital that they invested within the company.
2.3.2 Ratio of Liquidity
the current ratio, i.e. the ratio which indicates the extent to which current asset can cover current liabilities. The larger comparison of current assets and current liabilities, the higher a company's capabilities cover short term liabilities.
2.3.3 Ratio of Solvency
According to Kasmir (2012) the Solvency Ratio is a ratio that used to measure the extent to which company assets was financed with debt. It means that how many the debt that guaranteed by the company compared with its assets. It can be said that the solvency ratio is used to measure the company's ability to pay all obligations, whether short term or long term when the company is liquidated. Solvency ratio can be measured by using the Debt to Equity Ratio (DER), which is the ratio that used to assess the debt with its own equity. This ratio is calculated by comparing all debts, including short term liabilities with the whole equity. This ratio is useful to know the amount of funding provided by creditors and company owners. In other words, this ratio serves to know every rupiah in capital itself that was made to guarantee debt.
2.3.4 Firm Size
Firm size is a large and small scale of a company that can be seen from the values of companies and its equity or the results of asset value in such companies, according to Riyanto (2010). Companies with a large size will more easily enter into the capital markets to get funds in larger quantities. Indicators that used to knowing the magnitude of firm size is total assets of the company. The greater of its asset, then the greater its capital also invested.
2.4. Hypothesis Development
2.4.1 The Effect of Return On Equity on Stock Prices
Return On Equity (ROE) ratio is used to examine the extent to which a company uses its resources to generate return on equity, according to Irham (2012). The higher ROE make company's ability to distribute dividends will be even greater. It means that the company can use the capital well, so investors believe that the company will provide a greater profit, and it will effect in increasing of stock prices. Research conducted by Setiawan and Pardiman (2014) suggests that ROE has an positive effect towards the stock prices. From the explanation above, it can be concluded the first hypothesis:
H1 : Return On Equity has a significant positive effect with stock prices 2.4.2 The Effect of Current Ratio on Stock Prices
Current ratio is a ratio to measure the company's ability to pay short-term liablilities or debts that are maturing soon. In other words, how much current assets available to cover short-term liabilities or debts that are maturing soon, according to Kasmir (2012). The higher CR will make the company be more capable in paying short-term liabilities, and it enables the company to avoid risk of liquidity. It makes investors interested in buying shares of the company, and as a result the stock price are increasing. Research conducted by Setiawan and Pardiman (2014) shows that CR has a positive effect against stock price. From the explanation above it can be concluded the second hypothesis as follows:
H2 : Current Ratio a significant positive effect with stock prices 2.4.3 The Effect of Debt to Equity Ratio on Stock Prices
Debt to Equity Ratio is the ratio that describe the extent to which the equity of owners can cover debts
and make investors less interested to invest in such a company, it will have an effect on the decline in stock prices. In contrast, the lower DER means well for the company, because the company's financial risk is also low. As a result, investors interested to investing in shares of these companies. Furthermore, stock prices also rising. The research result that has been done by Agustiningsih (2012), and Primayanti (2013) shows that the DER has significant effect to stock prices. From the explanation above, can be concluded the third hypothesis as follows: H3 : Debt to Equity Ratio has a significant positive effect with stock prices
2.4.4 The Effect of Firm Size on Stock Prices
Firm size is the average of total net sales for the couple of years. In this case, the sales is greater than variable and fix costs, it will be obtained the amount of income before taxes. In contrast, if the sales is less than the variable costs and fixed costs then companies will suffer losses, according to Brigham and Houston (2001). Firm size measure how large of a company by looking at the total assets in the financial statements. The larger size of a company will makes better reputation in such a company. Investors will be interested to invest its capital, and the stock return will increase. Earlier research conducted by Sugiarto (2011), shows that firm size has a positive effect against stock prices. From the explanation above, then the fourth hypothesis can be summed up as follows:
3. RESEARCH METHOD
3.1 Sample and Population
The population in this study are all the manufacturing companies listed on Indonesia stock exchange (IDX) and Indonesia Capital Market Directory (ICMD) in 2013-2016, consists of three sectors, i.e the basic materials and chemicals, consumption goods industry and other industries. Sample of companies in this study is taken with purposive sampling methods with criteria that are presented in the table below. The following is a table of sample criteria:
Table 1. Sample and Criteria
No Description Number of Samples
1. Manufacturing companies listed on the Indonesia stock exchange and ICMD years 2013-2016
143
2. Manufacturing companies who do not publish annual report of the year 2013-2016
(15)
3. Manufacturing companies that do (not) stock split and reverse stock split of the year 2013-2016
(25)
4 Companies that (do not) publish financial statements denominated in USD
(31)
5. Companies that (do not) have Debt to Equity Ratio more than 3 (>3)
(9)
6. Companies that meet the criteria (Sample) 63 Source: idx.co.id, proccessed data
3.2 Data Collection and Variables Measurement
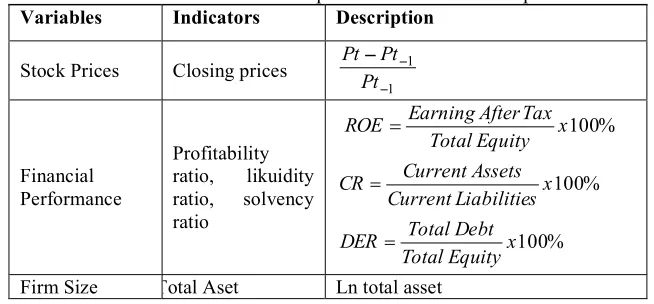
The data used in this study is time series data obtained secondarily from the publication of financial statement by official website of BEI: www.idx.co.id; and taken from Indonesia Capital Market Directory (ICMD). Variables measurement are shown in Table 2.
Table 2. Variables Measurement of Independent Variables and Dependent Variable Variables Indicators Description
4. RESULTS AND DISCUSSION
4.1 Results
4.1.1 Multicollinearity Test Result
Multicollinearity can be seen in the value of the Variance inflation Factor (VIF), cut off the value commonly used to indicate the presence of multicollinearity is the value of tolerance < 0.10 or VIF > 10, according to Ghozali (2012).
Table 3. Multicollinearity Test Result for Stock Prices Regressions Equations Independent Variables Tolerance VIF
ROE .991 1.009
CR .977 1.023
DER .982 1.018
Ln_Total Aset .987 1.013
Source: SPSS Output, proccessed
Based on the table 4 table, it can be seen that each independent variables (ROE, CR, DER, Ln_total assets) have VIF value that is not greater than 10, while tolerance value of each independent variables is larger than 0.10, it can be concluded that there are no multicollinearity in this regressions equations.
4.1.2 Autocorrelation Test Result
To examine the existence of autocorrelation or not can be done with the Durbin-Watson test (DW). In the table below can be seen that the value of DW is 1.846, greater than 1.729 and less than (4-du), i.e. 2.271, it can be concluded that there is no autocorrelation in this regression equations.
Table 4. Autocorrelation Test Result for Stock Prices Regressions Equations Model Regresi DW Value dL dU Conclusion
Ln_Price 1.846 1.460 1.729 No Autocorrelation
Source :SPSS Output, proccessed 4.1.3 Heteroscedastiscity Test Result
The test of heteroscedastiscity is carried out by white test using Eviews. The table 6 below shows Chi-square value is 10.225 with probability of chi-Chi-square equal with 0.745 is greater than 0.05, so it can be concluded that there is no heteroscedastiscity in this equation.
Table 5. Heteroscedasticity Test White for Stock Prices Regressions Equations
F-statistic 0.715 Prob F 0.757
Chi-square 10.225 Prob Chi-square 0.745
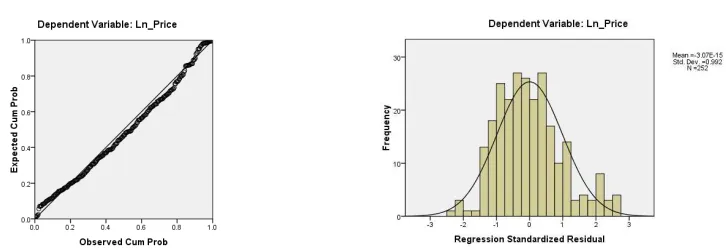
Source: Eviews Output, processed 4.1.4 Normality Test Result
Based on Figure 1., it can be seen that on P-P Plot pattern of standardized residual follows the diagonal line, while histogram follows the normal curve, although there are some data that came out of the curve, but generally, the data distribution follows the normal curve, then it can be concluded that the standardized residual is normally distributed and meet the assumption of normality.
4.1.5 The Result of Multiple Regression Analysis
Table 7. Result of Multiple Regression Analysis with ROE, CR, DER, Ln_Total Asset as Independent Variables Unstandardized
Coefficient
Standardized Coefficient
t sig
(Constant) 1.060 9.979 .111
ROE 3.571 .429 7.863 .000*
CR 0.000 .002 .176 .963
DER 0.046 .022 .548 .672
Ln_totalaset 0.351 .397 7.571 .000*
R Square .369
F 36.103 0.000
Source : SPSS Output, preccessed
Information :*significant at a significance level of 5%
Based on the result of multiple regression analysis, the regression equation used as folows:
Y = 1,060 + 3,571ROE + 0,000CR + 0,046DER + 0,351Ln_TA + e
Whereas,
Y = Stock Prices
X1 = Profitability, ROE/Return On Equity X2 = Likuidity, CR/Current Ratio
X3 = Solvency, DER/Debt to Equity Ratio X4 = Firm Size, Total Aset
= Constant
= Regression coefficient parsial for each variables = Error
4.1.6 The Results of t Test
The coefficient of ROE is 3.571 with significance value of 0.000 greater than 0.05, it means that H1 is accepted, thus it can be concluded that ROE has a significant positive effect with stock prices. This finding is consistent with Irham (2012) and Setiawan and Pardiman (2014) which found that ROE has an positive effect towards the stock prices. Coefficient variable CR is 0.000 with significance value of 0.963 > 0.05, it means H2 rejected, that CR has no significant positive effect with stock prices. This finding does not support Kasmir (2012) and Setiawan and Pardiman (2014). Stock price is determine by its intrinsic value, while CR does not related with intrinsic value calculation.
Regression coefficient of DER is 0.046, with significance value of 0.05 > 0.672, it means that H3 is rejected, it can be concluded that DER has no significant positive effect to stock prices. This finding does not support Agustiningsih (2012) and Primayanti (2013). The last variable, i.e., Ln_total have regression coefficient of 0.351 with the significance value of 0.000 < 0.05, which means H4 is accepted, so it can be concluded that variable of Ln_total has a significant positive effect to stock prices. This finding supports Sugiarto (2011) which find the higher firm size, the higher stock price.
4.1.7 The Result of F test
Based on the Table 7, it can be seen the results of f test obtained f value of 36.103 with significance value of 0.000. Related to the significance value of 0.000 < 0.05, then can be concluded that independent variables had simultaneous effect on the dependent variable, i.e stock prices.
4.1.8 Coefficient Of Determination
Based on the Table 7, R2value of 0.369, which states that independent variables used in this research, i.e. ROE, CR, DER Ln_total was able to explain its effect on the stock price of 36.9%, while 63.1% described by variables that are not used in the research.
5. CONCLUSION
6. IMPLICATION
This study still has limitations, therefore there are some suggestions that can be recommended for future research, i.e : (1). Recommended to add research period be 5 years or more, so that it can brings better results. (2). The coefficient of determination (R2) value is 36,9%, it means that 36,9% of stock prices variable can be explained by the variable of ROE, CR, DER Ln_total assets, and the remains of 63,1% is explained by variables that are not used in the research. Then the author suggests to expand other variables that can affect the fluctuations in stock prices. (3). For investors, it is recommended to see other factors in addition to ROE, CR, DER Ln_total assets, because there are still many other factors such as economic conditions, market conditions, politics, etc, which may affect stock prices.
REFERENCES
[1] Agustiningsih, D. (2012). Pengaruh Return On Equity (ROE), Price Earning Ratio (PER), Earning Per Share (EPS) Terhadap Harga saham Perusahaan Manufaktur yang Terdaftar di Bursa Efek Indonesia. [2] Brigham , H. (2012). Dasar-dasar Manajemen Keuangan(5 ed.). Jakarta: Salemba 4.
[3] Dwiparatama. (2009). Pengaruh PBV, DER, EPS, DPR DAN ROA Terhadap Harga Saham (Studi Empiris Pada perusahaan Food and Beverage). Jurnal Ilmiah Akuntansi.
[4] Fahmi, I. (2012). Analisis Laporan Keuangan Bandung: Alfabeta.
[5] Halim, H. (2009). Analisis Laporan Keuangan(4 ed.). Yogyakarta: UPP STIM YKPN.
[6] Hantono. (2016). Pengaruh Ukuran Perusahaan, Total Hutang, Current Ratio terhadap Kinerja Keuangan dan Harga Saham sebagai Variabel Moderating. Jurnal Wira Ekonomi Mikroskil, 6(1).
[7] Hutami, R. P. (2014). Pengaruh Dividend Per Share, Return On Equity, Dan Net Profit Margin Terhadap Harga Saham Perusahaaan Industri Manufaktur Yang Tercatat Di Bursa Efek Indonesia Periode 2006-2010. Jurnal Nominal, 1(1).
[8] Irham, F. (2012). Pengantar Pasar Modal. Bandung: Alfabeta.
[9] Jogiyanto, H. (2014). Teori Portofolio dan Analisis Investasi. Yogyakarta: BPFE.
[10] Ketaren, A. V. (2011). Pengaruh Current Ratio, Debt to Equity Ratio, Total Assets Turn Over, Return On Equity, dan Earning Per Share terhadap Harga Saham pada Perusahaan Barang Konsumsi yang Terdaftar di Bursa Efek Indonesia.Universitas Sumatera.
[11] Murniati, S. (2016). Effect of Capital Structure, Company Size, and Profitability on the Stock Price of Food and Beverage Companies Listed on the Indonesia Stock Exchange. Information Management and Business Review, 8(1), 23-29.
[12] Primayanti, D. (2013). Pengaruh Kinerja Keuangan Perusahaan Terhadap Harga Saham (Studi Empiris Pada Perusahaan Manufaktur Yang Terdaftar Di BEJ Tahun 2010-2011).
[13] Riyanto, B. (2010). Dasar-dasar Pembelanjaan Perusahaan. Yogyakarta: BPFE. [14] Rusdin. (2008).Pasar Modal. Bandung: Alfabeta.
[15] S Tan, A. S. (2014). Analisis Faktor-Faktor yang Mempengaruhi Harga Saham pada Industri Transportation Services di Bursa Efek Indonesia Tahun 2009-2012. Jurnal Dinamika dan Manajemen, 2(2).
[16] Sartono. (2008). Manajemen Keuangan Teori dan Aplikasi(4 ed.). Yogyakarta: BPFE.
[17] Sujoko, U. S. (2007). Pengaruh Struktur Kepemilikan Saham, Leverage, Faktor Intern dan Faktor Ekstern terhadap Nilai Perusahaan. Jurnal Manajemen dan Kewirausahaan, 9(47).
[18] Sunaryo. (2011). Pengaruh Current Ratio, Debt to Equity Ratio, dan Dividend Pay Out Ratio terhadap Price Earning Ratio pada Kelompok Perusahaan Manufaktur yang terdaftar di BEI
[19] Susanti, S. A. (2012). Pengauh Likuditas, Profitabilitas, Solvabilitas dan Ukuran Perusahaan Terhadap Harga Saham Perusahaan Farmasi Di BEI. Jurnal Akuntansi Universitas Negeri Surabaya, 1(1).
[20] Sutrisno. (2009). Manajemen Sumber Daya Manusia. Jakarta: Pernada Media Group.
[21] Tandelilin, E. (2010). Portofolio dan Investasi: Teori dan Aplikasi(Vol. 9). Yogyakarta: Kanisius. [22] Wibowo. (2014). Manajemen Kinerja. Jakarta: Rajawali.