This is the final draft post-refereeing. 1
The publisher’s version can be found at http://dx.doi.org/10.1016/j.jcs.2005.06.005 2
Please cite this article as: Lagrain, B., Brijs, K., Veraverbeke, W.S., Delcour, J.A. The 3
impact of heating and cooling on the physico-chemical properties of wheat gluten-water 4
suspensions, Journal of Cereal Science 2005, 42, 327-333. 5
6
The impact of heating and cooling on the
7
physico-chemical properties of wheat gluten-water suspensions
8 9
Bert Lagrain*, Kristof Brijs, Wim S. Veraverbeke and Jan A. Delcour 10
Laboratory of Food Chemistry, Katholieke Universiteit Leuven 11
Kasteelpark Arenberg 20, B-3001 Leuven, Belgium 12
13
*Corresponding author: 14
Bert Lagrain 15
Tel: + 32 (0) 16321634 16
Fax: + 32 (0) 16321997 17
E-mail address: [email protected] 18
19
Running headline: Heating and cooling wheat gluten-water suspensions 20
Abbreviations: ACN, acetonitrile; db, dry basis; DTNB, 5.5’-dithio-bis(2-nitrobenzoic 22
acid); DTT, dithiothreitol; HMW-GS, high molecular weight glutenin subunits; HPLC, 23
high performance liquid chromatography; HT, holding time; LMW-GS, low molecular 24
weight glutenin subunits; P, Poise; RP, reversed phase; RVA, rapid visco analysis; SDS, 25
sodium dodecyl sulphate; SE, size exclusion; SH, sulphydryl; TFA, trifluoroacetic acid 26
27 28
Keywords: RVA, Wheat gluten, Heat treatment, Protein extractability, Cross linking 29
Abstract
31
The rapid visco analysis (RVA) system was used to measure rheological behaviour in 20% 32
(w/v) gluten-in-water suspensions upon applying temperature profiles. The temperature 33
profile included a linear temperature increase, a holding step, a cooling step with a linear 34
temperature decrease to 50 °C, and a final holding step at 50 °C. Temperature and duration 35
of the holding phase both affected RVA viscosity and protein extractability. Size-exclusion 36
and reversed-phase HPLC showed that increasing the temperature (up to 95 °C) mainly 37
decreased glutenin extractability. Holding at 95 °C resulted in polymerisation of both 38
gliadin and glutenin. Above 80 °C, the RVA viscosity steadily increased with longer 39
holding times while the gliadin and glutenin extractabilities decreased. Their reduced 40
extractability in 60% ethanol showed that γ-gliadins were more affected after heating than 41
α-gliadins and ω-gliadins. Enrichment of wheat gluten in either gliadin or glutenin showed 42
that both gliadin and glutenin are necessary for the initial viscosity in the RVA profile. The 43
formation of polymers through disulphide bonding caused a viscosity rise in the RVA 44
profile. The amounts of free sulphydryl groups markedly decreased between 70 °C and 80 45
°C and when holding the temperature at 95 °C. 46
glutenins which are elastic and insoluble in alcohol solutions (Veraverbeke and Delcour, 50
2002). Gliadins represent a heterogeneous mixture of proteins and α-, γ-, and ω-gliadins 51
can be distinguished. Cysteine residues in α- and γ-type gliadins are all involved in intra-52
glutenin subunits (GS) of high molecular weight (HMW-GS) and low molecular weight 54
(LMW-GS). The LMW-GS can be divided in B-, C-, and D-types. C-type LMW-GS 55
resemble α- and γ-type gliadins much more closely than B-type GS. D-type LMW-56
GS can be classified with the ω-gliadins. They probably arose by a mutation in ω-gliadin 57
genes resulting in the introduction of a cysteine residue. LMW-GS form both intra-chain 58
and inter-chain disulphide bonds among themselves and with HMW-GS leading to glutenin 59
polymers (Veraverbeke and Delcour, 2002). 60
Gluten proteins are susceptible to heat treatment. Heating wet gluten progressively 61
decreases its breadmaking performance and at 75 °C most of its functionality is lost. The 62
molecular size of the glutenin aggregates increases and, hence, their extractability decreases 63
(Booth et al., 1980; Schofield et al., 1983; Weegels et al., 1994). At 100 °C, gliadins 64
undergo similar changes. The extractability of gliadins from bread by 60% ethanol is much 65
lower than that from flour, and α- and γ-gliadins are more affected than ω-gliadins (Wieser, 66
1998). The effects have been ascribed to sulphydryl (SH) -disulphide interchange reactions 67
induced by heat that affect all gluten proteins except the cysteine free ω-gliadins (Booth et 68
al., 1980; Schofield et al., 1983). Morel et al. (2002) suggested that below 60 °C no change 69
in free sulphydryl groups occurs. Heating to at least 90 °C leads to disulphide bond linked 70
aggregates and conformational changes affecting mostly gliadins and low molecular weight 71
albumins and globulins (Guerrieri et al., 1996). 72
2002). Due to crosslinking reactions, gluten viscosity levels off or increases upon heating 77
(Attenburrow et al., 1990; Kokini et al., 1994). Not only increased temperature, but also 78
mechanical shear upon mixing plays a role in the loss of sodium dodecyl sulphate (SDS) 79
extractability of gluten proteins during analysis. Mixing favours protein reactivity, thereby 80
lowering the energy of activation for protein solubility loss (Redl et al., 2003). Cooling 81
favours the formation and retention of existing low energy interactions (Apichartsrangkoon, 82
1998; Hargreaves et al., 1995). 83
Heat treatment of wheat gluten protein and the resulting changes in rheological properties 84
are of considerable importance for the characteristics of baked products and offer 85
interesting features for non food applications. To increase our insight into the behaviour of 86
gluten proteins during hydrothermal treatment, the Rapid Visco Analyser was used as a 87
means to apply a temperature profile and simultaneously measure rheological changes. The 88
extractability of the component gluten proteins during different temperature stages was 89
analyzed with size-exclusion (SE)- and reversed-phase (RP)- high performance liquid 90
chromatography (HPLC). 91
2. Experimental
94
2.1. Materials 95
Commercial wheat gluten [moisture content: 6.16%, crude protein content (N x 5.7): 78.9% 96
on dry basis (db), starch content: 10.4% db] was from Amylum (Aalst, Belgium). 97
A gliadin and a glutenin enriched fraction were prepared from this commercial wheat 98
gluten. Gluten (20.0 g) was extracted twice with 60% (v/v) ethanol (250 ml) (gliadin 99
fraction) and once with deionised water (250 ml). After centrifugation (10 min, 10,000 g), 100
the residue (glutenin enriched fraction) was freeze-dried and ground in a laboratory mill 101
(IKA, Staufen, Germany). To remove ethanol the supernatant was dialysed (nine changes, 102
72 h) against 1 mM acetic acid, to conserve gluten functionality (Skerrit et al., 1996), and 103
freeze-dried. Gliadin (crude protein content: 82.9% db), the glutenin enriched fraction 104
(crude protein content: 67.9% db, gliadin content: 17.8% on protein basis) and respectively 105
1/4, 2/3 and 1/1 (w/w) mixtures of the two fractions were used for RVA analysis. 106
All reagents were of analytical grade. 107
108
2.2. Controlled heating and cooling 109
The Rapid Visco Analyser (RVA-4D, Newport Scientific, Sydney, Australia) was used to 110
apply temperature profiles to 25.00 g of 20% (w/v) suspensions containing control gluten 111
or gluten mixtures with different gliadin to glutenin ratios. Suspensions were hand-shaken 112
and mixed (900 rpm for 20 s) at the start of the RVA analysis to obtain a homogeneous 113
suspension. The temperature profile included a temperature increase from room 114
temperature to 40 °C (in 1 min), a linear temperature increase to 95 °C, 90 °C or 80 °C at 115
step (7 min) with a linear temperature decrease to 50 °C, and a final holding step at 50 °C 117
(13 min). The RVA system converts the current required to maintain constant mixing speed 118
(160 rpm) of a paddle into a viscosity value in Poise (P; 0.1 kg m-1 s-1), the unit of dynamic 119
viscosity. This viscosity value is further referred as RVA viscosity. The RVA was stopped 120
at different points in the heating, holding and cooling phases of the profile and the gluten 121
suspensions were frozen in liquid nitrogen, freeze-dried and ground in a laboratory mill 122
(IKA, Staufen, Germany). 123
All RVA analyses were performed at least in triplicate. The standard deviations calculated 124
from the initial viscosities, the minimal viscosities and the maximal viscosities were less 125
phosphate buffer (pH 6.8) containing 2.0% sodium dodecyl sulphate (SDS) and loaded (60 131
µl) on a Biosep-SEC-S4000 column (Phenomenex, Torrance, United States). The elution 132
solvent was (1:1, v/v) acetonitrile (ACN)/water containing 0.05% (v/v) trifluoroacetic acid 133
(TFA). The flow rate was 1.0 ml/min at a temperature of 30 °C (Veraverbeke et al., 2000) 134
and eluted protein was detected at 214 nm. 135
The elution profiles were divided into two fractions using the lowest absorbance reading 136
between the two peaks as the cutoff point. The first fraction corresponds to the amount of 137
SDS extractable glutenin, the second can be assigned to the amount of SDS extractable 138
areas and expressed as percentage of the peak area of unheated gluten extracted with the 140
SDS buffer in the presence of 1.0% dithiotreitol (DTT). 141
column (Machery-Nagel, Düren Germany). The elution system consisted of deionised 148
water + 0.1% (v/v) TFA (A) and ACN + 0.1% TFA (v/v) (B). Proteins were eluted with a 149
linear gradient from 24% B to 56% B in 50 min and detected at 214 nm. 150
α-Gliadin, γ-gliadin, ω-gliadin, B/C-LMW-GS, D-LMW-GS and HMW-GS were 151
distinguished based on absorbance minima between specific peaks as outlined earlier by 152
Wieser et al. (1998). 153
154
2.5. Protein content determination 155
Protein contents were determined using an adaptation of the AOAC Official Dumas 156
Method to an automated Dumas protein analysis system (EAS variomax N/CN, Elt, Gouda, 157
The Netherlands) (AOAC, 1995). 158
159
2.6. Free sulphydryl (SH) determination 160
Free SH groups were determined colorimetrically after reaction with 5.5’ -dithio-bis(2-161
0.05 M sodium phosphate buffer (pH 6.5) containing 2.0% (v/v) SDS, 3.0 M urea and 1.0 163
mM tetrasodium ethylenediamine tetra acetate. DTNB reagent (0.1% w/v in sample buffer, 164
100 µl) was mixed with 1.0 ml sample and the extinction at 412 nm was determined 45 min 165
after centrifugation (3 min, 11 000 g). Absorbance values were converted to amounts of 166
free sulphydryl using a calibration curve with reduced glutathione (Veraverbeke et al., 167
2000). 168
169
3. Results and Discussion
170
3.1. The effect of heating and cooling 171
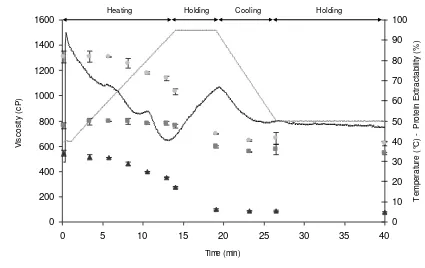
Gluten suspensions showed a substantial RVA viscosity (1300-1500 cP) which decreased 172
when the temperature was raised to 90 °C (Fig. 1). In the holding step (95 °C), the RVA 173
viscosity steadily increased. During cooling, the RVA viscosity decreased again and, in the 174
final holding step at 50 °C, no viscosity changes were observed. In this thermal process, the 175
extractable glutenin and gliadin (Fig. 1). The decrease in RVA viscosity in the heating step 179
was mainly due to the rise in temperature, because shearing at room temperature caused 180
only a small decrease of RVA viscosity (results not shown). The decrease of RVA viscosity 181
can be ascribed to changes in physico-chemical properties of the gluten proteins such as 182
conformational changes (Guerrieri et al., 1996, Weegels et al., 1994) and a loss of hydrogen 183
bonds which readily break on heating (Apichartsrangkoon, 1998). The decrease in 184
suggest formation of protein aggregates of increased molecular size impacting the rotation 186
of the RVA paddle. The sudden decrease in apparent viscosity during cooling was due to 187
the protein aggregates associating tightly and sticking to the paddle. 188
Fig. 2 shows the amounts of the different gliadin types and glutenin subunits during heating 189
and cooling in the RVA. Between 70 and 95 °C, the extractabilities of α- and γ-gliadins 190
decreased slightly, while that of ω-gliadins remained constant (Fig. 2a). The most drastic 191
the cooling step, the amounts of extractable α- and γ-gliadin decreased further. At the end 195
of the thermal process, the extractability of ω-gliadins (76%) was reduced less than that of 196
unextractable in 60% ethanol after heat treatment, became extractable in the glutenin 200
fraction. This resulted in an apparent increased proportion of B/C-LMW-GS (84% increase) 201
after holding 5 min at 95 °C (Fig. 2b), but there was also an apparent increase in D-LMW-202
GS and HMW-GS fraction (23% and 26% respectively) (Fig. 2b). The sum of the gliadins 203
and glutenins remained constant during heating, holding and cooling. 204
205
3.2. The effect of holding time and temperature 206
Heating and cooling gluten suspensions had a strong impact on RVA viscosity and protein 207
decreased in the cooling phase. To further examine these observations, the time of holding 209
and the holding temperature were varied and evaluated in terms of their impact on RVA 210
viscosity and protein extractability. 211
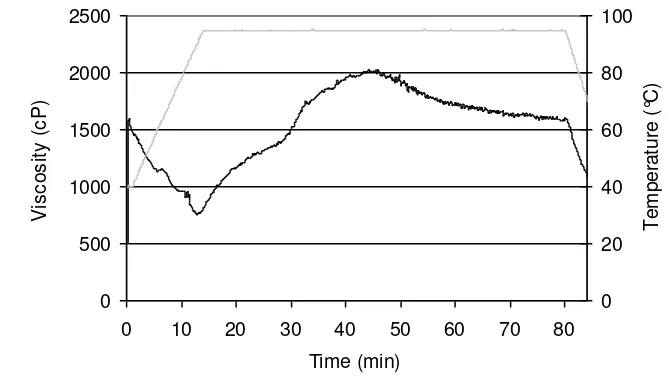
On extending the holding phase the RVA viscosity reached a maximum after 35 min at 95 212
°C. Longer holding times at 95 °C resulted in a slow viscosity decrease (Fig. 3). Large 213
protein aggregates were formed which initially increased the RVA viscosity. Due to the 214
constant mixing the protein aggregates oriented themselves in the stirring direction. This 215
shear thinning effect was reflected in a slow viscosity decrease after 35 min at 95 °C. This 216
effect has also been described for starch-water suspensions where alignment of the soluble 217
starch molecules during holding leads to a decrease in viscosity (Hoseney, 1994). 218
Subsequently cooling caused a strong viscosity decrease. Cooling favoured association of 219
the protein aggregates and, as indicated earlier, led them to stick to the paddle causing the 220
abrupt viscosity decrease. 221
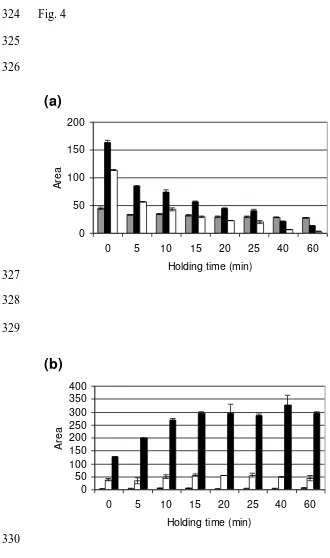
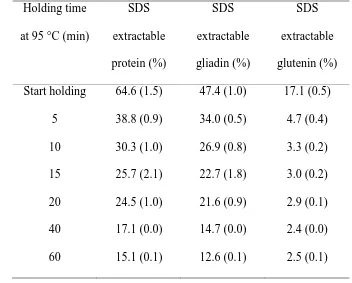
Holding at 95 °C for 60 min decreased the amount of SDS extractable protein (Table 1). 222
The holding step had a strong impact on gliadin extractability. Holding gluten for 15 min at 223
95 °C reduced the SDS extractability of gliadin by more than 50% and a holding time of 40 224
min led to a reduction of gliadin extractability by 70% (Table 1). Most of the glutenin 225
became unextractable during heating and the first 5 min of holding at 95 °C. 226
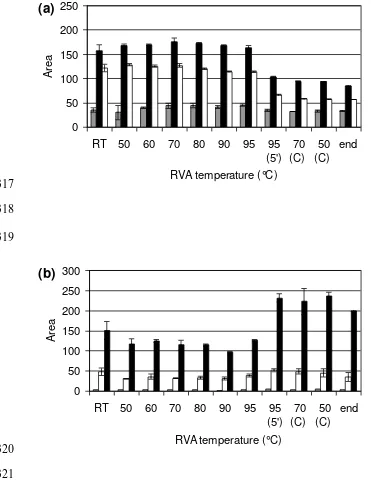
In the holding step at 95 °C, the amount of 60% ethanol extractable gliadin decreased (Fig. 227
4a). The amount of α-gliadin and γ-gliadin decreased drastically during holding, whereas 228
that of ω-gliadin remained quite constant even at longer holding times (Fig. 4a). After one 229
hour the amount of α-gliadins strongly decreased, γ-gliadins became nearly unextractable 230
amount of reduced glutenin increased with longer holding times (Fig. 4b) reaching a 232
maximum amount after 15 min. The total amount of extractable protein (gliadin + glutenin) 233
lowered when holding gluten at 95 °C for 15 min or longer. 234
Heating to 90 °C and holding the gluten suspension at this temperature yielded results 235
similar to those following heating and holding at 95 °C. However the viscosity rise was less 236
pronounced (results not shown) and this was reflected in higher protein extractabilities 237
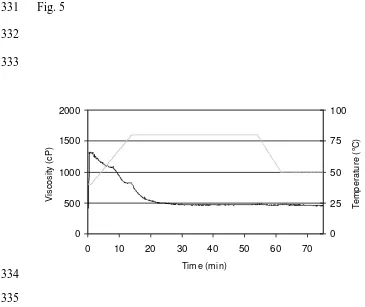
(28.4 % SDS extractable protein after 40 min at 90 °C). Increasing the temperature to 80 °C 238
glutenin SDS extractability (7.4 %) was strongly reduced after heating and holding at 80 °C 242
for 40 min. However these changes were not sufficient to cause a viscosity rise in the RVA. 243
244
3.3. The effect of different amounts of gliadin and glutenin 245
To determine the relative contribution of the gliadin and the glutenin fraction to the overall 246
RVA profile, gluten suspensions with different gliadin to glutenin ratios were analyzed. 247
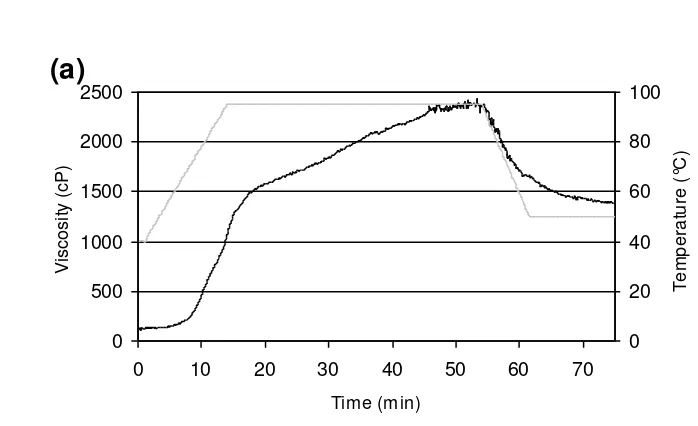
The RVA profile (Fig. 6a) of glutenin enriched wheat gluten (only 17.8% gliadin on a 248
protein basis) had a much lower initial RVA viscosity (160 cP) than the original material 249
with 55.9% gliadin (Fig. 6c). Increasing the gliadin to glutenin ratio to the ratio in the 250
control gluten sample resulted in a higher initial viscosity and did not markedly change the 251
viscosity at the end of the holding phase and during cooling. Higher gliadin to glutenin 252
ratios led to a less pronounced viscosity increase during the first 15 min of holding. Gluten 253
viscosity (Table 2) and a smaller viscosity increase during holding (results not shown). This 255
shows that both gliadin and glutenin contributed to the measured initial viscosity and the 256
viscosity during holding at 95 °C. 257
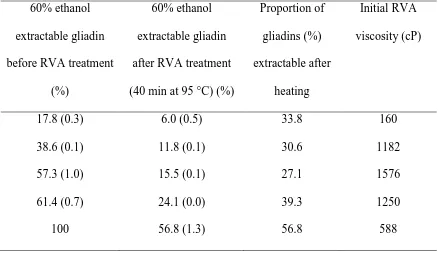
The amount of gliadin (extractable in 60% ethanol) after heating and holding at 95 °C for 258
40 min depended on the gliadin content of the wheat gluten (Table 2). The extractability of 259
reconstituted gluten with low and high amounts of gliadin after heating (40 min at 95 °C) 260
was higher than that of reconstituted gluten with a gliadin amount comparable to that of 261
unheated commercial wheat gluten (55.9%). 262
263
3.4. Determination of free SH-content during RVA analysis 264
Up to 70 °C, the free SH-content of wheat gluten remained constant. Between 70 °C and 80 265
°C a significant drop in the amount of free SH-groups occurred (Fig. 7). Simultaneously, 266
SDS extractability of glutenin (Fig. 1) decreased, indicating cross linking of glutenin 267
through disulphide bonding. The free SH-content then remained constant until the start of 268
the holding step at 95 °C. This indicated a further association of glutenin through 269
sulphydryl/disulphide interchange reactions, leading to larger protein aggregates reflected 270
in a lower SDS extractability (Fig. 1). A second drop in free SH-content occurred after 5 271
min holding at 95 °C, and was accompanied by a sharp decrease in gliadin SDS 272
extractability and a further decrease in glutenin extractability in SDS (Fig. 1). This led to 273
the proposal that gliadin crosslinks with glutenin through formation of disulphide bonds. 274
With longer holding times the free SH-content remained constant, although a further 275
decrease of gliadin extractability was observed during holding at 95 °C. Addition of the 276
resulted in an RVA profile with no viscosity increase in the heating and holding phase (Fig. 278
8). This provides further evidence for the importance of thiol groups in the changes of RVA 279
viscosity when holding gluten suspensions at temperatures of at least 60 °C. 280
4. Conclusions
282
The RVA system can be used to thermally treat wheat gluten suspensions under different 283
conditions and to monitor changes during heating and cooling. Increasing the temperature 284
up to 95 °C affected mainly glutenin. When holding the suspension at such temperature, 285
both gliadin and glutenin became less extractable and the RVA viscosity increased, 286
probably due to the formation of large protein aggregates. 287
A large reduction in α- and γ-gliadin extractabilities and a simultaneous increase in the 288
apparent amounts of reduced glutenin, suggested formation of gliadin-glutenin disulphide 289
bond cross-linking in the process. γ-Gliadins were more affected after heating than α -290
gliadins. The gliadins that were ethanol unextractable after heating, became extractable 291
after reduction and eluted in the B/C-LMW-glutenin fraction. 292
Both the time and temperature of the holding phase affected RVA viscosity and protein 293
extractability. Longer holding times at and above 90 °C increased the RVA viscosity. At 294
the same time the extractability of gliadin, mainly α- and γ-gliadin and to a lesser extent ω -295
gliadin, and glutenin decreased. Holding at 80 °C did not increase the RVA viscosity, 296
although glutenin extractability decreased. 297
Gliadin and glutenin were both responsible for the initial viscosity in the RVA profile. The 298
formation of glutenin polymers with the incorporation of gliadin through disulphide bonds 299
caused a viscosity rise in the RVA profile. 300
Acknowledgements
302
The authors would like to thank Dr. H. Wieser, Dr. P. Köhler, Dr. R. Kieffer (DFA 303
lebensmittelchemie, Garching, Germany) and Dr. R.C. Hoseney (R&R Research Services 304
Inc, Manhattan, Kansas, USA) for fruitful discussions. Financial support was obtained from 305
the Institute for the Promotion of Innovation through Science and Technology in Flanders 306
(IWT-Vlaanderen, Brussels, Belgium). 307
Fig.s
Fig. 3 322
0 500 1000 1500 2000 2500
0 10 20 30 40 50 60 70 80
Time (min)
V
is
c
o
s
it
y
(
c
P
)
0 20 40 60 80 100
T
e
m
p
e
ra
tu
re
(
°C
)
Fig. 4 324
325 326
(a)
0 50 100 150 200
0 5 10 15 20 25 40 60
Holding time (min)
A
re
a
327 328 329
(b)
0 50 100 150 200 250 300 350 400
0 5 10 15 20 25 40 60
Holding time (min)
A
re
a
Fig. 5 331
332 333
0 500 1000 1500 2000
0 10 20 30 40 50 60 70
Time (min)
Vi
sco
si
ty
(cP)
0 25 50 75 100
T
e
mp
e
ra
tu
re
(°
C
)
Fig. 6 337
338
(a)
0 500 1000 1500 2000 2500
0 10 20 30 40 50 60 70
Time (min)
Vi
sco
si
ty
(cP)
0 20 40 60 80 100
T
e
mp
e
ra
tu
re
(°
C
)
Fig. 7 342
343
0.0 2.0 4.0 6.0 8.0 10.0
RT 50 60 70 80 90 95
95 (5 ')
95 (1 0')
95 (2 0')
95 ( 25')
95 (4 0')
95 (6 0')
RVA temperature
µ
m
o
l
S
H
/g
p
ro
te
in
Fig. captions
(w/v) DTT after heating and cooling in the RVA at different temperatures, including room 356
temperature (RT). Fig. 2a shows the gliadin fraction with ω-gliadin (grey), α-gliadin (black) 357
and γ-gliadin (white). Fig. 2b shows the reduced glutenin fraction with the apparent 358
amounts of D-LMW-GS (grey), HMW-GS (white) and B/C-LMW-GS (black); (5’, holding 359
time; C, cooling). 360
Fig. 3. RVA viscosity of wheat gluten-water suspension with 60 min holding time (HT) at 361
95 °C. ( ) RVA viscosity, ( ) temperature. 362
Fig. 4. Areas in RP-HPLC chromatogram representing gluten extractability at different HT 363
at 95 °C in the RVA. Fig. 4a shows the gliadin fraction with ω-gliadin (grey), α-gliadin 364
(black) and γ-gliadin (white). Fig. 4b shows the reduced glutenin fraction with of D-LMW-365
GS (grey), HMW-GS (white) and B/C-LMW-GS (black). 0 min HT represents 366
extractability at the start of the holding phase. 367
Fig. 5. RVA viscosity of wheat gluten-water suspension with 40 min HT at 80 °C. ( ) 368
Fig. 6. RVA profiles (40 min HT at 95 °C) of reconstituted gluten fractions with (a) 17.8% 370
gliadin, (b) 38.6% gliadin and (c) a control gluten fraction with 55.9 % gliadin. ( ) RVA 371
viscosity, ( ) temperature. 372
Fig. 7. Changes in free SH-content during RVA analysis (60 min at 95 °C) as determined 373
by the reaction with DTNB in 2% (w/v) SDS, 3.0 M urea, 1.0 mM EDTA, 0.05 M 374
NaH2PO3. 375
Fig. 8. RVA viscosity of wheat gluten-water suspension with 40 min HT at 95 °C. A: 376
Control; B: In 0.02 M N-ethylmaleimide. ( ) RVA viscosity, ( ) temperature. 377
Tables
379
Table 1. 2% SDS extractability, calculated from SE-HPLC, of gluten proteins with HT up 380
to 60 min at 95 °C. Standard deviations are given between brackets. 381
Holding time at 95 °C (min)
SDS extractable protein (%)
SDS extractable gliadin (%)
SDS extractable glutenin (%) Start holding 64.6 (1.5) 47.4 (1.0) 17.1 (0.5)
5 38.8 (0.9) 34.0 (0.5) 4.7 (0.4)
10 30.3 (1.0) 26.9 (0.8) 3.3 (0.2)
15 25.7 (2.1) 22.7 (1.8) 3.0 (0.2)
20 24.5 (1.0) 21.6 (0.9) 2.9 (0.1)
40 17.1 (0.0) 14.7 (0.0) 2.4 (0.0)
Table 2. Ethanol extractability of wheat gluten with a different gliadin content before and 383
after heat treatment (40 min at 95 °C) with indication of the initial RVA viscosity of the 384
gluten suspension. Standard deviations are given between brackets. 385
60% ethanol extractable gliadin before RVA treatment
(%)
60% ethanol extractable gliadin after RVA treatment (40 min at 95 °C) (%)
Proportion of gliadins (%) extractable after
heating
Initial RVA viscosity (cP)
17.8 (0.3) 6.0 (0.5) 33.8 160
38.6 (0.1) 11.8 (0.1) 30.6 1182
57.3 (1.0) 15.5 (0.1) 27.1 1576
61.4 (0.7) 24.1 (0.0) 39.3 1250
100 56.8 (1.3) 56.8 588
References
389
AOAC, 1995. Official methods of Analysis, 16th edition. Method 990.03. Association of 390
Official Analytical Chemists: Washington D.C.. 391
Apichartsrangkoon, A., Ledward, D.A., Bell, A.E., Brennan, J.G., 1998. Physico-chemical 392
properties of high pressure treated wheat gluten. Food Chemistry 63, 215-220. 393
Attenburrow, G., Barnes, D.J., Davies, A.P., Ingman, S.J., 1990. Rheological properties of 394
wheat gluten. Journal of Cereal Science 12, 1-14. 395
Booth, M.R., Bottomly, R.C., Ellis, J.R.S., Malloch, G., Schofield J.D., Timms, M.F., 396
1980. The effect of heat on gluten-physico-chemical properties and baking quality. Annales 397
de Technologie Agricole 1, 399-408. 398
Guerrieri, N., Alberti, E., Lavelli, V., Cerletti, P., 1996. Use of spectroscopic and 399
fluorescence techniques to assess heat-induced molecular modifications of gluten. Cereal 400
Chemistry 73, 368-374. 401
Hargreaves, J., Popineau, Y., Le Meste, M., Hemminga, M.A., 1995. Molecular flexibility 402
in wheat gluten proteins submitted to heating, FEBS Letters 372, 103-107. 403
Hoseney, R.C. 1994. Starch, in: Hoseney, R.C., (Ed.), Principles of Cereal Science and 404
Technology. American Association of Cereal Chemists, Inc., St. Paul, pp. 29-64. 405
Kokini, J.L., Cocero, A.M., Madeka H., de Graaf, E., 1994. The development of state 406
diagrams for cereal proteins. Trends in Food Science and Technology 5, 281-288. 407
Morel, M.-H., Redl, A., Guilbert, S., 2002. Mechanism of heat and shear mediated 408
Redl, A., Morel, M.-H., Bonicel, J., Vergnes, B. Guilbert, S., 1999. Extrusion of wheat 410
gluten plasticized with glycerol: Influence of process conditions on flow behavior, 411
rheological properties, and molecular size distribution. Cereal Chemistry 76, 361-370. 412
Redl, A., Guilbert, S., Morel, M.-H., 2003. Heat and shear mediated polymerisation of 413
plasticized wheat gluten protein upon mixing, Journal of Cereal Science 38, 105-114. 414
Schofield, J.D., Bottomley, R.C., Timms, M.F., Booth, M.R., 1983. The effect of heat on 415
wheat gluten and the involvement of sulphydryl-disulphide interchange reactions. Journal 416
of Cereal Science 1, 241-253. 417
Singh, H. and MacRitchie F., 2004. Changes in proteins induced by heating gluten 418
dispersions at high temperature. Journal of Cereal Science 39, 297-301. 419
Skerrit, J.H., Bekes, F., Murray, D., 1996. Isolation treatments and effects of gliadin and 420
glutenin fractions on dough mixing properties. Cereal Chemistry 73, 644-649. 421
Veraverbeke, W.S., Larroque, O.R., Bekes, F., Delcour, J.A., 2000. In vitro polymerization 422
of wheat glutenin subunits with inorganic oxidizing agents. I. Comparison of single-step 423
and stepwise oxidations of high molecular weight glutenin subunits. Cereal Chemistry 77, 424
582-588. 425
Veraverbeke, W.S. and Delcour, J.A., 2002. Wheat protein composition and properties of 426
wheat glutenin in relation to breadmaking functionality. Critical Reviews in Food Science 427
and Nutrition 42, 179-208. 428
Weegels, P.L., de Groot, A.M.G., Verhoek, J.A., Hamer, R.J., 1994. Effects on gluten of 429
heating at different moisture contents. II. Changes in physico-chemical properties and 430
Wieser, H., 1998. Investigations on the extractability of gluten proteins from wheat bread in 432
comparison with flour. Zeitschrift für Lebensmittel-Untersuchung und -Forschung 207, 433
128-132. 434
Wieser, H., Antes, S. and Seilmeier, W., 1998. Quantitative determination of gluten protein 435
types in wheat flour by reversed-phase high-performance liquid chromatography. Cereal 436