Impact of Soil Texture on the Distribution of Soil Organic Matter in
Physical and Chemical Fractions
Alain F. Plante,* Richard T. Conant, Catherine E. Stewart, Keith Paustian, and Johan Six
ABSTRACT
Previous research on the protection of soil organic C from decom-position suggests that soil texture affects soil C stocks. However, dif-ferent pools of soil organic matter (SOM) might be difdif-ferently related to soil texture. Our objective was to examine how soil texture differ-entially alters the distribution of organic C within physically and chemi-cally defined pools of unprotected and protected SOM. We collected samples from two soil texture gradients where other variables influ-encing soil organic C content were held constant. One texture gradient (16–60% clay) was located near Stewart Valley, Saskatchewan, Canada and the other (25–50% clay) near Cygnet, OH. Soils were physically fractionated into coarse- and fine-particulate organic matter (POM), and clay-sized particles within microaggregates, and easily dispersed silt-and clay-sized particles outside of microaggregates. Whole-soil organic C concentration was positively related to silt plus clay content at both sites. We found no relationship between soil texture and unprotected C (coarse- and fine-POM C). Biochemically protected C (nonhydrolyz-able C) increased with increasing clay content in whole-soil samples, but the proportion of nonhydrolyzable C within silt- and clay-sized fractions was unchanged. As the amount of silt or clay increased, the amount of C stabilized within easily dispersed and microaggregate-associated silt or clay fractions decreased. Our results suggest that for a given level of C inputs, the relationship between mineral surface area and soil organic matter varies with soil texture for physically and biochemically protected C fractions. Because soil texture acts directly and indirectly on various protection mechanisms, it may not be a uni-versal predictor of whole-soil C content.
S
OIL ORGANIC MATTERcan be protected fromdecom-position and stabilized in soils by different mechan-isms, including chemical protection by association with mineral surfaces, physical protection by occlusion within aggregates, and biochemical protection by recalcitrance (Jastrow and Miller, 1997; Six et al., 2002; Krull et al., 2003). Chemical stabilization of organic molecules through mineral-organic matter binding is well established (Ladd et al., 1985; Gonzalez and Laird, 2003). Even labile organic material that would otherwise decompose quickly can be protected from decomposition by close association with silt and clay particles (Sørensen, 1972). Analyses synthe-sizing multiple studies suggest that stabilization capacity is dictated by soil silt and clay content and the surface area and reactivity of mineral soil particles (Hassink, 1997; Kiem et al., 2002; Kiem and Ko¨gel-Knabner, 2002;
Six et al., 2002). Several studies have shown that soil tex-ture influences aggregation (Kemper and Koch, 1966; Chaney and Swift, 1984; Schlecht-Pietsch et al., 1994) such that increased clay contents were associated with in-creased aggregation or aggregate stability. In increasing soil aggregation, soil clay content indirectly affects soil C storage by occluding organic materials, making them inaccessible to degrading organisms and their enzymes. Therefore, soil texture (particularly soil clay content) plays direct and indirect roles in chemical and physical protec-tion mechanisms.
Unprotected soil C is not intimately associated with soil mineral particles and is not occluded within aggre-gates. Unprotected soil C can be defined operationally as free particulate organic matter (POM), which includes rapidly metabolized plant and associated microbial car-bohydrates and more recalcitrant molecules derived from resistant plant materials and microbial decompo-sition products (Golchin et al., 1994; Six et al., 2001). Biochemically resistant C, defined operationally as or-ganic C resistant to acid hydrolysis (Leavitt et al., 1996), is an average of 1300 to 1500 yr older than whole-soil C (Paul et al., 1997; Paul et al., 2001). Even in the presence of cometabolites, specialized enzymes, and optimum en-vironmental conditions, decomposition of this material is slow, resulting in turnover times on the order of cen-turies to millennia. This pool of organic C is often as-sociated with silt and clay minerals (Paul and Clark, 1989) but is protected from decomposition primarily due to its complex chemical structure rather than by the mineral association.
These observations suggest soil texture affects chemi-cal and physichemi-cal protection of soil C stocks, whereas unprotected C and biochemically protected C should vary largely independent of soil texture. The principle of soil texture altering soil C levels and decomposition kinetics has been integrated into several biogeochemi-cal models (e.g., van Veen and Paul, 1981; Parton et al., 1987) but has not been fully evaluated across a con-trolled soil textural sequence. In addition, the means by which texture alters C dynamics in these models reflect only the conceptual chemical protection and do not en-compass physical protection mechanisms. There is an increasing demand for new models that incorporate measurable fractions rather than conceptual pools (e.g., Christensen, 1996; Arah and Gaunt, 2001), which has been met with varying degrees of success (e.g., Sohi et al., 2001; Skjemstad et al., 2004). The goal of this work
A.F. Plante, R.T. Conant, C.E. Stewart, K. Paustian, and J. Six, Natu-ral Resource Ecology Lab., Colorado State Univ., Fort Collins, CO 80523; K. Paustin, Dep. of Soil and Crop Sciences, Colorado State Univ., Fort Collins, CO 80523; J. Six, Dep. of Plant Sciences, Univ. of California, Davis, CA 95616. Received 23 Nov. 2004. *Corresponding author ([email protected]).
Published in Soil Sci. Soc. Am. J. 70:287–296 (2006). Nutrient Management & Soil & Plant Analysis doi:10.2136/sssaj2004.0363
ªSoil Science Society of America
677 S. Segoe Rd., Madison, WI 53711 USA
was to examine how soil texture alters the distribution of organic C in physically and chemically defined pools of soil organic matter for the long-term goal of parameter-izing the impact of soil texture in a model of soil organic C dynamics based on measurable fractions. While hold-ing C inputs and other factors influenchold-ing soil C turn-over (temperature, precipitation, litter quality, tillage, etc.) reasonably constant, we evaluated the effects of texture on unprotected and protected soil C stocks. The fractionation scheme outlined by Six et al. (2002) aims to isolate pools of organic C based on physical, chemical, and biochemical mechanisms of protection of organic C and was applied to samples from two in situ soil texture gradients. Specifically, soil texture effects on unprotected and physically protected C are evaluated by testing the hypothesis that particulate organic matter content varies largely independent of soil texture. Soil texture effects on chemically protected organic C are evaluated by test-ing the hypothesis that silt- and clay-associated soil C stocks are directly related to silt and clay content. The hypothesis that the proportion of silt- and clay-associated C that is nonhydrolyzable does not vary with soil texture is tested to assess the impact of texture on biochemically protected C.
MATERIALS AND METHODS Sites and Sampling
Two sites were selected where in situ soil texture gradients could be generated by sampling spatially while keeping all other variables constant. The soils of the Saskatchewan site developed under native grasslands, whereas the soils at the Ohio site developed under native forest. Both sites have been under long-term agricultural production, and each consists of a small localized area with reasonably consistent parent mate-rials, topography, and climate but with significant variability in soil texture. Land management, including tillage type, tillage frequency, tillage timing, and cropping histories, were similar within each area. Analysis of crop yield and aboveground bio-mass data from the Saskatchewan gradient (McConkey and Brandt, personal communication) showed only minor differ-ences between textures and that interannual variability was greater than the variability across textures. We therefore as-sumed that crop yields and soil organic C inputs were rea-sonably constant within each gradient. The result of the site selection is that the dominant factor influencing soil C turn-over is soil texture.
Saskatchewan
Soil samples were collected in April 2002 from six farm fields located near Stewart Valley, Saskatchewan, Canada (508179N; 1078489 W). All sites were within 20 km of each other and were conventionally tilled under long-term (901 years) cereal-pulse crop rotation including fallow periods (usually wheat [Triticum aestivum], fallow, and fieldpea [Pisum sativum]). Soils in the area are classified as Aridic Borolls (Septre, Fox Valley, Birsay Haverville, and Birsay Hatton series). Clay mineralogy in this area is dominated by mont-morillonite, with some kaolinite and illite (Brierley et al., 1996). With the assistance of staff from Agriculture & Agri-Food Canada, we used soil survey maps and hand texturing in the field to select six locations stratified across a soil texture gradient that represented the treatment levels (i.e., textures).
Within each of the six treatment locations, three transects were sampled and treated as replicates. Six surface soil (0–20 cm) cores were collected for each replicate and separated into 0–5 cm and 5–20 cm subsamples in the field. Due to soil compaction of two clayey textures when using a Giddings soil probe, we hand-dug pits and sampled the soil horizontally at the two depths. Only the surface (0–5 cm) subsamples were further analyzed because these samples were expected to demonstrate the largest differences in organic matter protection due to physical pro-tection because of increased wet-dry and free-thaw cycles at the soil surface.
Ohio
A second textural gradient was sampled in October 2002 from within a single 400-ha field near Cygnet, OH, located approximately 15 km SW of the Ohio Agricultural Research and Development Center’s Northwest Agricultural Research Station near Hoytville, OH (41809N; 84809W). The soils of the field consisted of Mollic and Aeric Epiaqualfs (Hoytville and Napanee series), all managed under a corn (Zea mays), soy-bean (Glycine max), oat (Avena sativa) rotation with conven-tional tillage for the last 20 yr. Clay minerals in these soils are dominated by illites (Collins et al., 2000). Similar to the Saskatchewan site, soil survey maps and hand texturing were used to identify four locations within a single farmer’s field, which represented the treatment levels (i.e., soil textures). Three transects within each of the treatment levels were sam-pled and treated as replicates. Seven surface soil (0–20 cm) cores were collected from each replicate sample and separated into 0- to 5- and 5- to 20-cm subsamples in the field. Only the surface samples were further analyzed; the subsurface samples were archived.
Soil Textural Analysis
Once returned to the laboratory, individual soil core sam-ples were weighed and subsampled for moisture content, and bulk density was determined using the core volume. The six to seven individual cores for each replicate were composited to form the replicate sample. The field-moist soil samples were passed through an 8-mm sieve by gently breaking apart the soil. The samples were air-dried, sieved to 2 mm, and stored at room temperature.
Soil texture was determined using a modified version of the standard hydrometer method without removal of carbonates or organic matter (Gee and Bauder, 1986). Briefly, 30 g of air-dry, 2-mm sieved soil were shaken for 16 h in a 250-mL Nalgene bottle with 100 mL of 5 mg L21sodium
hexameta-phosphate and 10 glass beads (10 mm in diameter). Soil clay contents were determined using hydrometer readings taken at 1.5 and 24 h and appropriate interpolation calculations. Coarse and fine sand contents were determined by pouring and wash-ing the suspension over 250-mm and 53-mm sieves after the sedimentation was completed. Materials retained on the sieves were oven dried at 608C and weighed. Soil silt contents were determined by difference.
Soil Physical and Chemical Fractionations Microaggregate Isolation
Microaggregates were isolated using a method described by Six et al. (2000a). Briefly, 50 g of air-dried whole soil were submerged in deionized water for 30 min to promote slaking of macroaggregates and poured onto a 250-mm mesh screen inside a cylinder and reciprocally shaken (120 rev min21) with
50 glass beads (10 mm in diameter) until the complete
ruption of all macroaggregates was achieved. Disruption of microaggregates was prevented by a continuous flow of water that immediately flushed the ,250-mm material out of the shaker and onto a 53-mm sieve (Six et al., 2000a). The fraction retained on the 250-mm mesh consisted of coarse (POM and 250–2000mm sand) and comprised the coarse POM fraction (CPOM .250 mm). The materials retained on the 53-mm sieve were wet sieved by hand for 2 min at approximately 50 cycles per minute, and finer materials were gently washed off to isolate stable microaggregates (53–250 mm). The suspension passing the 53-mm sieve was centrifuged to isolate the easily dispersed silt-sized fraction (d-silt, 2–53mm). The supernatant was flocculated using 0.25M MgCl2 and CaCl2
and centrifuged to isolate the easily dispersed clay-sized frac-tion (d-clay,,2mm). Fraction suspensions were oven dried at 608C and weighed. Mass and organic C balances were used to determine the completeness of recovery after the microaggre-gate isolation procedure.
Dispersion of Microaggregates and POM Isolation
Five to six grams of microaggregate (53–250mm) samples, isolated in the previous procedure, were dispersed by shaking for 18 h with 25 mL of 0.5 g mL21sodium hexametaphosphate
and 12 glass beads (4 mm in diameter) in 50-mL centrifuge tubes to isolate fine POM (Cambardella and Elliott, 1992) and microaggregate-derived mineral fractions. After shaking, the suspension was poured over a 53-mm sieve and washed thoroughly to isolate the fine POM fraction (fPOM, 53–250mm), which includes fine sand and fine POM that was originally out-side the microaggregates and the occluded POM that is released on dispersion of the microaggregates. The suspension that passed the 53-mm sieve was centrifuged as described previously to isolate the microaggregate-derived silt- and clay-sized frac-tions (magg-silt and magg-clay). Fractions were subsequently oven dried at 608C and weighed. Mass and organic C balances of the POM isolation procedure were used to determine the completeness of recovery.
The microaggregate-derived fractions were corrected for sand content to determine C concentrations on a true micro-aggregate basis. Fine sand contents (53–250mm) of the sam-ples determined during particle-size analysis were subtracted from the mass of the microaggregate fractions determined during the first isolation procedure. The organic C concentra-tions of the fine POM and microaggregate-derived silt- and clay-sized fractions could then be expressed on a sand-free microaggregate basis:
The sand correction was not applied on a whole-soil basis be-cause we were concerned only with the composition of the microaggregates and the distribution of organic C within them as a function of changing soil clay content.
Acid Hydrolysis
Easily dispersed and microaggregate-derived silt- and clay-sized fractions were subjected to acid hydrolysis to isolate a resistant pool of organic C using a modification of the method described in Paul et al. (1997) without the pretreatment for
removal of carbonates. Briefly, 0.5 g of sample was refluxed at 958C for 16 h in 25 mL of 6 M HCl. When insufficient material was recovered during previous fractionation steps, less material (down to 0.3 g) was used or individual repli-cates were combined. After refluxing, the suspension was filtered and washed with deionized water over a glass fiber filter. The residue was then washed from the filter into a specimen cup, oven dried at 608C, and weighed. The propor-tion of nonhydrolyzable C was determined using the follow-ing equation:
which accounts for mass loss during acid hydrolysis and re-covery of residues. Mass loss was found to be minor.
Carbon and Nitrogen Analyses
Total C and N analyses were done on the whole soil and each isolated fraction using a CHN analyzer (model LECO CHN-1000; Leco Corp., St. Joseph, MI). Results of soil carbonate determination by the pressure transducer method (Sherrod et al., 2002) indicated that carbonates were not present (data not shown), and thus total C concentrations can be equated to organic C concentrations.
Statistical Analyses
Linear relationships between the sample mass content of various fractions and the organic C contents within these frac-tions were tested using ordinary least squares linear regression. Linear regression was used in spite of not having an explicit independent variable because we sought only the presence or absence of a relationship and because the error around the X-axis variable was found to be lower than that on the Y-axis variable. The linear relationships were in the formY5 a 1 bX, whereX was whole-soil clay or silt content andYwas the organic C content within various fractions. Data from the Saskatchewan texture gradient in Stewart Valley (SK) and the gradient in Hoytville (OH) were generally analyzed separately. Overall comparisons between the sites or between fractions within a site (all textures combined) were done using Student ttests assuming equal variances and were considered statisti-cally significant atP ,0.05. Differences in the response of organic C contents in various fractions to soil texture were tested using standard ANOVA techniques.
RESULTS
Whole-Soil Texture and Organic
Carbon Concentration
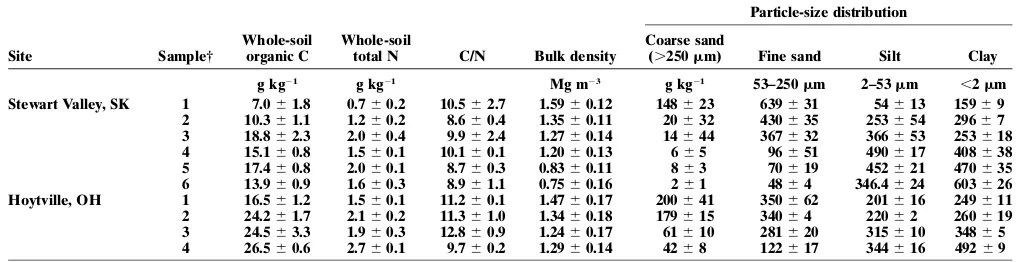
The range of soil textures at the Saskatchewan site was wider than at the Ohio site (Table 1). Soil clay contents in the Saskatchewan texture gradient ranged from 159 to 603 g clay kg21soil and ranged from 249 to 492 g clay kg21
soil at the Ohio site. Whole-soil organic C ranged from 7.0 to 18.8 g C kg21soil at Saskatchewan and from 16.5 to
26.5 g C kg21soil at Ohio (Table 1). The relationship
between soil texture, as represented by whole-soil silt plus clay content, and the total amount of organic C stored within the soils (Fig. 1) was statistically significant
in the Ohio (P5 0.012, r2 5 0.48) and Saskatchewan
(P50.0028,r250.46) texture gradients.
Organic Carbon Concentrations of Physically
Isolated Fractions
Recovery of mass (as CPOM, microaggregates, d-silt, and d-clay) after the microaggregate isolation procedure was 97.961.1% (mean6standard deviation), and total organic C recovery was 96.969.8%. Mass recovery (as fPOM,magg-silt, andmagg-clay) after the POM isolation from microaggregates procedure was 98.861.5%, and organic C recovery was 98.5614.5%. The high variance of C recovery in the POM isolation procedure was due primarily to the high variability in the amount of fPOM obtained, and its organic C concentration was due to interfering sand contents. The two-step physical frac-tionation scheme was successful in isolating noncom-posite pools of organic C (Smith et al., 2002) because C recovery was high and because there was no redundancy
in organic C allocation between the fractions. However, their usefulness as modelable, functional pools can be assessed only when their dynamic behaviors become properly described.
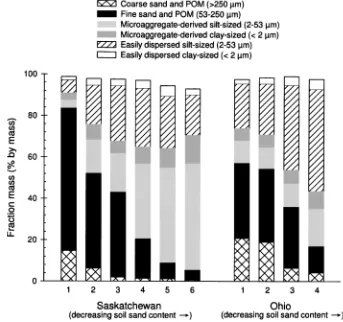
The mass distributions of samples after physical frac-tionation reflect their textural composition (Fig. 2). In general, the proportion of mass associated with the coarse (.250 mm) and fine (53–250 mm) sand plus POM fractions decreases with increasing clay content, whereas the mass of the microaggregate-derived silt increased with increasing clay content in the Saskatch-ewan soils and the mass of the easily dispersed silt-sized fraction increased with increasing clay content in the Ohio soils.
For all textures combined, approximately 76% of the organic C in the fractions was associated with mineral fractions (silt and clay-sized fractions); this was nearly the same at both sites (P 5 0.99) (Fig. 3). Across all textures within the Saskatchewan texture gradient, or-ganic C was greater in the microaggregate-derived silt-Table 1. Bulk soil characteristics of 0–5 cm surface soil samples (mean6SD,n53).
Particle-size distribution
Site Sample†
Whole-soil organic C
Whole-soil
total N C/N Bulk density
Coarse sand
(.250mm) Fine sand Silt Clay
g kg21 g kg21 Mg m23 g kg21 53–250mm 2–53mm ,2mm
Stewart Valley, SK 1 7.061.8 0.760.2 10.562.7 1.5960.12 148623 639631 54613 15969 2 10.361.1 1.260.2 8.660.4 1.3560.11 20632 430635 253654 29667 3 18.862.3 2.060.4 9.962.4 1.2760.14 14644 367632 366653 253618
4 15.160.8 1.560.1 10.160.1 1.2060.13 665 96651 490617 408638
5 17.460.8 2.060.1 8.760.3 0.8360.11 863 70619 452621 470635
6 13.960.9 1.660.3 8.961.1 0.7560.16 261 4864 346.4624 603626
Hoytville, OH 1 16.561.2 1.560.1 11.260.1 1.4760.17 200641 350662 201616 249611 2 24.261.7 2.160.2 11.361.0 1.3460.18 179615 34064 22062 260619 3 24.563.3 1.960.3 12.860.9 1.2460.17 61610 281620 315610 34865
4 26.560.6 2.760.1 9.760.2 1.2960.14 4268 122617 344616 49269
†Samples are ranked in order within sites from highest to lowest whole-soil sand content (lowest to highest silt1clay content).
Fig. 1. Relationships between whole-soil organic C concentration and soil fine fraction (silt1clay) content for the Saskatchewan and Ohio texture gradients.
Reproduced
from
Soil
Science
Society
of
America
Journal.
Published
by
Soil
Science
Society
of
America.
All
copyrights
and clay-sized fractions than in the easily dispersed fractions (49% of the organic C stock versus 27%,P, 0.001), whereas the reverse was true in the Ohio gra-dient (30% versus 47%, P , 0.001). Within the Ohio texture gradient, the proportion of the organic C asso-ciated with microaggregate-derived or easily dispersed mineral fractions did not seem to differ with increasing soil clay content (P 5 0.39 and r2 5 0.075 for
micro-aggregate-derived andP50.068 andr250.29 for easily
dispersed mineral fractions), but significant trends were observed in the Saskatchewan gradient (P,0.001 and r250.79 for microaggregate-derived andP,0.001 and
r250.74 for easily dispersed mineral fractions). As the
soil clay content increased, the proportion of organic C associated with the microaggregate-derived fractions increased from approximately 38 to 65%, with a con-comitant decrease in the easily dispersed mineral frac-tions from 34 to 18%.
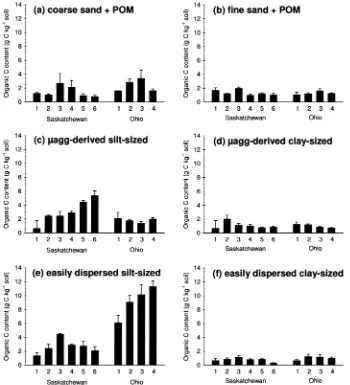
The organic C concentrations of individual isolated fractions showed varying responses to soil texture in the two soils (Fig. 3). In the Saskatchewan texture gradient, statistically significant relationships were found for the fPOM,magg-silt, and magg-clay fractions (three out of six fractions). The magg-silt fraction was the only one with a positive slope, whereas the organic C stocks in the fPOM andmagg-clay fractions decreased with increas-ing whole-soil silt 1 clay content. In the Ohio texture gradient, organic C concentrations decreased in them agg-clay fraction, increased in the d-silt fraction, and showed
no significant trends with increasing soil silt1clay content in the remaining fractions.
After correction for sand particles, the mass of micro-aggregates increased with increasing whole-soil clay con-tent in both texture gradients (P,0.001,r250.93 for
Saskatchewan andP, 0.001,r250.76 for Ohio; data
not shown). Total sand-free microaggregate-associated C decreased with increasing soil clay content in the Saskatchewan soils, whereas no trend was observed in the Ohio soils (Fig. 4). The trend in the Saskatchewan soils is attributable to decreases in fine POM and in the magg-clay associated C.
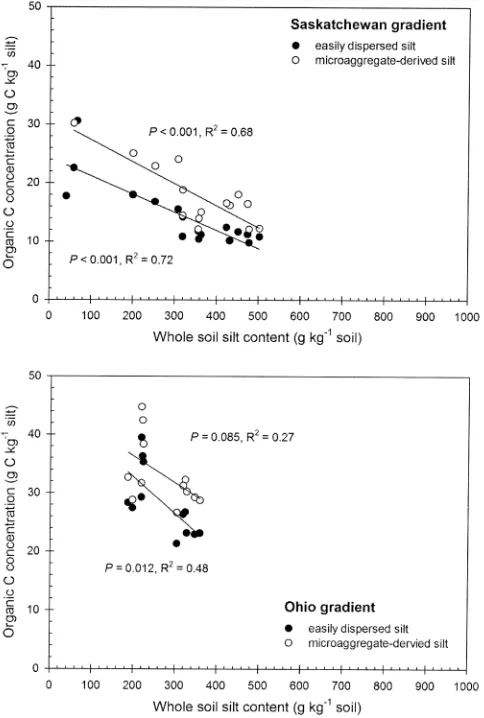
When the organic C concentrations of individual frac-tions are expressed on a per mass of fraction basis rather than on a per mass of soil basis, microaggregate-derived and easily dispersed silt- and clay-sized C concentrations significantly decreased with increasing content of the fraction in the soil (Fig. 5 and 6), although the rela-tionship in themagg-silt fraction from the Ohio gradient was weaker (P50.085,r250.27). When compared with
each other, these trends did not differ between the easily dispersed versus the microaggregate-derived fractions.
Acid Hydrolysis of Physically Isolated Fractions
The proportion of organic C remaining after acid hy-drolysis treatment of whole-soil samples was slightly higher (P 5 0.084) in the Ohio soils than in the Sas-katchewan soil (Table 2). Nonhydrolyzable C increased Fig. 2. Soil mass distribution of physical fractions isolated from soils in the Saskatchewan and Ohio texture gradients. Samples are ranked in orderfrom highest to lowest whole-soil sand content (lowest to highest silt1clay content) within sites.
Reproduced
from
Soil
Science
Society
of
America
Journal.
Published
by
Soil
Science
Society
of
America.
All
copyrights
with increasing whole-soil clay content in both soils (P5 0.007 in the Saskatchewan texture gradient and P 5 0.006 in the Ohio gradient). No relationships between whole-soil clay content and the nonhydrolyzable C of the silt- and clay-sized fractions from either soil were observed, regardless whether the fractions were micro-aggregate derived or easily dispersed. No differences in the proportion of nonhydrolyzable C between easily dispersed and microaggregate-derived fractions were observed for the silt-sized (P50.12) or clay-sized (P5 0.46) fractions of both soils. Overall, the silt-sized fractions had higher proportions of nonhydrolyzable C than the clay-sized fractions (P,0.001).
DISCUSSION
Soil Texture Effects on Whole-Soil
Carbon Concentration
Although the degree of association of SOM with soil mineral surfaces (particularly soil clays) has long been recognized as a mechanism for the stabilization of
or-ganic C, whole-soil clay content is not always a good predictor of whole-soil organic C concentration. The direct evidence for the long-term effect of soil texture on organic C storage is derived primarily from correla-tions in soil databases and is inconsistent. Nichols (1984) found a strong correlation (r50.86) between soil clay content and organic C concentration in the Southern Great Plains. Percival et al. (2000), however, found that soil clay content explained little of the variation in organic C accumulation (r2,0.05) in New Zealand. The
current study showed a significant relationship between soil texture and soil organic C concentration at Ohio and Saskatchewan. The slope of the relation from the Saskatchewan soils was slightly lower than in Ohio, al-though the difference was not statistically significant (P 5 0.27). Lower organic C concentrations and the slightly lower slope in the Saskatchewan gradient are likely due to the lower C input levels in this gradient. Wheat straw plus grain yields in the general vicinity of the Saskatchewan texture gradient average between 1.8 and 5.3 Mg ha21 (Campbell and Zentner, 1993),
Fig. 3. Organic C concentrations of (a) coarse sand and POM, (b) fine sand and POM, (c) derived silt-sized, (d) microaggregate-derived clay-sized, (e) easily dispersed silt-sized, and (f) easily dispersed clay-sized fractions isolated from soils in the Saskatchewan and Ohio texture gradients. Samples are ranked in order from highest to lowest whole-soil sand content (lowest to highest silt1clay content) within sites.
Reproduced
from
Soil
Science
Society
of
America
Journal.
Published
by
Soil
Science
Society
of
America.
All
copyrights
whereas corn grain yields in the area near the Ohio texture gradient average between 6 and 10 Mg ha21
(Dick et al., 1997). These differing crop types and yields result in contrasting organic C inputs to the two gra-dients. These were estimated to be 90 to 140 g C m22yr21
in Saskatchewan and 310 to 420 g C m22yr21in Ohio,
based on crop yield data and formulas relating yields to above- and belowground biomass similar to those
reported by Kong et al. (2005). In the wheat produc-tion system in Saskatchewan, C inputs are relatively low due to low mean annual precipitation and the inclu-sion of fallow periods in the crop rotations. In Ohio, greater mean annual precipitation and continuous corn or corn-soybean rotations result in more C being re-turned to the soil. Therefore, even if there might be an increased capacity for stabilization due to greater soil clay content, the relationship between whole-soil C con-centration and clay content was not fully expressed in the SK gradient because there is little C input available to be stabilized.
Soil Texture Effects on Unprotected and
Physically Protected Carbon
Few researchers have reported on the effect of soil texture on the amount of POM. Although they found no relationship between whole-soil organic C and soil texture in a series of cultivated Cambisols, Ko¨lbl and Ko¨gel-Knabner (2004) found that the amount of organic C present as POM occluded in aggregates increased with increasing soil clay content. In contrast, they found that the amount of organic C present as free POM Fig. 4. Organic C concentrations of (a) fine sand and POM, (b)
microaggregate-derived silt-sized, and (c) microaggregate-derived clay-sized fractions on a sand-free microaggregate mass basis. Samples are ranked in order from highest to lowest whole-soil sand content (lowest to highest silt1clay content) within sites.
Fig. 5. Relationships between organic C concentrations (g C kg21
fraction) in the easily dispersed and microaggregate-derived silt-sized fractions and whole-soil silt contents for the (a) Saskatchewan and (b) Ohio texture gradients.
Reproduced
from
Soil
Science
Society
of
America
Journal.
Published
by
Soil
Science
Society
of
America.
All
copyrights
was not related to clay content. We did not distinguish between free and occluded POM in the current study but separated the total POM based on size. In terms of mass, the coarse (.250mm) and fine (53–250mm) POM fractions decreased with increasing clay content in the Saskatchewan and Ohio soils. This is more likely at-tributable to changes in sand content of the fraction rather than the POM itself. Organic C concentrations in the POM fractions showed no relationship with texture, except the fPOM fraction in the Saskatchewan gradient,
which showed a slight decrease. These results seem to contradict those previously reported in the literature, which generally showed increases in total POM with increasing soil clay content (e.g., Needelman et al., 1999). Our results are consistent with those reported by Franz-luebbers and Arshad (1997), who showed no response in total POM with soil texture. It is likely that a direct causal relationship between soil clay content and POM-associated C does not exist but that the relationship is indirect through the effects of soil clay on aggregation. In the Saskatchewan texture gradient, the combined results of increased microaggregate mass and decreased organic C with increased soil clay content suggest a trend similar to that observed in the silt- and clay-associated organic C. The increased microaggregation diluted the asso-ciated C because the silt- and clay-sized materials com-prising the microaggregates had decreasing organic C concentrations. In addition, our results suggest that with reasonably similar C inputs, increasing microaggregation due to greater soil clay contents across the gradient di-luted the amount of fine POM rather than promoting its increased retention.
Examination of the total clay recovery from the micro-aggregate and POM isolation procedures reveals lower clay contents than those determined in the particle-size analysis. This suggests that dispersion was incomplete during the physical fractionation and that clays are likely to be found in silt-sized microaggregates. Complete dispersion of the soil was not the objective of the physical fractionation but does limit the inferences that can be made concerning organic matter associated with the silt-sized fraction. The microaggregate-derived, silt-silt-sized fraction increased dramatically in weight and C associ-ated with it across the Saskatchewan gradient, whereas in the Ohio gradient the easily dispersed silt-sized fraction increased (Fig. 2). Thus, the structural unit in which C is accumulated seems to differ between the two texture gradients. We suggest that this is related to the overall difference in the range of textures between the two gra-dients; the soil textures at the Ohio site were sandier than at the Saskatchewan sites. In the less sandy soils of Saskatchewan, there was a higher capacity for the forma-tion of stable microaggregates within macroaggregates (Oades, 1984; Six et al., 2000a) than in the coarser soils of OH. Therefore, organic C was preferentially protected in silt-sized aggregates occluded within the microaggre-gates, whereas silt-sized aggremicroaggre-gates, with the associated Fig. 6. Relationships between organic C concentrations (g C kg21
fraction) in the easily dispersed and microaggregate-derived clay-sized fractions and whole-soil clay contents for the (a) Saskatchewan and (b) Ohio texture gradients.
Table 2. The proportion of nonhydrolyzable carbon (%) in various mineral fractions (mean particle-size distribution [g kg21] SD,n53).
Site Sample† Whole-soil
Easily dispersed silt
Microaggregate-derived silt
Easily dispersed clay
Microaggregate-derived clay
Stewart Valley, SK 1 31.762.9 53.563.6 56.2‡ 51.560.8 44.4‡
2 46.161.9 56.465.8 59.064.1 58.7610.2 48.162.7
3 40.564.3 40.565.2 43.262.5 46.8611.2 40.469.4
4 48.960.4 46.963.4 60.060.6 45.8610.7 51.362.8
5 50.266.0 64.463.4 65.165.4 50.364.3 44.262.1
6 46.164.9 58.566.6 51.769.4 44.667.0 50.161.7
Hoytville, OH 1 41.462.0 62.6610.1 62.262.6 42.762.4 64.4621.0
2 43.465.0 52.361.6 60.962.0 46.862.5 50.861.7
3 54.961.9 60.960.4 68.467.8 51.161.0 40.4614.2
4 54.864.7 60.068.7 67.166.5 45.6614.7 54.063.6
†Samples are ranked in order within sites from highest to lowest whole-soil sand content (lowest to highest silt1clay content).
‡n51. Replicates composited because of lack of material recovered during microaggregate POM analysis.
Reproduced
from
Soil
Science
Society
of
America
Journal.
Published
by
Soil
Science
Society
of
America.
All
copyrights
occlusion of C, would form directly outside of microag-gregates at the Ohio site.
Soil Texture Effects on Chemically
Protected Carbon
The most surprising results of the study were those of the silt- and clay-associated soil organic C. Soil texture is often used as a surrogate for surface area and reactivity, particularly when the mineralogy of the clays are similar. The limited surface reactivity of a soil is provided as evi-dence for the potential existence of a limited stabilization capacity (Hassink and Whitmore, 1997; Six et al., 2002). The second hypothesis of this study was that silt- and clay-associated soil C contents would be directly related to whole-soil silt and clay content, such that any increases in total soil C could be attributed to increases in silt and clay contents, which themselves would have similar organic C concentrations. What we found instead were decreasing concentrations of organic C within the silt-and clay-associated fractions silt-and therefore a mixed re-sponse in terms of soil C concentrations. In other words, given reasonably consistent organic C inputs within each site, the silt- and clay-associated organic matter became diluted with greater amounts of silt and clay across the gradients. A soil that has reached its stabilization ca-pacity would have a constant organic C concentration in the silt- and clay-associated fractions, and thus any changes in texture would be reflected in the whole-soil saturation capacity. The soils in the current study seem to be far removed from such a stabilization capacity.
Soil Texture Effects on Biochemically
Protected Carbon
Acid hydrolysis is often proposed as a chemical means of isolating a fraction of biochemically or microbially re-sistant organic matter. We originally hypothesized that the proportion of silt- and clay-associated C that is non-hydrolyzable would not vary with soil texture. Our results supported this hypothesis because no significant differ-ences in proportions of nonhydrolyzable C were found across textures or between the sources (microaggregate-derived versus easily dispersed) of the silt- and clay-sized fractions. Acid hydrolysis is incapable of accounting for physical and chemical protection mechanisms because organic matter sorbed to mineral surfaces from easily dispersed fractions was equally susceptible to acid hydro-lysis compared with those from microaggregate-derived reactions. However, our results showing that organic matter associated with silt-sized fractions was more re-sistant to acid hydrolysis than clay-associated organic matter support reports in the literature (Tiessen and Stewart, 1983; Anderson and Paul, 1984; Christensen and Sorensen, 1985; Six et al., 2000b) that concluded that silt-associated organic matter is the most stable fraction. Therefore, the relative contribution of silt and clay to the soil texture might alter the total amount of nonhydrolyz-able C, and thus the size of the biochemically protected pool does indeed vary with texture. This supports the practice of some models of soil organic matter dynamics to use soil texture to modify the proportion of organic matter
in the stable pool. However, this outcome may be con-founded by the relative amounts of C associated with the silt- and clay-sized fractions.
CONCLUSIONS
We found no significant relationship between soil tex-ture and unprotected (coarse- and fine-POM) organic C. The role of texture in the physical protection of soil C seemed to differ between the Saskatchewan and Ohio texture gradients. In Saskatchewan, a higher capacity to form stable microaggregates resulted in increased or-ganic C in the microaggregate-derived silt-sized fraction with increasing soil silt and clay content. In the Ohio gradient, the easily dispersed silt-sized fraction showed the greater response. Mineral-associated, or chemically protected, organic C was strongly affected by the soil silt and clay contents, as would be expected through the role of surface properties. As the amount of silt or clay in-creased, the concentration of organic C associated with easily dispersed and microaggregate-associated silt or clay fractions decreased. Biochemically protected (non-hydrolyzable) C increased with increasing clay content in whole-soil samples, but the proportion of nonhy-drolyzable C within silt- and clay-sized fractions was unchanged. Our results suggest that soil texture, as rep-resented by soil clay or silt 1 clay content, may not always be a good predictor of whole-soil organic C con-tent. This is likely because soil texture affects organic C storage through direct and indirect mechanisms. For an assumed constant level of C inputs within each of the texture gradients observed, the relationship between mineral surface area, as expressed by soil silt and clay content, and soil organic matter seem to vary according to the mechanisms by which the organic matter is sta-bilized in the soil, whether by predominantly physical, chemical, or biochemical protection.
ACKNOWLEDGMENTS
The authors thank Brian McConkey and Kelsey Brandt from Agriculture & Agri-Food Canada for site assistance in Saskatchewan; Matthew Davis, Frank Thayer, and Nathan David from the Ohio Agricultural Research and Development Center for site assistance in Ohio; and Shane Cochran, Joyce Dickens, Mike Katz, Sarah Moculeski, and Jodi Stevens for laboratory assistance during the soil fractionations. This proj-ect was supported by the Office of Research (BER), U.S. De-partment of Energy Grant no. DE-FG03-00ER62997, and Grant no. DE-FG02-04ER63912.
REFERENCES
Anderson, D.W., and E.A. Paul. 1984. Organo-mineral complexes and their study by radiocarbon dating. Soil Sci. Soc. Am. J. 48:298–301. Arah, J.R.M., and J.L. Gaunt. 2001. Questionable assumptions in the current soil organic matter transformation models. p. 83–89. In R. M. Rees et al. (ed.) Sustainable management of soil organic matter. CABI Publishing, Oxon, UK.
Campbell, C.A., and R.P. Zentner. 1993. Soil organic matter as in-fluenced by crop rotations and fertilization. Soil Sci. Soc. Am. J. 57:1034–1040.
Chaney, K., and R.S. Swift. 1984. The influence of organic matter on aggregate stability in some British soils. J. Soil Sci. 35:223–230. Christensen, B.T. 1996. Matching measurable soil organic matter
frac-tions with conceptual pools in simulation models of carbon turn-over: Revision of model structure. p. 143–159.InD. S. Powlson et al. (ed.) Evaluation of soil organic matter models, Vol. 138. Springer, Berlin, Germany.
Christensen, B.T., and L.H. Sorensen. 1985. The distribution of native and labeled carbon between soil particle size fractions isolated from long-term incubation experiments. J. Soil Sci. 36:219–229. Collins, H.P., E.T. Elliott, K. Paustian, L.C. Bundy, W.A. Dick, D.R.
Huggins, A.J.M. Smucker, and E.A. Paul. 2000. Soil carbon pools and fluxes in long-term corn belt agroecosystems. Soil Biol. Bio-chem. 32:157–168.
Dick, W.A., W.M. Edwards, and E.L. McCoy. 1997. Continuous application of no-tillage to Ohio soils: Changes in crop yields and organic matter-related soil properties. p. 171–182.InE.A. Paul et al. (ed.) Soil organic matter in temperate agroecosystems: Long-term experiments in North America. CRC Press, Boca Raton, FL. Franzluebbers, A.J., and M.A. Arshad. 1997. Particulate organic
car-bon content and potential mineralization as affected by tillage and texture. Soil Sci. Soc. Am. J. 61:1382–1386.
Gee, G.W., and J.W. Bauder. 1986. Particle size analysis. p. 383–411.In A. Klute (ed.) Methods of soil analysis, part 1. Physical and miner-alogical methods, 2nd ed. Agronomy Monograph No. 9, American Society of Agronomy, Madison, WI.
Golchin, A., J.M. Oades, J.O. Skjemstad, and P. Clarke. 1994. Study of free and occluded particulate organic matter in soils by solid-state C-13 CP/MAS NMR-spectroscopy and scanning electron micros-copy. Aust. J. Soil Res. 32:285–309.
Gonzalez, J.M., and D.A. Laird. 2003. Carbon sequestration in clay mineral fractions from C-14-labeled plant residues. Soil Sci. Soc. Am. J. 67:1715–1720.
Hassink, J. 1997. The capacity of soils to preserve organic C and N by their association with clay and silt particles. Plant Soil 191:77–87. Hassink, J., and A.P. Whitmore. 1997. A model of the physical
pro-tection of organic matter in soils. Soil Sci. Soc. Am. J. 61:131–139. Jastrow, J., and R.M. Miller. 1997. Soil aggregate stabilization and
carbon sequestration: Feedbacks through organomineral associa-tions. p. 207–223.InR. Lal et al. (ed.) Soil processes and the carbon cycle. CRC Press, Boca Raton, FL.
Kemper, W.D., and E.J. Koch. 1966. Aggregate stability of soils in Western United States and Canada. U.S. Gov. Print. Office, Washington, DC.
Kiem, R., and I. Ko¨gel-Knabner. 2002. Refractory organic carbon in particle-size fractions of arable soils II: Organic carbon in relation to mineral surface area and iron oxides in fractions,6 mu m. Org. Geochem. 33:1699–1713.
Kiem, R., H. Knicker, and I. Ko¨gel-Knabner. 2002. Refractory organic carbon in particle-size fractions of arable soils I: Distribution of refractory carbon between the size fractions. Org. Geochem. 33: 1683–1697.
Ko¨lbl, A., and I. Ko¨gel-Knabner. 2004. Content and composition of free and occluded particulate organic matter in a differently textured arable Cambisol as revealed by solid-state C-13 NMR spectroscopy. J. Plant Nutr. Soil Sci. Z. Pflanzenernahr. Bodenkd. 167:45–53. Kong, A.Y.Y., J. Six, D.C. Bryant, R.F. Denison, and C. van Kessel.
2005. The relationship between carbon input, aggregation, and soil organic carbon stabilization in sustainable cropping systems. Soil Sci. Soc. Am. J. 69:1078–1085.
Krull, E.S., J.A. Baldock, and J.O. Skjemstad. 2003. Importance of mechanisms and processes of the stabilisation of soil organic matter for modelling carbon turnover. Functional Plant Biology 30:207–222. Ladd, J.N., M. Amato, and J.M. Oades. 1985. Decomposition of plant material in Australian soils. III. Residual organic and microbial biomass C and N from isotope-labelled legume material and soil
organic matter decomposition under field conditions. Aust. J. Soil Res. 23:603–611.
Leavitt, S.W., R.F. Follett, and E.A. Paul. 1996. Estimation of slow-and fast-cycling soil organic carbon pools from 6N HCl hydrolysis. Radiocarbon 38:231–239.
Needelman, B.A., M.M. Wander, G.A. Bollero, C.W. Boast, G.K. Sims, and D.G. Bullock. 1999. Interaction of tillage and soil texture: Biologically active soil organic matter in Illinois. Soil Sci. Soc. Am. J. 63:1326–1334.
Nichols, J.D. 1984. Relation of organic carbon to soil properties and climate in the Southern Great Plains. Soil Sci. Soc. Am. J. 48: 1382–1384.
Oades, J.M. 1984. Soil organic matter and structural stability: Mechan-isms and implications for management. Plant Soil 76:319–337. Parton, W.J., D.S. Schimel, C.V. Cole, and D.S. Ojima. 1987. Analysis of
factors controlling soil organic matter levels in Great-Plains grass-lands. Soil Sci. Soc. Am. J. 51:1173–1179.
Paul, E.A., and F.E. Clark. 1989. Soil microbiology and biochemistry. 2nd ed. Academic Press, New York.
Paul, E.A., H.P. Collins, and S.W. Leavitt. 2001. Dynamics of resistant soil carbon of midwestern agricultural soils measured by naturally occurring C-14 abundance. Geoderma 104:239–256.
Paul, E.A., R.F. Follett, S.W. Leavitt, A. Halvorson, G.A. Peterson, and D.J. Lyon. 1997. Radiocarbon dating for determination of soil organic matter pool sizes and dynamics. Soil Sci. Soc. Am. J. 61: 1058–1067.
Percival, H.J., R.L. Parfitt, and N.A. Scott. 2000. Factors controlling soil carbon levels in New Zealand grasslands: Is clay content im-portant? Soil Sci. Soc. Am. J. 64:1623–1630.
Schlecht-Pietsch, S., U. Wagner, and T.-H. Anderson. 1994. Changes in composition of soil polysaccharides and aggregate stability after carbon amendments to different textured soils. Appl. Soil Ecol. 1: 145–154.
Sherrod, L.A., G. Dunn, G.A. Peterson, and R.L. Kolberg. 2002. Inorganic carbon analysis by modified pressure-calcimeter method. Soil Sci. Soc. Am. J. 66:299–305.
Six, J., E.T. Elliott, and K. Paustian. 2000a. Soil macroaggregate turnover and microaggregate formation: A mechanism for C se-questration under no-tillage agriculture. Soil Biol. Biochem. 32: 2099–2103.
Six, J., R.T. Conant, E.A. Paul, and K. Paustian. 2002. Stabilization mechanisms of soil organic matter: Implications for C-saturation of soils. Plant Soil 241:155–176.
Six, J., R. Merckx, K. Kimpe, K. Paustian, and E.T. Elliott. 2000b. A re-evaluation of the enriched labile soil organic matter fraction. Eur. J. Soil Sci. 51:283–293.
Six, J., G. Guggenberger, K. Paustian, L. Haumaier, E.T. Elliott, and W. Zech. 2001. Sources and composition of soil organic matter fractions between and within soil aggregates. Eur. J. Soil Sci. 52: 607–618.
Skjemstad, J.O., L.R. Spouncer, B. Cowie, and R.S. Swift. 2004. Cali-bration of the Rothamsted organic carbon turnover model (RothC ver. 26.3), using measurable soil organic carbon pools. Aust. J. Soil Res. 42:79–88.
Smith, J.U., P. Smith, R. Monaghan, and J. MacDonald. 2002. When is a measured soil organic matter fraction equivalent to a model pool? Eur. J. Soil Sci. 53:405–416.
Sohi, S.P., N. Mahieu, J.R.M. Arah, D.S. Powlson, B. Madari, and J.L. Gaunt. 2001. A procedure for isolating soil organic matter fractions suitable for modeling. Soil Sci. Soc. Am. J. 65:1121–1128. Sørensen, L.H. 1972. Stabilization of newly formed amino-acid
metabolites in soil by clay minerals. Soil Sci. 114:5–11.
Tiessen, H., and J.W.B. Stewart. 1983. Particle size fractions and their use in studies of soil organic matter. 2. Cultivation effects on or-ganic matter composition in size fractions. Soil Sci. Soc. Am. J. 47: 509–514.
van Veen, J.A., and E.A. Paul. 1981. Organic carbon dynamics in grassland soils. 1. Background information and computer simula-tion. Can. J. Soil Sci. 61:185–201.
![Table 2. The proportion of nonhydrolyzable carbon (%) in various mineral fractions (mean particle-size distribution [g kg21] SD, n 5 3).](https://thumb-ap.123doks.com/thumbv2/123dok/2111338.1608910/8.612.47.294.68.422/table-proportion-nonhydrolyzable-various-mineral-fractions-particle-distribution.webp)
