FIXED INCOME
US: 2- and 10- year UST bond yields moved higher post hawkish Fed comments. The market is now pricing a 70% probability of a rate increase.
Eurozoneinflation again failed to pick up however ECB President Mario Draghi still said details of the bank’s taper programme would be announced on 26thOctober.
The Asian USD bond market, measured by JPM Asia Credit Index, was flat with the return year to date now totaling 5.34%.
Source: Eastspring Investments. Chart data from Thomson Reuters DataStream as at 30 September 2017. For representative indices and acronym details please refer to notes in the appendix.
MONTHLY REVIEW:
A bumpy road at the top
September 2017
EQUITIES
A slightly firmer US dollar was behind the outperformance of developed markets as prospects of tax reform progressed in the US and Fed Reserve policymakers hinted at further rate rises.
Confirmation that the Fed was beginning to reduce its balance sheet also supported the dollar.
Chancellor Merkel was returned in elections in Germany which gave stability to eurozone markets. UK indices underperformed again. Emerging Europe was the worst performing EM region although Russia was strong as crude price rose. Brazil continued its recovery while the Philippines hit record highs. Among the decliners were South Africa, Greece and Turkey.
In Asia, the MSCI Asia Pacific ex Japan index was down 0.3% in September to record its first monthly loss for the year however the performance of individual markets was mixed.
Global stockmarkets were mixed in September with Developed Markets outperforming Emerging Markets for the first time this year largely due to a slightly stronger US$, a drop in commodity prices and a rise in crude oil. Markets also shrugged off geopolitical concerns in North Asia, hurricanes in the US and worries over liquidity tightening with many equity indices reaching all-time highs.
Fig.1. Equity Indices Performance in USD (%)
COMMODITIES
Brent Oil increased 7.5% in September to US$56.8/bbl while West Texas Intermediate rose 7.7% to US$51.7/bbl; both prices are the highest in two years. The strength was down to solid demand figures, an appearance of cohesion among OPEC members on supply issues as well as the hurricanes in the Gulf of Mexico disrupting supply.
Gold fell 3.1% weighed by a stronger US dollar
Iron ore fell 21.4% ending the quarter at US$62/t ahead of China’s National People’s Congress in October.
Source: Eastspring Investments. Chart data from Thomson Reuters DataStream as at 30 September 2017. For representative indices and acronym details please refer to notes in the appendix.
CURRENCIES
The US dollar reversed its year-long decline in September as Fed Chair Yellen said soft inflation figures supported gradual rate rises.
UK Sterlinghad a volatile month, at first rising to highs not seen since the day after the European referendum before falling back on concerns over the possibility of a ‘hard Brexit’.
In Asia, the Malaysian ringgit (+1%), the Philippine peso (+0.5%) and the Hong Kong dollar (+0.2%) were the best-performing currencies. The Indian rupee and the Korean won were the worst-performing currencies.
The euro fell against the US dollar for the first time in seven months as the market began to price in a Fed Reserve rate hike, US tax reform and the return of political risk following the German elections.
Fig 4. Currencies Performance versus USD (%)
ECONOMICS
Global: Economic data during September was broadly supportive for markets with few material surprises. US: The 2Q annualized GDP came in at 3.1% vs 1.2% in 1Q. Retail sales contracted 0.2% mom in August. CPI was at 0.4% mom in August; the ISM survey was at 60.8. New orders for durable goods expanded 1.7% in Aug vs a contraction of -6.8% in July. The Unemployment rate came in at 4.4% in August.
Eurozone: PMI came in at 58.1. IP increased 3.2% in July vs +2.8% in June. Retail sales contracted 0.3% vs 0.6% expansion in June. Consumer confidence was at -1.2 for September. The core CPI figure for September came in at 1.1% vs 1.2% in August.
The Fed announced initiation of balance sheet normalisation in October while keeping the benchmark interest rate constant at 1.0-1.25%.
Bank of Japan held policy rates: 10-year JGB yields at 0% and short-term policy rate at -0.1%.
The PBoCannounced targeted Reserve Ratio cuts on 30 September, the first since October 2015. The move is regarded as largely neutral and aimed at fine tuning liquidity. In Emerging Markets,Brazil lowered its Selic rate by 100bps to 8.25%; Peru and Indonesia lowered rates by 25bps each to set rates at 3.5% and 4.25% respectively; Russia lowered its key policy rate by 50bps to 8.5%.
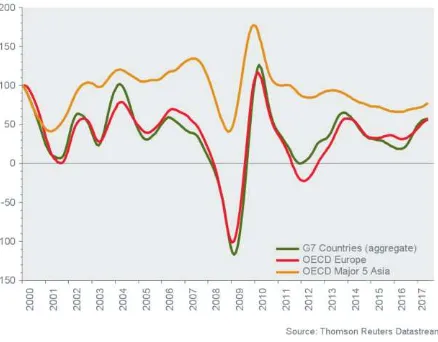
Fig 5. OECD Composite Leading Indicator
Source: Eastspring Investments. Chart data from Thomson Reuters DataStream as at 30 September 2017. For representative indices and acronym details please refer to notes in the appendix.
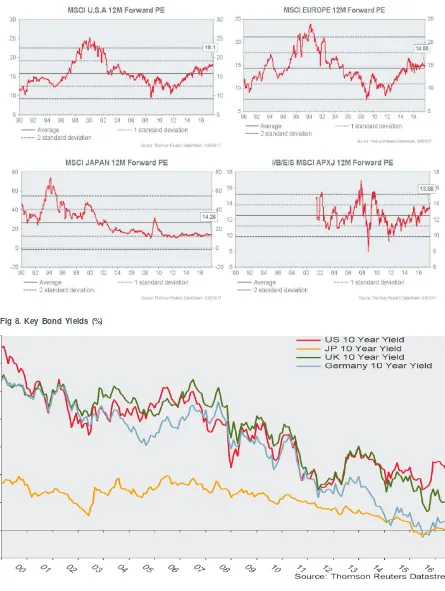
Fig 8. Key Bond Yields (%)
Source: Eastspring Investments
EM Currencies MSCI Emerging Markets Currency Index EM Equities MSCI Emerging Markets Index
EM Local Currency Bonds JP Morgan Emerging Local Currency Bond Index EM USD Bonds JP Morgan Emerging Market Bond Index
EMU European Monetary Union
EU European Union
Fed The Federal Reserve Board of the United States FOMC Federal Open Market Committee
GDP Gross Domestic Product
Global Developed Equities MSCI Developed Markets Index Global Equities MSCI All Country World Index
Global Government Bonds Citigroup World Government Bond Index
IP Industrial Production
SELIC Sistema Especial de Liquidação e CU.S.todia (SELIC) (Special Clearance and Escrow System) Tankan Japan Large Business Sentiment Survey
TSF Total Social Financing
UK United Kingdom
y/y Year on year
REPRESENTATIVE INDICIES
Aluminum S&P GSCI Aluminum Index Asia Local Bond (ALBI) HSBC Asia Local Bond Index
Brent Oil Cash settlement price for the InterContinental Exchange (ICE) Brent Future based on ICE Futures Brent index
Commodities Datastream Commodities Index Copper S&P GSCI Copper Index EMU 10 Year Datastream EMU 10 Year Global Emerging Bond JPM Global Emerging Bond Index
Gold S&P GSCI Gold Index
Japan 10 Year Datastream Japan 10 Year JACI JP Morgan Asia Credit Index MSCI Dev World MSCI Developed Markets Index MSCI EM MSCI Emerging Markets Index MSCI Europe MSCI Europe Index
MSCI Japan MSCI Japan Index
MSCI Latam MSCI Latin America Index MSCI Russia MSCI Russia Index
MSCI U.S. MSCI U.S. Index
MSCI World MSCI All Country World Index Steel (HRC) TSI Hot Rolled Coil Index UK 10 Year Datastream UK 10 Year
U.S. 10 Year Treasuries Datastream U.S. 10 Year Treasuries U.S. 30 Year Treasuries Datastream U.S. 30 Year Treasuries U.S. High Yield BAML U.S. High Yield Constrained II U.S. Investment Grade BAML Corporate Master
DXY U.S. Dollar Index
For more information visit
eastspring.com
This document is produced by Eastspring Investments (Singapore) Limited and issued in:
Singapore and Australia (for wholesale clients only)by Eastspring Investments (Singapore) Limited (UEN: 199407631H), which is incorporated in Singapore, is exempt from the requirement to hold an Australian financial services licence and is licensed and regulated by the Monetary Authority of Singapore under Singapore laws which differ from Australian laws.
Hong Kongby Eastspring Investments (Hong Kong) Limited and has not been reviewed by the Securities and Futures Commission of Hong Kong.
Indonesiaby PT Eastspring Investments Indonesia, an investment manager that is licensed, registered and supervised by the Indonesia Financial Services Authority (OJK).
United States of America (for institutional clients only)by Eastspring Investments (Singapore) Limited (UEN: 199407631H), which is incorporated in Singapore and is registered with the U.S Securities and Exchange Commission as a registered investment adviser.
European Economic Area (for professional clients only) and Switzerland (for qualified investors only)by Eastspring Investments (Luxembourg) S.A., 26, Boulevard Royal, 2449 Luxembourg, Grand-Duchy of Luxembourg, registered with the Registre de Commerce et des Sociétés (Luxembourg), Register No B 173737.
United Kingdom (for professional clients only)by Eastspring Investments (Luxembourg) S.A. - UK Branch, 125 Old Broad Street, London EC2N 1AR.
Chile (for institutional clients only)by Eastspring Investments (Singapore) Limited (UEN: 199407631H), which is incorporated in Singapore and is licensed and regulated by the Monetary Authority of Singapore under Singapore laws which differ from Chilean laws.
The afore-mentioned entities are hereinafter collectively referred to as Eastspring Investments.
This document is solely for information purposes and does not have any regard to the specific investment objective, financial situation and/or particular needs of any specific persons who may receive this document. This document is not intended as an offer, a solicitation of offer or a recommendation, to deal in shares of securities or any financial
instruments. It may not be published, circulated, reproduced or distributed without the prior written consent of Eastspring Investments.
Investment involves risk. Past performance and the predictions, projections, or forecasts on the economy, securities markets or the economic trends of the markets are not necessarily indicative of the future or likely performance of Eastspring Investments or any of the funds managed by Eastspring Investments.
Information herein is believed to be reliable at time of publication. Where lawfully permitted, Eastspring Investments does not warrant its completeness or accuracy and is not responsible for error of facts or opinion nor shall be liable for
damages arising out of any person’s reliance upon this information. Any opinion or estimate contained in this document
may subject to change without notice.
Eastspring Investments (excluding JV companies) companies are ultimately wholly-owned / indirect subsidiaries / associate of Prudential plc of the United Kingdom. Eastspring Investments companies (including JV's) and Prudential plc are not affiliated in any manner with Prudential Financial, Inc., a company whose principal place of business is in the United States of America.