REAL-TIME EARTHQUAKE MONITORING WITH SPATIO-TEMPORAL FIELDS
J.C. Whittier, Silvia Nittel∗, Iranga Subasinghe
School of Computing and Information Science, The University of Maine, Orono, ME 04469, USA [email protected]
KEY WORDS:Data Stream, Data Stream Processing, Real-time Event Detection, Earthquake Event Detection, Apache Spark, Fields, Temporal Field, Fields as ADTs
ABSTRACT:
With live streaming sensors and sensor networks, increasingly large numbers of individual sensors are deployed in physical space.
Sensor datastreamsare a fundamentally novel mechanism to deliver observations to information systems. They enable us to represent
spatio-temporal continuous phenomena such as radiation accidents, toxic plumes, or earthquakes almost as instantaneously as they happen in the real world. Sensor data streams discretely sample an earthquake, while the earthquake is continuous over space and time. Programmers attempting to integrate many streams to analyze earthquake activity and scope need to write code to integrate potentially very large sets of asynchronously sampled, concurrent streams in tedious application code. In previous work, we proposed the field stream data model (Liang et al., 2016) for data stream engines. Abstracting the stream of an individual sensor as a temporal field, the field represents the Earth’s movement at the sensor position as continuous. This simplifies analysis across many sensors significantly. In this paper, we undertake a feasibility study of using the field stream model and the open source Data Stream Engine (DSE) Apache Spark(Apache Spark, 2017) to implement a real-time earthquake event detection with a subset of the 250 GPS sensor data streams of the Southern California Integrated GPS Network (SCIGN). The field-based real-time stream queries compute maximum displacement values over the latest query window of each stream, and related spatially neighboring streams to identify earthquake events and their extent. Further, we correlated the detected events with an USGS earthquake event feed. The query results are visualized in real-time.
1. INTRODUCTION
Major earthquakes have significant impact on human life and built infrastructure. In recent years several devastating earth-quakes took place with significant damage such as the earthquake and tsunami in Japan (2011) and the earthquakes in Nepal (2015), Italy (2016), and New Zealand (2011 and 2016). Earthquakes are created through the constant movement of the Earth’s tectonic plates and the resulting friction that is created. Early earthquake detection and wide-spread early warning systems are essential to shut down infrastructure such as gas, chemical or nuclear power plants and transportation, and save human life. Earthquakes can be detected by two characteristic waves, the P-wave and the S-wave (Bullen and Bolt, 1985). The P S-wave travels much faster than the S wave, and therefore provides a longer time window for early warning. The S-wave indicates the start of the significant movements of the earthquake itself.
Today, most physical sensor systems to detect and measure earth-quakes are run by government agencies. Measurement stations with expensive and accurate equipment are deployed and the data is analyzed by seismology scientists; this data is often not avail-able to the general public in its raw form. However, in recent years several approaches have been explored to use alternative, inexpensive technology such as commercial-off-the-shelf GPS sensors to detect movement along earthquake faults (Grapenthin et al., n.d., Grapenthin et al., 2014, Wright et al., 2012, Clay-ton et al., 2015, Hudnut et al., 2002). These GPS based sensor networks measure displacement, and send real-time data mea-surement streams. Other efforts include using smartphone vi-bration sensors for earthquake detection (Panizzi, 2016, Kong et al., 2015). We can reasonably expect that in the future, an in-creasing number of up to potentially thousands of sensors will be
∗Corresponding author
deployed in earthquake-prone regions, from smartphones to inex-pensive GPS stations, which continuously measure and report the Earth’s movement in real-time. Such sensor networks will pro-duce high throughput data streams of thousands of updates/sec that need to be analyzed in real-time.
While an earthquake is acontinuousmovement of the Earth in
space and over time, measurement station provide onlydiscrete
samples of this movement. Each sensor only observes the event at a specific, local position, and all observations need to be in-tegrated over space and time to assess the scope and magnitude of an earthquake. This synthesis across potentially thousands of streams should be done in near-real-time (i.e. ca. 1-2 second de-lay). Programming this task is no small feat using conventional technology, such as databases or programming languages with standard libraries.
providing a query language, which consists of a library of cus-tomizable functions such as filter(), map(), reduce() and others.
In this paper, we pursue two objectives: first, we study the
fea-sibility of our previously proposed field model abstractions by applying them to a real world problem, that is real-time
earth-quake event detection with sensor data streams. Secondly, we
explore the implications of a practical implementation integrat-ing the field data types into a commercial or open source DSE. For this study, we chose the open source system DSE Apache Spark (Apache Spark, 2017). In detail, we modeled the prob-lem of earthquake detection as a probprob-lem of processing contin-uous fields. Our input data are 250 real-time sensor streams of the Southern California Integrated GPS Network (SCIGN); here, each a sensor generates 1 update/s. An earthquake can be seen as a spatio-temporal event that can be extract from an underly-ing spatio-temporal field. The underlyunderly-ing field is the continu-ous movement of the tectonic plates, which is measured by the network of GPS stations. The movement captured by a single sensor is represented as a temporal field over this sensor. The temporal fields of all sensors of the SCIGN are seen as a spatio-temporal field since spatially neighboring sensor stations measure different, but related aspects of the same earthquake. Thus, an earthquake can be captured by first analyzing the temporal fields over sensors. Once analysis of the temporal fields indicates above threshold movement values, the temporal fields are spatially cor-related, and the start, end and spatial scope of an earthquake event can be deduced. We implemented this approach within Apache Spark as continuously executed Apache jobs and the results are visualized in real-time.
The remainder of this article is organized as follows: in Section 2, we discuss the background of this work, including earthquake de-tection in Southern California and the concept of abstracting sen-sor data streams as temporal fields. In Section 3, we state our ob-jectives for this work. Section 4 and 5 describe our approach, that is the mapping of streams to field Resilient Distributed Datasets (RDDs) and the implementation of real-time earthquake detect-ing usdetect-ing Spark queries. Section 6 discusses our lessons learned and our conclusions follow in Section 7.
2. BACKGROUND
2.1 Monitoring Earthquakes in Southern California
Earthquakes take place due to the movement of tectonic plates, and the tension between them, while moving in different direc-tions. The type of movement depends on the geographic location of a tectonic plate and its connecting plates. In this paper, we are interested in the San Andreas Fault in Southern California. The San Andreas Fault is a fracture line between the Pacific Plate that moves in the North direction and the North American plate, which moves South, and both plates sitting slightly on top of each other. Friction between both plates builds up tension over time, which releases via an earthquake. The movement is relatively slow, and it can take decades for significant tension to build up. Thus, displacement along the known smaller and larger fault lines is of most interest.
The SCIGN (Hudnut et al., 2002) consists of roughly 250 Global Positioning System (GPS) stations, distributed throughout South-ern California with an emphasis on the greater Los Angeles metropolitan region. The major objective of the SCIGN network
is to provide regional coverage for estimating earthquake poten-tial throughout Southern California, and to learn more about the mechanical properties of earthquake faults.
The GPS sensors are deployed in proximity to small and large faults. Each station produces an update at a rate of once per second including the latest measured position of the GPS, the delta of displacement from the previous measured location in (x, y, z), and error data, all available in GeoJSON format (Geo-JSON, 2017). An example update message from a sensor is pro-vided in Listing 1. The ’shaking’ of an earthquake delivers dis-placement values (deltas) of increasing and then decreasing value over time periods. Likely, they are observable in spatially nearby stations also.
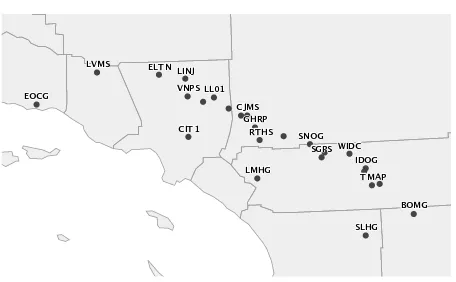
Figure 1. Locations of SCIGN sensor sites in the TrimbleJSON feed
2.2 Real-time Sensor Data Stream Processing
With up to 250 stations, and likely more stations in the future, the data processing of all streams in real-time becomes a pro-gramming challenge. Over the last decade, DSE have become commercially available; the Apache Foundation offers an open source DSE, Apache Spark (Apache Spark, 2017). DSEs are sim-ilar to DBMSs in that they offer a data model and query language, which make it significantly easier for users to program applica-tions that require real-time processing of data streams. A user de-fines the stream schema and can program SQL-like queries over the streams to perform basic and complex aggregation and anal-ysis tasks. Stream queries are expressed in terms of temporal windows over streams. For instance, a query will collect the data of the last minute, perform the query and produce a result. The query is automatically re-evaluated over the next window of ar-riving data from the stream (i.e. continuous query) (Chen et al., 2000). DSEs provide high throughput query processing for data streams by buffering and processing streams in main memory. Stream queries are implemented as scalable, one-pass (Muthukr-ishnan, 2005) stream operators; they can be parallelized automat-ically (Gali´c, 2016). Today, open source and commercial DSEs such as Apache Spark(Apache Spark, 2017) achieve query
per-formance over streams with a throughput of>1 Million updates/s
per CPU core(Carbone et al., 2015).
2.3 Temporal Fields as Stream Data Types
In geographic information science, the termfield(more precisely
al., 2016). For instance, a field implies a continuous quality of an observed phenomenon in the real-world, such as temperature, that is present at every point in time and space within a defined region on Earth. Similarly, an earthquake can be considered a
spatio-temporaleventthat is extracted from a continuous
spatio-temporal field. Here, the underlying spatio-spatio-temporal field can be the change in position of each spatial (point) location on Earth
between two time instancestiandtj. To compare movements
for multiple time instants,t0, t1, . . . , tn, rather than calculating
the difference between the position attiwith that atti−1, using
a static reference position and calculating the difference between
the reference position and the position attisimplifies the
analy-sis.
Today, scientists mainly deal with spatial fields; many differ-ent computer represdiffer-entations are common (raster, TINs, isolines, etc). While implementations of these computer representations enable specialized analytical operations in geographic informa-tion systems, the diversity and lack of coherence of representainforma-tion hinders convenient integration and cross-cutting analyses (Kemp, 1996). This problem is exacerbated if the continuity over time is also considered such as with the need to integrate sensor data streams (Liang et al., 2016).
In (Liang et al., 2016), we introduced fields as Abstract Data Types (ADTs) for stream data models. The core idea is that sen-sor data streams are abstracted as temporal fields, spatial fields or spatio-temporal fields, depending on the application needs.
Fields are approximated based on observations, so-called
sam-pled fields, and a field ADT implementation consists of the obser-vations and an approximation function that uses the obserobser-vations to estimate all the values at points at which the field was not di-rectly sampled. Thus, the field ADT ‘behaves’ as if the temporal field is continuous, and automatically approximates the continu-ity of the values over time based on the observations. For more details and the formal definitions of fields, please see (Liang et al., 2016).
3. OBJECTIVES
In this paper, our objective is to assess the feasibility of Field ADTs as well as DSEs for a world problems, in this case real-time earthquake monitoring. We identified publicly available live data streams, and selected the SCIGN network. The streams are accessible via sockets in near-real-time. SCIGN delivers ‘raw’ GPS values that we cast to temporal fields. The temporal fields we aggregated over time and space to detect events. Addition-ally, we used a United States Geological Survey (USGS) feed reporting officially reported earthquake events, with the purpose of comparing our detected events with the USGS events.
3.1 Data sources
3.1.1 SCIGN The Southern California Integrated GPS Net-work (SCIGN) consists of roughly 250 GPS stations located in Southern California (Hudnut et al., 2002). Each station produces an update at a rate of once per second including a time stamp, the latest spatial position, delta to a reference position, and error data in GeoJSON format. Additionally, a topic (a kind of composite type), in the format
[P rocessingEngine].[Region].[SiteCode].[SolutionT ype], is included in the GeoJSON document that identifies the lineage
of the data. A real-time client is available through SCIGN
to connect to a live GeoJSON stream for topics (customized
subsets) that meet the wildcard query topic. At the time of
this article, only the TrimbleJSON processing engine feed included computed deltas in the delta feature. The 32 sites in the TrimbleJSON feed are depicted in Figure 1 and an example message from SCIGN is shown in Listing 1.
Listing 1. A TrimbleJSON Message from SCIGN
{
" type ":" Point " } ,
" type ":" Point " } ,
" type ":" Point " } ,
" type ":" Point " } ,
3.1.2 USGS The USGS provides “real-time” feeds and notifi-cations for earthquake events(Real-time Feeds and Notifinotifi-cations, 2017). Though the feeds are referred to as “real-time,” there is a
delay between theorigintime of the event, when the earthquake
began, and theupdatedtime, when the event is published to the
GeoJSON feed, which is over 20 minutes. The GeoJSON feed URL supports user provided parameters including filtering events by spatial location, origin time, and update time. To retrieve new events detected by the USGS within a bounding box of interest, a user polls the feed for updates since the time of the last update. An example event is shown in Listing 2.
{ " ids ":" , ci37657079 ," , " s o u r c e s ":" , ci ," ,
3.2 System Components and Architecture
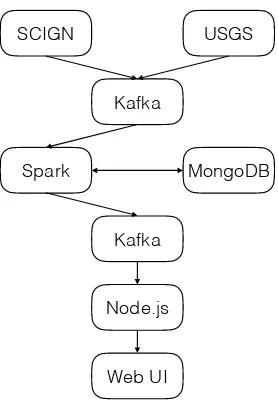
Our real-time earthquake detection system is built using using mostly open source software components that are loosely coupled in a micro service architecture to enable system scalability.
SCIGN USGS
Figure 2. System Components and Data Flow
For the implementation, we choseApache Spark(Apache Spark,
2017). Spark is used for expressing and processing queries over streams. Streams can be be generated by data sources or by queries, i.e. their continuously delivered results over windows. A stream query is both a stream consumer and a stream producer (of result tuples). Since the rate of produced and consumed
tu-ples needs to be carefully orchestrated, we useKafka (Apache
Kafka, 2017) for message passing between stream inputs, pro-cessing components, and output consumers. Capped collections in MongoDB are used to cache the SCIGN stream, so that when delayed USGS events arrive, the USGS event and time series of nearby SCIGN stations can be combined.
3.2.1 Apache Spark: Stream Processor Apache Spark (Apache Spark, 2017) is an open source cluster computing platform supporting in-memory processing of stored and stream-ing data in the form of batch and streamstream-ing jobs, respectively. For stream processing, Spark partitions a stream into windows,
called adiscretizedstream orDStream, and processes the data in
Spark using a program written in Scala, Java, or Python.
3.2.2 Apache Kafka: Message Broker Apache Kafka (Apache Kafka, 2017) is a distributed, massively scalable message broker designed for real-time streaming appli-cations. Kafka acts as a centralized message broker, passing data between input data streams and and stream processing queries, between stream processing queries, and between stream
processing queries and other consumers. Kafka utilizestopics
that producers publish to and consumers subscribe to.
3.2.3 MongoDB: Data Storage MongoDB(MongoDB, 2017) is a open source document-oriented database program and classified as a NoSQL database system. MongoDB uses JSON-like documents with schemas. MongoDB supports Ad-Hoc queries, indexing and real-time aggregation; this provides powerful tools to access and analyze data with high throughput.
MongoDB supports capped collections, which are fixed-size
collections that support high throughput operations. These
collections work in a way similar to circular buffers. In general, MongoDB collections can be used as a persistent storage for historical data analysis.
How the data streams are consumed, analyzed, and fed to a live dashboard is discussed further in the following sections.
4. MAPPING GPS STREAMS TO TEMPORAL FIELDS
In Section 1, we described the data format of SCIGN updates as they arrive. The stream tuples are formatted in GeoJSON by SCIGN and Spark is able to parse and process JSON formats di-rectly, i.e. operators are available to extract the schema and the tuples. In Spark, the basic data structure to store and process data is an RDD. An RDD is a immutable, read-only, logical data col-lection that can contain any type of Python, Java, or Scala objects, including user-defined classes. Transparently to users, Spark di-vides a RDD into logical partitions, which may be processed on different nodes of a cluster in parallel.
The implementation of a Temporal Field type consists of two components: the observation data and an interpolation function (or a set of different interpolation functions for flexibility). To provide values at time instants of the temporal field at which the field has not be sampled directly the field implementation approx-imates the requested value based on both components. Thus, any programming tasks using Field types can abstract from the notion of observations, and work based on the assumption of continuity.
To implement a Temporal Field type in Spark, we programmed an operator that extracts relevant data from the incoming SCIGN
observation feed and creates aField RDD. The Field RDD is
a generic, flexible schema for spatio-temporal data streams that supports both sensor observations and spatio-temporal events. It has a fixed schema for observations, which is defined as
< id >< location >< time >< value >
TrimbleJ-SON.pppar.RTX.7ODM) or event id. An id can be a string, number, or null.
• The< location >is the location that the value corresponds to. A location can be point, line sting, polygon, or null. A point consists of a (latitude, longitude) pair.
• The< time >is the time the value was collected/sampled. A time can be an instant or interval; currently, only instants are considered.
• The< value >is either null or a valid JSON string. This string can include nested structures or be flattened depend-ing on the limitations of the implementation environment.
Any Sparkqueries are expressed using operators such asfilter,
map, andreduce, which are provided by Spark. Once the data
stream is transformed into a field RDD, field operators to analyze the streams can be written. The Spark query results are stored as an RDD again. The details of the field analysis operators are detailed in the following section.
5. REAL-TIME EARTHQUAKE EVENT DETECTION
We approach detecting earthquake events in two steps: a
real-time event detection stepusing live GPS streams and a response
time of a few seconds, and apost-mortem event detection step
using USGS earthquake event notifications and comparing such an event to our detected event(s) and the raw sensor data streams that we cached for this purpose. All tasks are automated, and run continuously. Results are visualized in real-time in web applica-tion, which can be found at (Real-time Earthquake Monitoring Visualization for SCIGN Stations, University of Maine, 2017).
5.1 Real-time Event Detection using GPS Streams
5.1.1 SCIGN Stream Processing Pipeline The GPS streams from SCIGN are analyzed and visualized to extract earthquake events. At a high level, the data flow follows the system architec-ture presented in Figure 2.
In detail, the data flow begins with a Node.js client, provided by SCIGN, to consume the live stream of data hosted by SCIGN. The client uses Socket.IO (Socket.IO, 2017) to pass the de-sired SCIGN topics back to the data source to customize the
data that should appear in the stream. To get all data from
the TrimbleJSON processing engine, the topic is specified as
TrimbleJSON.*.*.*. Socket.IO is then used to stream all tuples with the TrimbleJSON processing engine to the client. The out-put from the SCIGN client is piped to a Kafka console producer,
which loads the messages in the SCIGN stream into a
scign-flat-trimbleKafka topic. Note, that the stream is called a series of messages, and each update is a message.
Once a message is loaded into Kafka, it is available to be pro-cessed by Spark. The Spark stream processing jobs subscribe to and read from an input topic, perform some data transforma-tion, and then publish the results back to Kafka as a new stream to a different topic. This new stream can be consumed by an-other Spark job or the Node.js server for the visualization. We use MongoDB for data storage, with some jobs (queries) writing to or reading from MongoDB. During processing, the stream is grouped by the attribute sensor identifier. For each sensor, a win-dow is defined, and the observations within the winwin-dow are ag-gregated. An overview of the Spark streaming job can be found below.
The SCIGN Trimble Consumer Spark job feeds raw SCIGN
data to the web visualization by listening to thescign-flat-trimble
Kafka topic, partitioning the stream into time-based windows, transforming the output to the desired format and publishing the
transformed messages to thescign-raw-output Kafka topic. It
also performs aggregation to calculate the range of thex, y, z
deltas and a combined 3D delta for each sensor (SCIGN topic)
per window. The deltas (forx,y, andz) from each observation
are aggregated individually using Equation 1 to calculate their range and together using Equation 2 to calculate a combined 3D range.
As described further in Section 5.1.3, the Node.js server sub-scribes to this topic for visualizing the data.
range(∆x) =max(∆x)−min(∆x) (1)
range∆ 3D=
p
(range(∆x))2+ (range(∆y))2+ (range(∆z))2
(2)
Following, the aggregated stream is published to the
scign-agg-outputtopic.
5.1.2 Filtering Events from Aggregated SCIGN Data A simple specification of an earthquake event is defined as an oc-currence of
range∆ 3D> T (3)
whereT is a threshold value. In order to extract events, a filter
job has been implemented that filters the output of the
scign-agg-outputKafka topic to select all aggregated tuples whose 3D delta exceeds the threshold value. The choice of the threshold value is discussed in Section6. The threshold is supplied as an argument when the Spark job is submitted; the job is described in detail below.
1. SCIGN Event Filter Spark job listens to the
scign-agg-output Kafka topic, which applies a filter to find the ag-gregated SCIGN events above the provided delta thresh-old. The filtered aggregated SCIGN events are published to scign-filter Kafka topic to be consumed by another
Spark job, which stores the detected events in the
scign-event-archivecollection.
2. SCIGN Event Extractor Spark job that processes detected events retrieves the raw SCIGN data from the
Mon-goDB capped collectionscign-raw, for the sensor that
de-tected the event and itsk−1nearest neighbor sensors within
r, and within a specified time window around the event. The
data about the event, and the raw data from theksensors are
combined and stored in thescign-event-archivecollection
and output to thein-scign-model-eventKafka topic.
3. Thein-scign-model-eventKafka topic is then consumed by
the SCIGN Model Transformer Spark job to transform the messages to the desired format for the visualization and it
published the data to thescign-event-outputKafka topic.
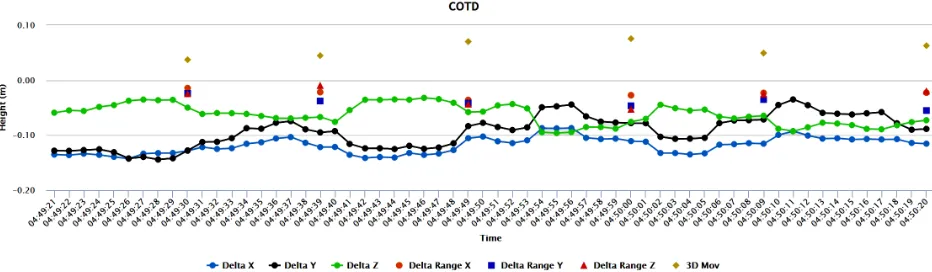
Figure 3. Real-time raw deltax, y, zand aggregated ranges for a SCIGN sensor site
the Spark system is served using Node.js, an open source, server-side JavaScript runtime environment. Node.js subscribes to
sev-eral Kafka topics (scign-raw-output, scign-agg-output,
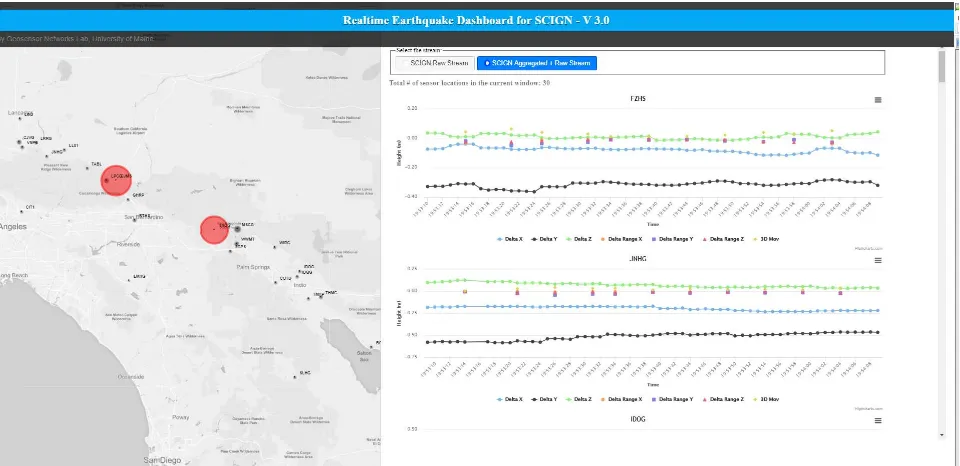
scign-event-outputandusgs-event-output) in order to push the real-time data and events to the web-based visualization client. Data is streamed from Node.js to the web-based visualization client us-ing the Socket.IO (Socket.IO, 2017) JavaScript library. The web-based visualization client then loads the real-time data into time series graphs generated using the Highcharts JavaScript library (Highcharts, 2017).
In Figure 4 the raw and aggregated streams are visualized on the right of the dashboard, while the left side shows the map of sen-sor site and their aggregated 3D deltas. The web-based map is built using the Leaflet (Agafonkin, 2017) JavaScript library that visualizes the aggregated 3D delta range and events. A circle is used to visualize the aggregated 3D delta range for each sensor site, where the relative diameter of the circle is proportional to the aggregated 3D delta value. The color of the circle is red when the aggregated 3D delta value at a site exceeds a threshold, otherwise it is black.
5.2 Correlating GPS Streams with USGS Events
The second, alternative approach for earthquake analysis uses a feed publishing earthquake events occurring in California, pro-vided by USGS. Each event in this feed is extracted and we
vi-sualize the time series data from thek nearest SCIGN sensors
around the reported earthquake and within a time window around the occurrence of the USGS reported event. This approach for processing the USGS events extends the SCIGN processing ap-proach mentioned in subsection 5.1.
5.2.1 USGS Stream Processing Pipeline A stand-alone Python program consumes the parameterized USGS earthquake event within a bounding box surrounding California. In order to only fetch the latest event(s), the feed is polled periodically for
event updates and compares thelast updatedtime-stamp with
the most recent event update that we have processed. The last
updated time-stamp is fetched from theusgs-raw-archive
Mon-goDB collection which is used to store USGS events locally.
The consumed stream from USGS is then published into the
in-usgs-rawKafka topic and serves as input to the Spark processing pipeline.
1. The USGS Event Transformer Spark job consumes from the
in-usgs-rawKafka topic and publishes the events it receives
to the output topicsout-usgs-eventandout-usgs-raw.
2. The USGS Consumer Spark job listens to the USGS
earth-quake events in theout-usgs-rawtopic and stores the events
in the MongoDB collectionusgs-raw-archiveto make them
available for further analysis.
This processing pipeline prepares the USGS events to be com-bined with the raw SCIGN data.
5.2.2 Combining USGS Events and SCIGN Observations
1. The USGS Event Extractor Spark job processes the USGS
earthquake events in theout-usgs-eventtopic and selects the
set ofknearest stations within a radius ofrmiles around
the reported earthquake location contained in a USGS event. For this set of stations, the raw data within a predefined time window, relative to the time (origin time) of the USGS earthquake event, are fetched from the MongoDB capped
collectionscign-raw. The data about the USGS event, and
the raw data from theksensors are combined and stored in
theusgs-event-archivecollection and output to the in-usgs-model-eventKafka topic.
2. Thein-usgs-model-eventKafka topic is then consumed by
the USGS Model Transformer Spark job to transform the messages to the desired format for the visualization and
pub-lished to theusgs-event-outputKafka topic.
6. DISCUSSION
Figure 4. Web Visualization Client Dashboard with Spatial Visualization and Live Streams.
relates to earthquakes of magnitude 7.0. It is currently unclear how accurately smaller earthquakes can be detected using the cur-rently deployed GPS devices. However, we believe that question is likely to be resolved by future technology development.
Experimenting with parameters:The system was designed to be
able to test the impact of different parameters. The radius,r, and
number of neighboring sensors,k, around an event are two
pa-rameters for combining events detected from the SCIGN stream and in the USGS feed with data streamed by SCIGN. It is
impor-tant to note that although both approaches returnksensors within
raround an event, the locations of an event in the SCIGN Event
Filter are the locations of SCIGN sensors where as in the USGS feed the location is where the earthquake originated. This means that if the SCIGN Event Filter and the USGS both detect the same event, the location of the detected event will be different and thus
theknearest sensors to each event location are not necessarily the
same. An additional consideration is whether the choice ofrand
kdepend on the magnitude of the earthquake event and whether
these parameters should be fixed or adaptive.
Additional parameters relate to bounds of time-based query win-dows used for aggregation and visualization. Currently, for
ag-gregating the SCIGN stream, a tumbling window of5 sis used,
meaning that data will be partitioned into non-overlapping5 s
windows. In Spark overlapping sliding windows are also sup-ported, which could be configured to both increase the time inter-val and shorten the time between result updates of a query. For combing events, from the SCIGN stream and the USGS feed, the interval of the SCIGN streams to be extracted needs to be speci-fied. This interval should be large enough to capture the behavior of the sensors during an event.
Scalability: By using a system architecture with loosely coupled components, individual components of the architecture can be scaled out to meet processing and storage requirements. Addi-tionally, the system was designed so that it can be deployed
us-ing amicroservice architecture, where each component could be
elastically scaled or new code could be deployed to a component while the entire system continued to operate. For example, in Spark where most of the data processing is done, each Spark job
can be managed independently as the Spark jobs are integrated using Kafka as a message broker.
Field Library: First, we explored the design to implement a sen-sor stream as a temporal field within an open source DSE. Here, the main lesson learnt is that support for a field ‘type’ is less likely to be a data type implementation. Instead we envision that spatio-temporal field support is implemented as a field RDD type and library of field functions that interface with Spark functions and alleviated coding needs for programmers.
7. CONCLUSION
In this paper, we presented a feasibility study of using the field stream data model (Liang et al., 2016) and an open source DSE, Apache Spark (Apache Spark, 2017), for real-time earthquake event detecting using the GPS streams of SCIGN. We presented two approaches to earthquake detection; in the first approach, we processed the sensor data streams using window stream queries, and found the maximum displacement in each window. These values were filtered against a threshold value, and events were
identified. We stored raw data temporarily in MongoDB to
support the second approach, in which we pulled the latest earthquake notifications from USGS, and correlated the reported events with our detected events and the raw data. All queries an-alyze the latest data updates continuously and events are reported within 1-2 seconds after the first indication. Real-time data visu-alization is available at (Real-time Earthquake Monitoring Visu-alization for SCIGN Stations, University of Maine, 2017).
ACKNOWLEDGEMENTS
The authors would like to acknowledge the National Science Foundation for supporting this work via Award No. 1527504.
REFERENCES
Apache Kafka, 2017. http://kafka.apache.org (24 May 2017).
Apache Spark, 2017. http://spark.apache.org (24 May 2017).
Bullen, K. E. and Bolt, B. A., 1985. An Introduction to the
The-ory of Seismology, 4th Ed. Press Syndicate of the University of Cambridge, Cambridge.
Carbone, P., Katsifodimos, A., Ewen, S., Markl, V., Haridi, S. and Tzoumas, K., 2015. Apache flink: Stream and batch processing in
a single engine.Bulletin of the IEEE Computer Society Technical
Committee on Data Engineering.
Chen, J., DeWitt, D. J., Tian, F. and Wang, Y., 2000. NiagaraCQ: A Scalable Continuous Query System for Internet Databases. In:
Proceedings of the 2000 ACM SIGMOD International Confer-ence on Management of Data, SIGMOD ’00, ACM, New York, NY, USA, pp. 379–390.
Clayton, R. W., Heaton, T., Kohler, M., Chandy, M., Guy, R. and Bunn, J., 2015. Community Seismic Network: A Dense Array to
Sense Earthquake Strong Motion. Seismological Research
Let-ters.
Couclelis, H., 1992. People manipulate objects (but cultivate fields): Beyond the raster-vector debate in gis. In: A. U. Frank,
I. Campari and U. Formentini (eds), Theories and Methods of
Spatio-Temporal Reasoning in Geographic Space: International Conference GIS — From Space to Territory: Theories and Meth-ods of Spatio-Temporal Reasoning Pisa, Italy, September 21–23, 1992 Proceedings, Springer Berlin Heidelberg, Berlin, Heidel-berg, pp. 65–77.
Gali´c, Z., 2016. Spatio-Temporal Data Streams. Springer New
York.
GeoJSON, 2017. http://geojson.org/ (24 May 2017).
Grapenthin, R., Johanson, I. A. and Allen, R. M., 2014.
Opera-tional real-time GPS-enhanced earthquake early warning.
Jour-nal of Geophysical Research: Solid Earth119(10), pp. 7944– 7965.
Grapenthin, R., Johanson, I. and Allen, R., n.d. 32 G-larmS:
Inte-grating Real-Time GPS into Earthquake Early Warning.Berkeley
Seismological Laboratoryp. 70.
Highcharts, 2017. https://www.highcharts.com/ (12 Apr. 2017).
Hudnut, K. W., Bock, Y., Galetzka, J. E., Webb, F. H. and Young, W. H., 2002. The Southern California Integrated GPS Network
(SCIGN).Seismotechtonics in Convergent Plate Boundary
(Jan-uary), pp. 167–189.
Kemp, K., 1996. Fields as a framework for integrating GIS and environmental process models. Part 1: Representing spatial
con-tinuity.Transactions in GIS.
Kong, Q., Kwony, Y. W., Schreierz, L., Allen, S., Allen, R. and Strauss, J., 2015. Smartphone-based networks for earthquake
de-tection. In: Innovations for Community Services (I4CS), 2015
15th International Conference on, pp. 1–8.
Liang, Q., Nittel, S. and Hahmann, T., 2016. From Data Streams to Fields: Extending Stream Data Models with Field Data Types. In:9th International Conference on Geographic Information Sci-ence (GISciSci-ence), Montreal, Canada, September, Springer LNCS, pp. 1242–1253.
MongoDB, 2017. https://www.mongodb.com (24 May 2017).
Muthukrishnan, S., 2005. Data streams: Algorithms and
applica-tions. Foundations and Trends in Theoretical Computer Science
1(2), pp. 117–236.
Panizzi, E., 2016. The SeismoCloud App: Your Smartphone As
a Seismometer. In: Proceedings of the International Working
Conference on Advanced Visual Interfaces, AVI ’16, ACM, New York, NY, USA, pp. 336–337.
Real-time Earthquake Monitoring Visualization
for SCIGN Stations, University of Maine, 2017.
http://shakeviz.geosensornetworks.net/ (18 July 2017).
Real-time Feeds and Notifications, 2017.
https://earthquake.usgs.gov/earthquakes/feed/ (24 May 2017).
Socket.IO, 2017. https://socket.io (30 May 2017).
Stonebraker, M., C¸ etintemel, U. and Zdonik, S., 2005. The 8
requirements of real-time stream processing. ACM SIGMOD
Record34(4), pp. 42–47.
Wright, T. J., Houli´e, N., Hildyard, M. and Iwabuchi, T., 2012. Real-time, reliable magnitudes for large earthquakes from 1 Hz GPS precise point positioning: The 2011 Tohoku-Oki (Japan)