And Phenylpropanolamine Hydrochloride In Cough And Cold Tablet Using
High Performance Liquid Chromatography
Yani Ardiyanti
1,3, Sudjadi
1, Sugeng Riyanto
1and Abdul Rohman
1,2*1Department of Pharmaceutical Chemistry, Faculty of Pharmacy Universitas Gadjah Mada, Yogyakarta 55281, Indonesia 2Centre of Research for Fiqh Science and Technology (CFIRST), Universiti Teknologi Malaysia, Skudai, Malaysia
3The the National Agency of Drug and Food Control, district of Palangkaraya, Central Kalimantan, Indonesia
ARTICLE INFO ABSTRACT
Received 08/07/2014
Received in revised form 07/08/2014 Accepted15/8/2014
Available online 1/10/2014
The method of choice for analysis of drugs in multi-component preparations is chromatographic based technique such as high performance liquid chromatography (HPLC). A liquid chromatographic method was applied for the analysis paracetamol (PCT), guaiphenesin (GG), chlorpheniramine maleate (CTM) and phenylpropanolamine HCl (PPA) using three different system as described in the USP XXXVI/NF 31. The method depends on a separation on reversed-phase C8, C18 and Phenyl column for analysis PCT, GG, and CTM-PPA respectively with mobile phase water-methanol-acetic acid glacial (79:20:1) for PCT, water-methanol-acetic acid glacial (60:40:1,5) for GG and methanol-water (60:40) containing 0.34 g of monobasic potassium phosphate, 0.05 g of triethylamine hydrochloride, 0.25 g of sodium lauryl sulfate, and 0.1 mL of phosphoric acid in each 100 mL for CTM-PPA. Quantitation was achieved with UV detection at 280, 276 and 214 nm respectively for PCT, GG, and CTM-PPA based on peak area. The methods were validated in terms of system suitability test, specificity, precision, accuracy, linearity, and the results were found to be satisfactory.
Keywords: RP-HPLC, Paracetamol, Guaiphenesin, Chlorpheniramine maleate, Phenylpropanolamine HCl.
1. Introduction
Paracetamol (PCT), Guaiphenesin(GG), Chlorpheniramine maleate (CTM) and Phenylpropanolamine Hydrochloride (PPA) (Figure 1) are active pharmaceutical ingredients frequently combined and widely used in several pharmaceutical preparations, especially in cold and cough formulation. PCT is a popular antipyretic and analgesic agent (Hardman et.al., 1996). In some countries, it is one of the most used medicines, as an alternative to acetylsalicylic acid (aspirin). GG is an expectorant used for treatment of productive cough.
CTM is a powerful first-generation alkyl amine antihistamine, H1-receptor antagonist, widely used for symptomatic relief of common cold and allergic rhinitis, with weak sedative properties, while PPA is a nasal decongestan (Redasani et.al, 2013).
Some analytical methods have been used for determination of PCT, GG, CTM and PPA, either alone or in combination with other medicines, in pharmaceutical products, mostly based on chromatographic and electrophoretic techniques. Such methods are high performance liquid chromatography (Akhtar et.al, 1994; Deconinck et.al, 2011), gas chromatography (Harsono et.al, 2005), FTIR spectrophotometry (Mallah et.al, 2012), cyclic voltametry (Teixeira et.al, 2009) and derivative spectrophotometry (Deshpande et.al, 2012).
The objective of this study was to determine paracetamol (PCT), guaiphenesin (GG), chlorpheniramine maleate (CTM) and phenylpropanolamine HCl in cough and cold tablet formulation using high performance liquid chromatography (HPLC).
2. Materials and Methods 2.1. Materials
The standards of Paracetamol (PCT), Guaiphenesin (GG), Chlorpheniramine maleate (CTM) and Phenylpropanolamine HCl (PPA) were of Reference standard of Indonesian Pharmacopeia and were obtained from the National Agency of Drug and Food Control, Republic of Indonesia. Distilled water were obtained from Brataco Chemical, Indonesia, double distilled water were obtained from Otsuka, Indonesia. Hydrochloride acid, acetic acil glacial, orthophosphoric acid 85%, monobasic potassium hydroxide, triethylamine hydrochloride and sodium lauryl sulphate were of pro analytical grade, methanol used for solvent and mobile phase were of liquid chromatography grade and obtained from Merck Chemical, Germany. The tablet dosage form was obtained from pharmacy in Yogyakarta containing 650 mg PCT, 100 mg GG, 15 mg PPA and 2 mg CTM on label claimed in each tablet .
2.2. Determination of Paracetamol (PCT) in cough and cold tablet dosage form
2.2.1 HPLC Condition
The HPLC separation and quantitation were made on HPLC Shimadzu LC-20AD, SPD-20A, SIL 20AC – SP1 on a Waters Spherisorb 10 µm C8 column (250 × 4.6 mm i.d.). The mobile phase was prepared by mixing double distilled water – methanol – acetic acid glacial in ratio of 79:20:1 (v/v). The flow rate was 1 mL/min. All
determinations were performed at ambient
temperature. The injection volume was 20 µL. The mobile phase was filtered using 0.45-µm membrane filter (Millipore, Milford, MA) and degassed by vacuum prior to use. The samples were also filtered using 0.45-µm disposable filters. The detector was set at 280 nm.
2.2.3 Preparation of Paracetamol standard solution Approximately 25 mg of paracetamol reference standard were taken and placed in a 25 mL flask. Add 2 mL of methanol, diluted with 0.1% phosphoric acid, sonicated for 10 minutes and then cooled to room temperature, diluted with 0.1% phosphoric acid up to the mark (standard stock solution). As much as 2.5 mL of standard stock solution was put into the 10 mL flask, 0.1% phosphoric acid was added to the mark, then filtered using a filter with a pore size of 0.45 µm (I-A).
2.2.4 Sample Solution
Not less than 20 of cough and cold tablets containing paracetamol were taken then powdered. The amount of powder equivalent to approximately 50 mg of paracetamol, put in a 50 mL flask, added 4 mL of methanol, diluted with 30 mL of 0.1% phosphoric acid, sonicated 20 minutes and then cooled to room temperature, diluted with 0.1% phosphoric acid up to the mark (sample stock solution). As much as 2.5 mL of sample stock solution was put in 10 mL flask, 0.1% phosphoric acid was added up to the mark then filtered using a filter with a pore size of 0.45 µm (I-B). Replication done for six times.
2.3. Determination of Guaiphenesin (GG) in cough and cold tablet dosage form
HPLC Condition
The HPLC separation and quantitation were made on HPLC Shimadzu LC-20AD, SPD-20A, SIL 20AC – SP1 on a Waters X-Bridge 5 µm C18 column (250 × 4.6 mm i.d.). The mobile phase was prepared by mixing double distilled water – methanol – acetic acid glacial in ratio of 60:40:1.5 (v/v). The flow rate was 0.7 mL/min. All
determinations were performed at ambient
temperature. The injection volume was 20 µL. The mobile phase was filtered using 0.45-µm membrane filter (Millipore, Milford, MA) and degassed by vacuum prior to use. The samples were also filtered using 0.45-µm disposable filters. The detector was set at 276 nm. Fig. 1. Chemical structure of (a) paracetamol, (b) guaiphenesin, (c) chlorpheniramine maleat and
2.3.2 Sample Solution
Not less than 20 of cough and cold tablets containing guaiphenesin were taken then powdered. The amount of powder equivalent to approximately 100 mg of guaiphenesin was put in a 50 mL flask, added
2.4. Determination of Chlorpheniramine maleate (CTM) and Phenylpropanolamine hydrochloride in triethylamine hydrochloride, 0.25 g of sodium lauryl sulfate, and 0.1 mL of phosphoric acid in each 100 mL. The flow rate was 1 mL/min. All determinations were performed at ambient temperature. The injection volume was 20 µL. The mobile phase was filtered using 0.45-µm membrane filter (Millipore, Milford, MA) and degassed by vacuum prior to use. The samples were also filtered using 0.45-µm disposable filters. The detector was set at 214 nm.
2.4.1. Preparation of Phenylpropanolamine HCl standard solution
Approximately 25 mg of phenylpropanolamine HCl reference standard were taken and placed in a 10 mL phosphoric acid to the mark, then filtered using a filter with a pore size of 0.45 µm (III-A). solution was put into the 50 mL flask added with 5 mL methanol, diluted with 0.1% phosphoric acid to the mark, then filtered using a filter with a pore size of 0.45 µm (III-C).
2.4.4. Sample Solution
Not less than 20 of cough and cold tablets containing CTM and PPA were taken then powdered. The amount of powder equivalent to approximately 2.5 mg of PPA, put in a 50 mL flask, added 5 mL of methanol, diluted with 30 mL of 0.1% phosphoric acid, sonicated 20 minutes and then cooled to room temperature, diluted with 0.1% phosphoric acid up to the mark then filtered using a filter with a pore size of 0.45 µm (III-D). Replication done for six times.
2.5. Methods verification System suitability test Standard solution of PCT (I-A), GG (II-A) and CTM-PPA (III-C) repeatedly injected 6 times from the same solution. Retention time, peak area and tailing factor were recorded then the value of the percent RSD were calculated. In general, the good system is expressed by RSD 2% (Snyder et al., 1997).
2.5.1. Specificity
2.5.2. Precision
Precision test was performed by injection of the test solution (I-B, II-B, and III-D), the replication is performed 6 times. Peak areas were recorded and calculated by comparing the peak area of standard from system suitability test. The average value and standard deviation (SD) and relative standard deviation values (RSD) was calculated from the six levels obtained. Acceptance values based on the value of precision test analyte concentration which RSD value 1.3% for PCT and GG, RSD value 1.9% for PPA and RSD value 2.8%
for CTM (AOAC, 1998). Average levels of each precision test express the level of PCT, GG, CTM and PPA in pharmaceutical preparations tested samples.
2.5.3. Accuracy
Accuracy test was performed by creating a mixed solution of standard stock solution and sample stock solution concentration levels 80, 90, 100, 110 and 120% with a ratio of 3: 7. Replication on each point accuracy was done 3 times for the standard solution and three different sample stock solution. A mixture of standard Fig. 2. Chromatograms of paracetamol system suitability test
and sample 3:7 is injected into the chromatographic system. Peak area were recorded and calculated by comparing the standard peak area from system suitability test as the measured analyte concentration. Percent recovery was calculated by comparing the measured analyte concentration to the theoretical concentration of the analyte. Percent recovery is said to be good if it lies in the range of 98-102% for PCT, 93-103% for PPA and 95-105% for CTM (AOAC, 1998).
2.5.4. Linearity
Linearity is an indicator of the ability of an analytical method which shows that the detector response is proportional to the concentration of analyte in a sample at a particular range of values. Linearity test is done by making a solution of the active substance concentration levels between 80% to 120% equal with accuracy test with 3 times repetition for each concentration. Each of the above solution is injected into the HPLC system, then created regression equation between peak area (y-axis) against concentration (x-axis) so that the resulting linear regression equation y = a + bx, and the value of the correlation coefficient (r) was obtained as linearity parameters. Value of the correlation coefficient (r) received if 0,999 (Snyder et al., 1997; Miller and Miller, 2010).
2.5.5.Data Analysis
The level of paracetamol, guaiphenesin, chlorpheniramine maleate and phenylpropanolamine HCl
in tablet dosage form and the correlation between actual values of these drugs are calculated and performed using Microsoft Office Excel 2007.
3. Results and Discussion
Analysis of PCT, GG, CTM and PPA conducted with 3 separate HPLC system. Verification methods of 3 such systems needs to be done to look at the ability of laboratories to apply the method of analysis. Verification method of GG has been carried out by laboratory analysts so that researchers only verifying the assay method of PCT, CTM and PPA in tablet dosage form.
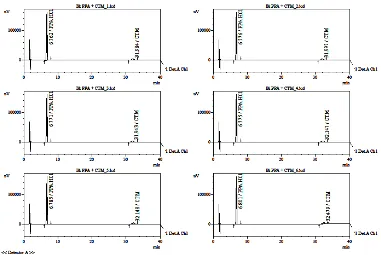
3.1. System suitability test
Figure 2, 3 and 4 shows the chromatograms of PCT, GG, CTM and PPA system suitability test in its each sytem condition. Tables 1, 2 and 3 respectively present the results of PCT, GG and CTM-PPA system suitability datas. The table provides information that HPLC system assay stated good system as the all RSD values 2.0%.
3.2. Specificity
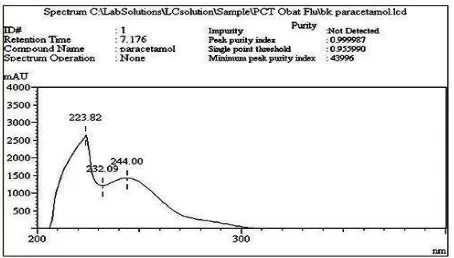
In this study, the determination of the specificity are carried out using UV-PDA detector. Uv spectrum profiles are shown in a certain retention time, as well as information on the purity of the chromatogram can be seen by the peak purity index values (peak purity index). Methods assessed selective when approaching the peak purity index of 1.00 (Ahuja and Dong, 2005).
Fig. 5. UV spectra profile of paracetamol on the specificity test using a PDA detector
Fig. 6. UV spectra profile of chlorpheniramine maleate on the specificity test using a PDA detector
Fig. 7. UV spectra profile of phenylpropanolamine HCl on the specificity test using a PDA detector
In determining the specificity of paracetamol, specific wavelengths obtained at 228.82; 232.09 and 244 nm. Paracetamol peak purity index is 0.999987 indicating that the method is selective. Profile paracetamol uv-PDA spectra can be seen in Figure 5. In the determination of chlorpheniramine maleate-phenylpropanolamine HCl, specific wavelengths obtained at 223.89; 243.27 and 262.61 nm for chlorpheniramine maleate and at 228.69; 257.72 nm for phenylpropanolamine HCl. Peak purity
index for chlorpheniramine maleate and phenylpropanolamine HCl is 0.999998 and 1.000000
indicating that the HPLC method is selective for both. Uv-PDA spectra profile of chlorpheniramine maleate and phenylpropanolamine HCl can be seen in Figure 6 and 7. Specificity of a method is the method's ability to measure certain substances careful and thorough with the other components. CTM chromatogram is perfectly separated from PPA HCl. The separation is expressed by the value of resolution. In this study, the average resolution of the CTM and PPA HCl is 32.424. In general, if the good resolution is expressed while greater than 2 (Snyder et al., 1997). Thus the assay method CTM-HCl PPA meets the requirements of the resolution.
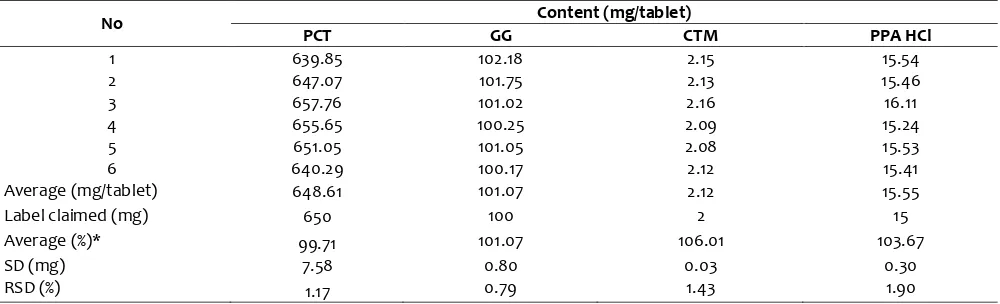
3.3. Precision
Precision test was performed with the injection of the sample solution and was done 6 times. This test is used to look at the ability of the method to analyze samples at the same operational conditions within a short time. Peak area recorded and calculated by comparing the standard peak area on system suitability test. The average of the six levels are calculated is 99.71%; 101.07%; 106.01%; 103.67% respectively for PCT, GG, CTM and PPA HCl, and the relative standard deviation (RSD) of PCT, GG, CTM and PPA HCl respectively are of 1.17%; 0.79%; 1.43% and 1.90% as shown in Table 4. Precision test acceptability value based on the value of the
concentration of the analyte: RSD ≤ . % for PCT and GG; RSD ≤ . % for PPA HCl, and RSD ≤ . % for CTM (AOAC,
1998), so it can be stated that the test precision of this method is eligible. Average levels of each precision test express the level of PCT, GG, CTM and PPA in pharmaceutical preparations tested samples.
3.4. Accuracy
Accuracy is parameter of the closeness between the results obtained with a particular method of analysis with the actual values, represented by the percent recovery. In this study, the accuracy test performed at level 5 levels, namely 80, 90, 100, 110 and 120% of the analyte with the standard addition method with replication 3 times for each point. Standard addition method performed by the addition of a certain amount of standard into the sample solution with a ratio of 3: 7.
Tables 5, 6 and 7 present the accuracy test data of paracetamol, phenylpropanolamine hydrochloride and chlorpheniramine maleate. Recovery of paracetamol obtained was 98-100% with the acceptance condition 98-
%RSD 0.176 0.049 0.021
Table 2. System suitability test data on guaiphenesin (GG) assay method
No. Retention time (minute) Peak area (uV) Tailing factor
1 8.700 371262 1.381
2 8.714 369706 1.380
3 8.710 370231 1.380
4 8.707 369862 1.380
5 8.707 369967 1.379
6 8.706 370408 1.380
AV 8.707 370239 1.380
%RSD 0.053 0.152 0.034
Table 3. System suitability test data on chlorpheniramine maleate (CTM)-phenylpropanolamine HCl (PPA) assay method
No. Retention time (minute) Peak area (uV) Tailing factor Resolution
PPA HCl CTM PPA HCl CTM PPA HCl CTM
1 6.762 31.984 1857187 224847 0.844 0.986 32.323
2 6.776 31.997 1856179 224632 0.849 0.985 32.407
3 6.771 31.943 1853783 224668 0.851 0.987 32.296
4 6.775 32.147 1854667 224769 0.855 0.988 32.410
5 6.785 32.148 1852752 223400 0.860 0.986 32.421
6 6.801 32.479 1852996 221914 0.866 0.977 32.589
AV 6.778 32.116 1854594 224038 0.854 0.985 32.424
%RSD 0.197 0.615 0.096 0.523 0.929 0.385 0.271
Table 4. Precision test data / data assay of paracetamol (PCT), guaiphenesin (GG), chlorpheniramine maleate (CTM) and henylpropanolamine hydrochloride (PPA) in cough and cold tablet using USP XXXVI (2013) HPLC method with 3 separate systems
No Content (mg/tablet)
PCT GG CTM PPA HCl
1 639.85 102.18 2.15 15.54
2 647.07 101.75 2.13 15.46
3 657.76 101.02 2.16 16.11
4 655.65 100.25 2.09 15.24
5 651.05 101.05 2.08 15.53
6 640.29 100.17 2.12 15.41
Average (mg/tablet) 648.61 101.07 2.12 15.55
Label claimed (mg) 650 100 2 15
Average (%)* 99.71 101.07 106.01 103.67
SD (mg) 7.58 0.80 0.03 0.30
RSD (%) 1.17 0.79 1.43 1.90
Table 5. Accuracy test results of the paracetamol assay in cough and cold tablet using USP XXXVI (2013) HPLC method
Table 6. Accuracy test results of the phenylpropanolamine HCl assay in cough and cold tablet using USP XXXVI (2013) HPLC method
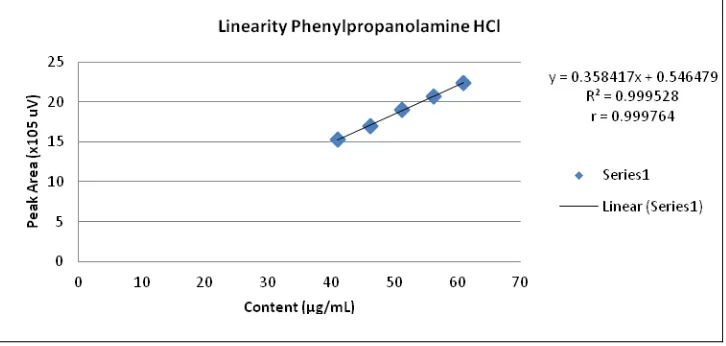
3.5. Linearity
Linearity test is done by injecting 5 series concentrations in the range 80-120% of the expected concentration in the preparations, each performed 3 replication. This linearity is used to determine the relationship between the concentration and the analyte peak area. Figure 8, 9 and 10 shows the relationship between the concentration and peak area of paracetamol, chlorpheniramine maleate and phenylpropanolamine HCl respectively. Linearity test result in the r value are 0.9999 (PCT), 0.9997 (PPA HCl) and 0.9999 (CTM). This suggests that the method of analysis produces a peak area that is proportional to the analyte concentration.
4. Conclusion
The assay results obtained using HPLC method were convenient, and good coincidence was observed. The HPLC method was found to be suitable for the routine
determination of paracetamol, guaiphenesin,
chlorpheniramine maleate and phenylpropanolamine HCl in tablet dosage form and they do not require any separation or extraction procedures.
5. Acknowledgement
The authors thank to Faculty of Pharmacy, Gadjah Mada University for its financial support during this study. The the National Agency of Drug and Food Control, district of Yogyakarta, Indonesia was acknowledged for providing HPLC instrument make this research possible.
References
Ahuja, S.; and Dong, M.W. Handbook of Pharmaceutical Analysis by HPLC. Elsevier Inc. United Kingdom, 2005; 6(1). 204-205.
Akhtar, M.J.; Khan, S.; Hafiz, M. High-performance liquid chromatographic assay for the determination of paracetamol, pseudoephedrine Fig 8. Curve of relationship between peak area vs. concentration on paracetamol (PCT) linearity test in cough and cold
tablet using USP XXXVI (2013) HPLC method.
hydrochloride and triprolidine hydrochloride. J Pharm Biomed Anal. 1994; 12(3). 379-382. AOAC., Peer Verified Methods Programs; Manual on
Policies and Prosedures, Association of Official Analytical Chemists. 1998.
Deconinck, E.; Sacré, P.Y.; Baudewyns, S.; Courselle, P.; and De Beer, J. A fast ultra high pressure liquid chromatographic method for qualification and quantification of pharmaceutical combination preparations containing paracetamol, acetyl salicylic acid and/or antihistaminics. J Pharm Biomed Anal. 2011; 56. 200-209.
Deshpande, S.D.; Deosarkan, A.V.; and Walode, S.G. Absorption Ratio, Derivative Spectroscopy and RP-HPLC Methods for Estimation of Guaifenesin and Ambroxol Hyclhoride in Tablet. Der Chemica Sinica. 2012; 3(3). 759-765.
Hardman, J.; Limbird, L.E.; Molinoff, P.B.; Ruddon, R.W.; and Gilman, G.A. Goodman Gilman’s The Pharmacological Basis of Therapeutics. McGraw-Hill, New York. 1996; 6. 631.
Harsono, T.; Yuwono, M.; and Indrayanto, G. Simultaneous determination of some active ingredients in cough and cold preparations by gas chromatography, and method validation. Journal of AOAC International. 2005; 88. 1093-1098.
Mallah, M.A.; Sherazi, S.T.H.; Mahesar, S.A.; and Khaskeli, A.R. Simultaneous Quantification of Ibuprofen and Paracetamol in Tablet Formulations Using Transmission Fourier Transform Infrared Spectroscopy. Am J Anal Chem. 2012; 3. 503-511.
Miller, J.N.; and Miller, J.C. Statistics and Chemometrics for Analytical Chemistry. Pearson Education Limited, England. 2010; 6.
Redasani, V.K.; Gorle, A.P.; Badhan, R.A.; Jain, P.S.; and Surana, S.J. Simultaneous determination of chlorpheniramine maleate, phenylephrine hydrochloride, paracetamol and caffeine in pharmaceutical preparation by RP-HPLC. Chem Industry Chem Eng Quarterly. 2013; 19(1). − . Snyder, L.R.; Kirkland, J.J.; and Glajch, J.L., Practical
HPLC Method Development. John Wiley & Sons Inc, New York. 1997; 2. 644-646, 686-702. Teixeira, M.F.S.; Marcolino-Júnior, L.H.; Fatibello-Filho,
O.; Moraes, F.C.; and Nunes, R.S. Determination of Analgesics (Dipyrone and Acetaminophen) in Pharmaceutical Preparations by Cyclic Voltammetry at a Copper (II) Hexacyanoferrate (III) Modified Carbon Paste Electrode. Curr. Anal. Chem. 2009; 5. 303-310.