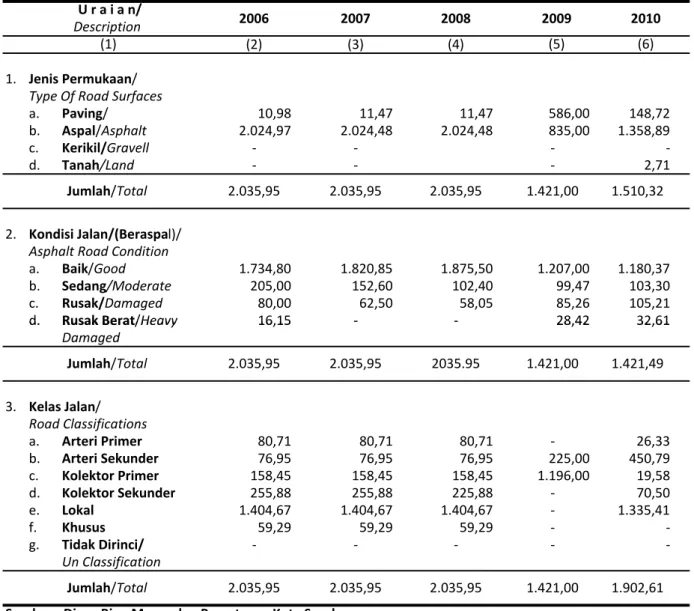
Tabel : 08.01.01 Panjang Jalan menurut Jenis Permukaan, Table Kondisi Jalan Beraspal dan Kelas Jalan Road Length by Type of Road Surfaces, Condition of Asphalted Roads and Road Classifications 2006 ‐ 2010 (2) (3) (4) 1. Jenis Permukaan/ Type Of Road Surfaces a. Paving/ 10,98 11,47 11,47 586,00 148,72 b. Aspal/Asphalt 2.024,97 2.024,48 2.024,48 835,00 1.358,89 c. Kerikil/Gravell ‐ ‐ ‐ ‐ d. Tanah/Land ‐ ‐ ‐ 2,71 2. Kondisi Jalan/(Beraspal)/ Asphalt Road Condition a. Baik/Good 1.734,80 1.820,85 1.875,50 1.207,00 1.180,37 b. Sedang/Moderate 205,00 152,60 102,40 99,47 103,30 c. Rusak/Damaged 80,00 62,50 58,05 85,26 105,21 d. Rusak Berat/Heavy 16,15 ‐ ‐ 28,42 32,61 U r a i a n/ 2006 2007 2008 2009 2010 Description (1) (5) (6) Jumlah/Total 2.035,95 2.035,95 2.035,95 1.421,00 1.510,32 d. Rusak Berat/Heavy 16,15 ‐ ‐ 28,42 32,61 Damaged 3. Kelas Jalan/ Road Classifications a. Arteri Primer 80,71 80,71 80,71 ‐ 26,33 b. Arteri Sekunder 76,95 76,95 76,95 225,00 450,79 c. Kolektor Primer 158,45 158,45 158,45 1.196,00 19,58 d. Kolektor Sekunder 255,88 255,88 225,88 ‐ 70,50 e. Lokal 1.404,67 1.404,67 1.404,67 ‐ 1.335,41 f. Khusus 59,29 59,29 59,29 ‐ ‐ g. Tidak Dirinci/ ‐ ‐ ‐ ‐ ‐ Un Classification Sumber : Dinas Bina Marga dan Pematusan Kota Surabaya Source : Highway Construction and Utility Service of Surabaya City *) Data diperbaiki & sesuai hasil survey panjang jalan 1993, sedangkan kelas jalan / Klasifikasi sesuai Kep Menteri Pekerjaan Umum Nomor : 463/KPTS/1991 terdiri dari : A) Ateri, B) Kolektor, C) Lokasi *) Revised figure and agree with the result of 1993 road length survey but road classifications agree with decree of public works minister Jumlah/Total 2.035,95 2.035,95 2035.95 1.421,00 1.421,49 Jumlah/Total 2.035,95 2.035,95 2.035,95 1.421,00 1.902,61
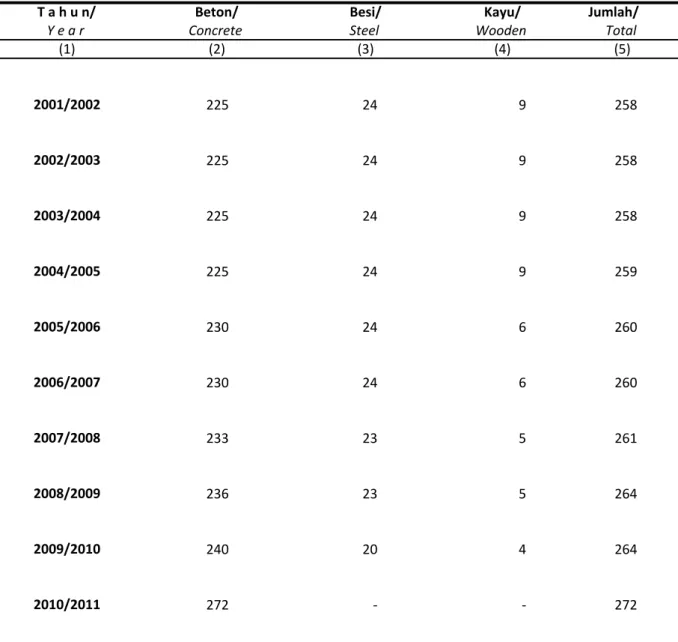
Tabel : 08.01.02 Banyaknya Jembatan menurut Jenisnya Table Number of Bridges by Type of Constructions 2001/2002 ‐ 2010/2011 225 24 9 258 225 24 9 258 225 24 9 258 225 24 9 259 230 24 6 260
T a h u n/ Beton/ Besi/ Kayu/ Jumlah/
Y e a r Concrete Steel Wooden Total
(1) (2) (3) (4) (5) 2001/2002 2002/2003 2003/2004 2004/2005 2005/2006 230 24 6 260 230 24 6 260 233 23 5 261 236 23 5 264 240 20 4 264 272 ‐ ‐ 272 Sumber : Dinas Bina Marga dan Pematusan Kota Surabaya Source : Highway Construction and Utility Service of Surabaya City SURABAYA DALAM ANGKA 2011 338 2008/2009 2009/2010 2010/2011 005/ 006 2006/2007 2007/2008
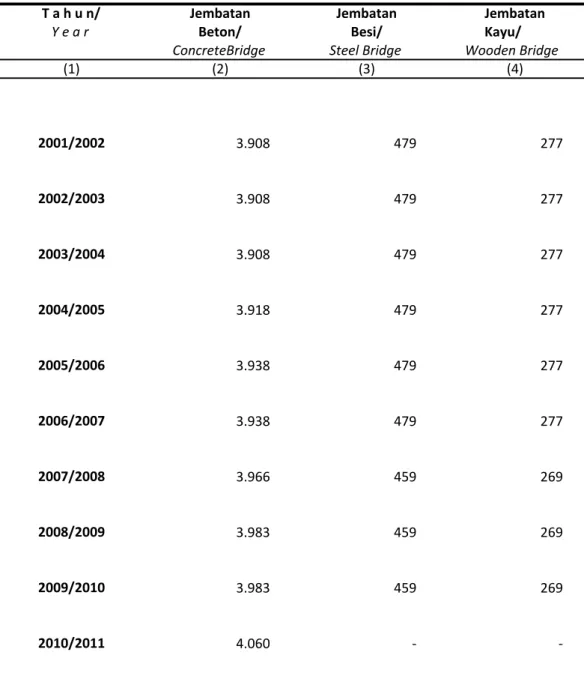
Tabel : 08.01.03 Perkembangan Bangunan Fisik Panjang Table Jembatan menurut Jenisnya Trend of Bridge Length by Type of Constructions 2001/2002 ‐ 2010/2011 3.908 479 277 3.908 479 277 3.908 479 277 3.918 479 277
T a h u n/ Jembatan Jembatan Jembatan
Y e a r Beton/ Besi/ Kayu/
ConcreteBridge Steel Bridge Wooden Bridge
(1) (2) (3) (4) 2001/2002 2002/2003 2003/2004 2004/2005 3.918 479 277 3.938 479 277 3.938 479 277 3.966 459 269 3.983 459 269 3.983 459 269 4.060 ‐ ‐ Sumber : Dinas Bina Marga dan Pematusan Kota Surabaya Source : Highway Construction and Utility Service of Surabaya City 2007/2008 2008/2009 2009/2010 2010/2011 004/ 005 2005/2006 2006/2007
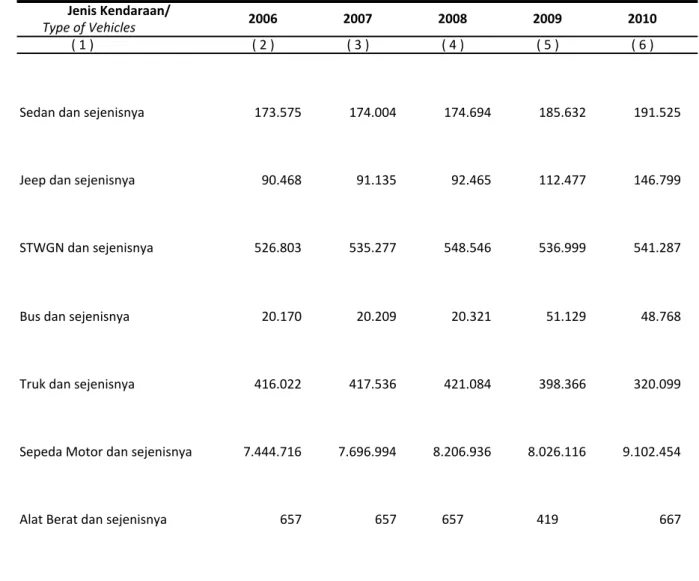
Tabel : 08.01.04 Banyaknya Kendaraan Bermotor dan Becak Table menurut Jenisnya Number of Motorized Vehicles and Becaks by Type of Vehicles 2006 ‐ 2010 ( 1 ) ( 2 ) ( 3 ) ( 4 ) ( 5 ) ( 6 ) Sedan dan sejenisnya 173.575 174.004 174.694 185.632 191.525 Jeep dan sejenisnya 90.468 91.135 92.465 112.477 146.799 STWGN dan sejenisnya 526.803 535.277 548.546 536.999 541.287 Bus dan sejenisnya 20.170 20.209 20.321 51.129 48.768 Type of Vehicles 2006 Jenis Kendaraan/ 2007 2008 2009 2010 Truk dan sejenisnya 416.022 417.536 421.084 398.366 320.099 Sepeda Motor dan sejenisnya 7.444.716 7.696.994 8.206.936 8.026.116 9.102.454 Alat Berat dan sejenisnya 657 657 657 419 667 Sumber : Polantas Kota Besar Surabaya Source : Surabaya Traffict Police 340 Jumlah/Total 8.672.411 8.935.812 9.464.703 10.351.599 SURABAYA DALAM ANGKA 2011 9.311.138
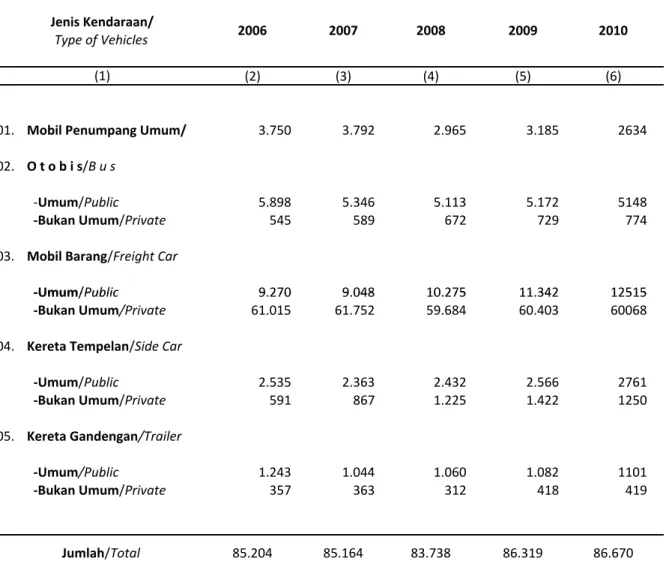
Tabel : 08.01.05 Banyaknya Kendaraan Bermotor Wajib Uji Table menurut Jenisnya Number of Compulsory Tested Motor Vehicles by Type of Vehicles 2006 ‐ 2010 (2) (3) (4) (5) (6) 01. Mobil Penumpang Umum/ 3.750 3.792 2.965 3.185 2634 02. O t o b i s/B u s ‐Umum/Public 5.898 5.346 5.113 5.172 5148 ‐Bukan Umum/Private 545 589 672 729 774 03. Mobil Barang/Freight Car ‐Umum/Public 9 270 9 048 10 275 11 342 12515 (1) Jenis Kendaraan/ Type of Vehicles 2006 2007 2008 2009 2010 ‐Umum/Public 9.270 9.048 10.275 11.342 12515 ‐Bukan Umum/Private 61.015 61.752 59.684 60.403 60068 04. Kereta Tempelan/Side Car ‐Umum/Public 2.535 2.363 2.432 2.566 2761 ‐Bukan Umum/Private 591 867 1.225 1.422 1250 05. Kereta Gandengan/Trailer ‐Umum/Public 1.243 1.044 1.060 1.082 1101 ‐Bukan Umum/Private 357 363 312 418 419 Sumber : Dinas Perhubungan Kota Surabaya Source : Transportation and Communication Service of Surabaya City Keterangan/Note : *) Angka Diperbaiki/Number is revised Jumlah/Total 85.204 85.164 83.738 86.319 86.670
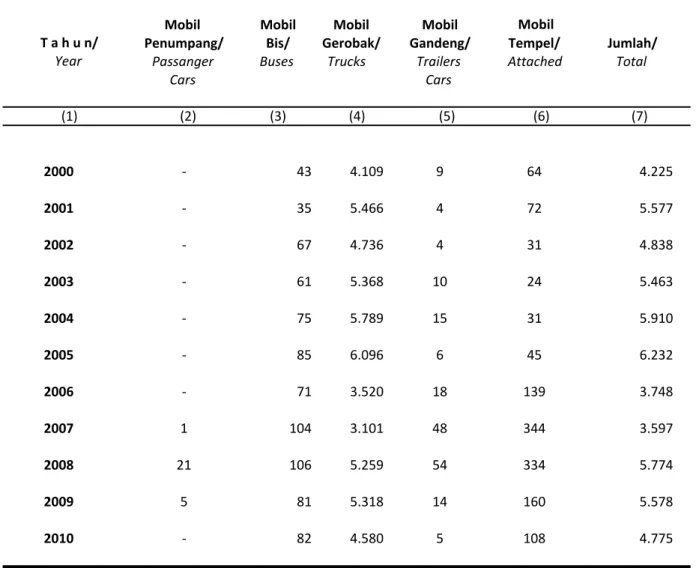
Tabel : 08.01.06 Banyaknya Kendaraan Bermotor Bukan Umum Table yang Telah Diuji Pertama Kali menurut Jenisnya Number of Private Motorize‐Vehicles Tested First by Type of Vehicles 2000 ‐ 2010
Mobil Mobil Mobil Mobil
Penumpang/ Bis/ Gerobak/ Gandeng/ Tempel/ Jumlah/
Passanger Buses Trucks Trailers Attached Total
Cars Cars 2000 ‐ 43 4.109 9 64 4.225 2001 ‐ 35 5.466 4 72 5.577 2002 ‐ 67 4.736 4 31 4.838 2003 ‐ 61 5.368 10 24 5.463 (5) (6) (7) Mobil T a h u n/ Year (1) (2) (3) (4) 2004 ‐ 75 5.789 15 31 5.910 2005 ‐ 85 6.096 6 45 6.232 2006 ‐ 71 3.520 18 139 3.748 2007 1 104 3.101 48 344 3.597 2008 21 106 5.259 54 334 5.774 2009 5 81 5.318 14 160 5.578 2010 ‐ 82 4.580 5 108 4.775 Sumber : Dinas Perhubungan Kota Surabaya Source : Transportation and Communication Service of Surabaya City Keterangan/Note : *)Angka diperbaiki/Number is revised SURABAYA DALAM ANGKA 2011 342
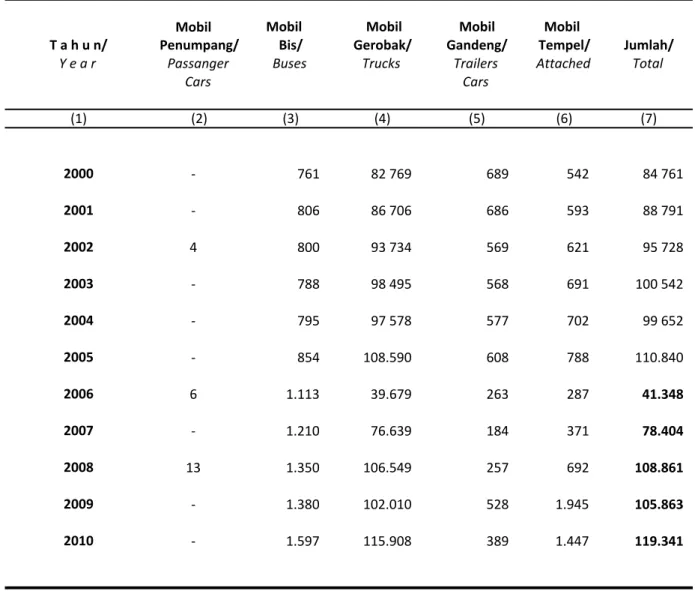
Tabel : 08.01.07 Banyaknya Kendaraan Bermotor Bukan Umum Table yang Telah Diuji Ulang menurut Jenisnya Number of Private Motorized‐Vehicle Retested by Type of Vehicles 2000 ‐ 2010 Mobil ‐ 761 82 769 689 542 84 761 ‐ 806 86 706 686 593 88 791 4 800 93 734 569 621 95 728 ‐ 788 98 495 568 691 100 542
Mobil Mobil Mobil Mobil
T a h u n/ Penumpang/ Bis/ Gerobak/ Gandeng/ Tempel/ Jumlah/
Y e a r Passanger Buses Trucks Trailers Attached Total
Cars Cars (1) (2) (3) (4) (5) (6) (7) 2000 2001 2002 2003 ‐ 795 97 578 577 702 99 652 ‐ 854 108.590 608 788 110.840 6 1.113 39.679 263 287 41.348 ‐ 1.210 76.639 184 371 78.404 13 1.350 106.549 257 692 108.861 ‐ 1.380 102.010 528 1.945 105.863 ‐ 1.597 115.908 389 1.447 119.341 Sumber : Dinas Perhubungan Kota Surabaya Source : Transportation and Communication Service of Surabaya City Keterangan/Note : *)Angka diperbaiki/Number is revised 2010 2004 2005 2006 2007 2008 2009
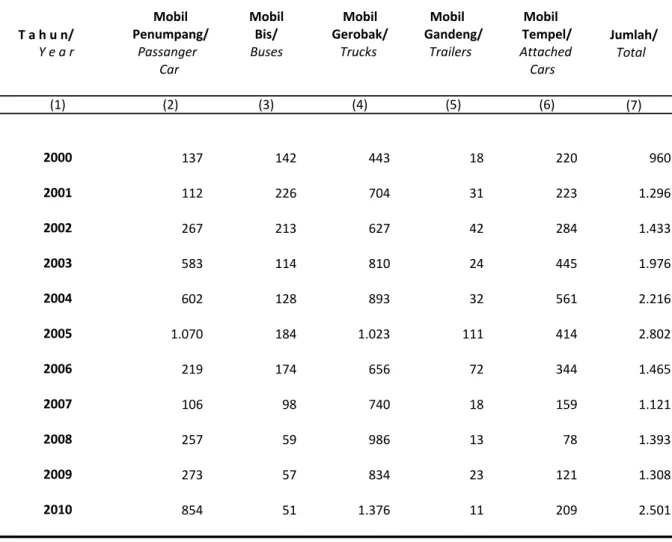
Tabel : 08.01.08 Banyaknya Kendaraan Bermotor Umum yang Telah Table Diuji Pertamakali menurut Jenisnya Number of General Motorize‐Vehicle Tested First by Type of Vehicles 2000 ‐ 2010 T a h u n/ Jumlah/ Total (7) 137 142 443 18 220 960 112 226 704 31 223 1.296 267 213 627 42 284 1.433 583 114 810 24 445 1.976
Mobil Mobil Mobil Mobil Mobil
Penumpang/ Bis/ Gerobak/ Gandeng/ Tempel/
Y e a r Passanger Buses Trucks Trailers Attached
Car Cars (1) (2) (3) (4) (5) (6) 2000 2001 2002 2003 602 128 893 32 561 2.216 1.070 184 1.023 111 414 2.802 219 174 656 72 344 1.465 106 98 740 18 159 1.121 257 59 986 13 78 1.393 273 57 834 23 121 1.308 854 51 1.376 11 209 2.501 Sumber : Dinas Perhubungan Kota Surabaya Source : Transportation and Communication Service of Surabaya City Keterangan/Note :*) Angka diperbaiki/Number is revised SURABAYA DALAM ANGKA 2011 344 2005 2006 2007 2008 2009 2010 2004
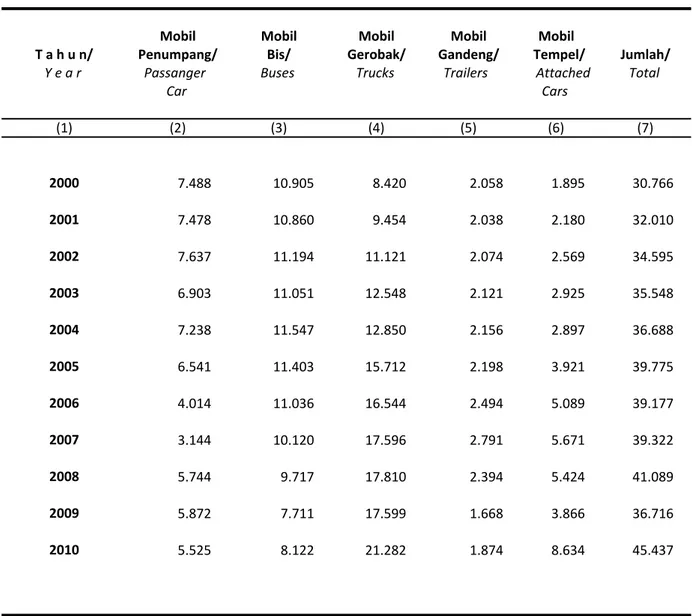
Tabel : 08.01.09 Banyaknya Kendaraan Bermotor Umum yang Telah Table Diuji Ulang menurut Jenisnya Number of General Motorize‐Vehicle Retested by Type of Vehicles 2000 ‐ 2010 7.488 10.905 8.420 2.058 1.895 30.766 7.478 10.860 9.454 2.038 2.180 32.010 7.637 11.194 11.121 2.074 2.569 34.595 6.903 11.051 12.548 2.121 2.925 35.548
Mobil Mobil Mobil Mobil Mobil
T a h u n/ Penumpang/ Bis/ Gerobak/ Gandeng/ Tempel/ Jumlah/
Y e a r Passanger Buses Trucks Trailers Attached Total
Car Cars (1) (2) (3) (4) (5) (6) (7) 2000 2001 2002 2003 7.238 11.547 12.850 2.156 2.897 36.688 6.541 11.403 15.712 2.198 3.921 39.775 4.014 11.036 16.544 2.494 5.089 39.177 3.144 10.120 17.596 2.791 5.671 39.322 5.744 9.717 17.810 2.394 5.424 41.089 5.872 7.711 17.599 1.668 3.866 36.716 5.525 8.122 21.282 1.874 8.634 45.437 Sumber : Dinas Perhubungan Kota Surabaya Source : Transportation and Communication Service of Surabaya City Keterangan/Note : *)Angka diperbaiki/Number is revised 2004 2005 2006 2007 2008 2009 2010
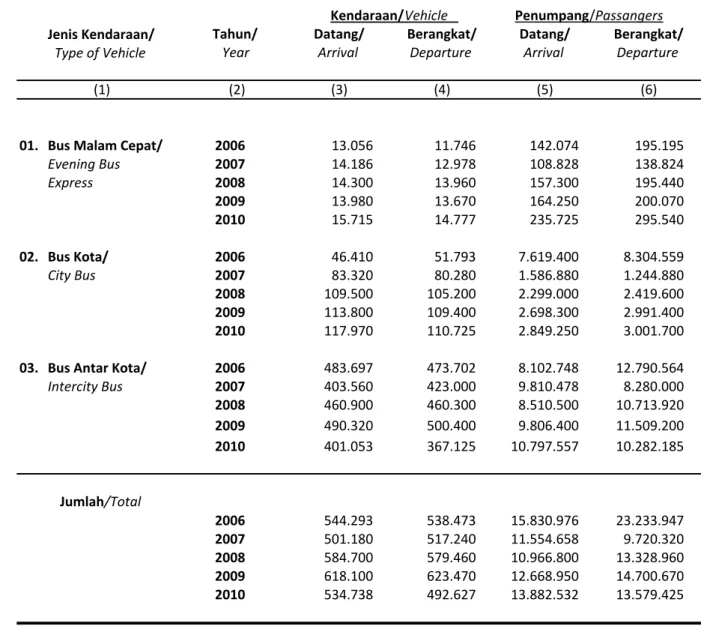
Tabel : 08.01.10 Arus Kendaraan dan Penumpang yang Datang dan Table Berangkat menurut Jenis Kendaraan Melalui Terminal Purabaya Number of Arrival and Departure of Vehicle and Passanger by Type of Vehicle Through Purabaya Station 2006 ‐ 2010 Jenis Kendaraan/ Type of Vehicle 01. Bus Malam Cepat/ 2006 13.056 11.746 142.074 195.195 Evening Bus 2007 14.186 12.978 108.828 138.824 Express 2008 14.300 13.960 157.300 195.440 2009 13.980 13.670 164.250 200.070 2010 15.715 14.777 235.725 295.540 02. Bus Kota/ 2006 46.410 51.793 7.619.400 8.304.559 (3) (4) (5) Kendaraan/Vehicle Penumpang/Passangers
Tahun/ Datang/ Berangkat/ Datang/ Berangkat/
(6)
Year Arrival Departure Arrival Departure
(1) (2) 02. Bus Kota/ 2006 46.410 51.793 7.619.400 8.304.559 City Bus 2007 83.320 80.280 1.586.880 1.244.880 2008 109.500 105.200 2.299.000 2.419.600 2009 113.800 109.400 2.698.300 2.991.400 2010 117.970 110.725 2.849.250 3.001.700 03. Bus Antar Kota/ 2006 483.697 473.702 8.102.748 12.790.564 Intercity Bus 2007 403.560 423.000 9.810.478 8.280.000 2008 460.900 460.300 8.510.500 10.713.920 2009 490.320 500.400 9.806.400 11.509.200 2010 401.053 367.125 10.797.557 10.282.185 2006 544.293 538.473 15.830.976 23.233.947 2007 501.180 517.240 11.554.658 9.720.320 2008 584.700 579.460 10.966.800 13.328.960 2009 618.100 623.470 12.668.950 14.700.670 2010 534.738 492.627 13.882.532 13.579.425 Sumber : Dinas Perhubungan Kota Surabaya Source : Transportation and Communication Service of Surabaya City SURABAYA DALAM ANGKA 2011 Jumlah/Total 346
Tabel : 08. 01.11 Arus Kendaraan dan Penumpang yang Datang Table dan Berangkat Melalui Terminal Purabaya Flow of Departure and Arrival of Vehicles and Passangers Through Purabaya Station 2005 ‐ 2010 646.587 666.508 21.450.976 23.354.475 548.546 537.241 16.549.381 21.290.318 Datang/ Berangkat/
Arrival Departure Arrival Departure
(1) (2) (3) (4) (5) T a h u n/ Year Kendaraan/Vehicles Penumpang/Passangers Datang/ Berangkat/ 2005 2006 417.600 435.960 6.480.000 7.920.000 584.700 579.460 10.966.800 13.328.960 618.100 623.470 12.668.950 14.700.670 534.738 492.627 13.882.532 13.579.425 Sumber : Dinas Perhubungan Kota Surabaya Source : Transportation and Communication Service of Surabaya City Keterangan/Note : *) Angka diperbaiki/Number is revised 2007 2008 2009 2010
Tabel : 08.01.12 Arus Kendaraan dan Penumpang yang Datang Table dan Berangkat menurut Jenis Kendaraan Melalui Terminal Joyoboyo Departure and Arrival of Vehicles and Passangers by Type of Vehicles Through Joyoboyo Station 2005 ‐ 2010 Jenis Kendaraan/ 01. Bus Kota/ 2005 41.782 41.782 1.671.280 2.089.100 City Bus 2006 41.760 41.760 501.120 835.200 2007 52.503 52.503 1.050.060 1.575.090 2008 4.531 4.490 45.310 89.800 2009 19.069 18.472 438.577 528.480 2010 7.855 6.891 164.955 165.384 02. Angkutan 2005 1.438.446 1.438.446 8.630.676 14.384.460 (6) Kendaraan/Vehicles Penumpang/Passangers Tahun/
Type of Vehicles Year Datang/ Berangkat/ Datang/ Berangkat/
Arrival Departure Arrival Departure
(1) (2) (3) (4) (5) 02. Angkutan 2005 1.438.446 1.438.446 8.630.676 14.384.460 Kota/Bemo/ 2006 1.620.334 1.620.334 9.722.004 16.203.340 Medium City 2007 1.085.596 1.085.596 5.427.980 13.027.152 Bus 2008 923.723 923.230 4.618.615 8.309.070 2009 846.495 845.267 5.233.758 7.611.516 2010 665.760 612.400 3.328.800 4.286.800 Jumlah/Total 2005 1.480.228 1.480.228 10.301.956 16.473.560 2006 1.662.094 1.662.094 10.223.124 17.038.540 2007 1.138.099 1.138.099 6.478.040 14.602.242 2008 928.254 927.720 4.663.925 8.398.870 2009 865.564 863.739 5.672.335 8.139.996 2010 673.615 619.291 3.493.755 4.452.184 Sumber : Dinas Perhubungan Kota Surabaya Source : Transportation and Communication Service of Surabaya City SURABAYA DALAM ANGKA 2011 348
Tabel : 08.01.13 Arus Kendaraan dan Penumpang yang Datang Table dan Berangkat menurut Jenis Kendaraan Melalui Terminal Tambakoso Wilangon Departure and Arrival of Passangers and Vehicles by Type of Vehicles Through Tambakoso Wilangon Station 2005 ‐ 2010 Jenis Kendaraan/ Tahun/ Type of Vehicles Year 01. Bus Kota/ 2005 42.410 38.138 1.774.518 1.929.093 City Bus 2006 16.657 19.336 867.193 1.023.751 2007 16.191 18.428 705.350 758.739 2008 23.045 20.895 780.486 721.951 2009 21.449 19.449 789.368 713.259 2010 20.952 19.883 766.650 715.687 (6) Kendaraan/Vehicles Penumpang/Passangers
Datang/ Berangkat/ Datang/ Berangkat/
Arrival Departure Arrival Departure
(1) (2) (3) (4) (5) 02. Angkutan 2005 184.413 184.413 737.652 922.065 Kota/Bemo/ 2006 278.375 278.375 1.670.250 2.227.000 Medium City 2007 164.603 164.603 832.364 1.151.075 Bus 2008 161.872 162.052 891.535 1.351.819 2009 164.694 161.946 835.913 792.911 2010 168.879 168.879 1.003.756 1.003.756 03. Bus Antar Kota/ 2005 106.337 102.154 1.669.144 1.819.564 Intercity Bus 2006 87.113 94.686 1.090.977 1.479.079 2007 89.185 96.418 1.023.989 1.259.388 2008 87.072 94.048 873.365 1.090.700 2009 78.559 88.884 776.803 937.503 2010 89.596 91.716 913.475 1.003.267 Jumlah/Total 2005 333.160 324.705 4.181.314 4.670.722 2006 269.979 279.449 2.561.703 3.169.202 2007 271.989 276.995 2.545.386 3.164.470 2008 271.989 276.995 2.545.386 3.164.470 2009 264.702 270.279 2.402.084 2.443.673 2010 279.427 280.478 2.683.881 2.722.710
Tabel : 08.01.14 Arus Kendaraan dan Penumpang yang Datang Table dan Berangkat menurut Jenis Kendaraan Melalui Terminal Joyoboyo Departure and Arrival of Vehicles and Passangers by Type of Vehicles Through Bratang Station 2005 ‐ 2010 Jenis Kendaraan/ Type of Vehicles 01. Angkutan 2005 803.040 803.040 872.255 2.616.768 Kota/Bemo/ 2006 408.560 408.560 1.932.229 2.254.807 Medium City 2007 190.546 190.546 1.333.822 2.286.552 Bus 2008 140.119 113.113 700.595 1.131.120 2009 154.788 154.017 1.083.516 1.386.453 2010 665.760 612.400 3.328.800 4.286.800 02 Bus Kota/ 2005 6 720 6 720 175 500 351 000 Datang/ Arrival Berangkat/ Departure Datang/ Arrival Berangkat/ Departure (1) (2) (3) (4) Kendaraan/Vehicles Penumpang/Passangers Tahun/ (5) (6) Year 02. Bus Kota/ 2005 6.720 6.720 175.500 351.000 City Bus 2006 7.714 7.714 280.650 319.001 2007 5.928 5.928 71.136 148.200 2008 11.952 11.593 179.280 289.825 2009 12.559 12.052 288.857 361.560 2010 7.855 6.891 164.955 165.384 03. Bus Antar kota 2009 78.559 88.884 776.803 937.503 2010 75.789 47.199 1.136.835 934.980 Jumlah/Total 2005 809.760 809.760 1.050.755 2.967.768 2006 196.474 196.474 1.404.958 2.434.752 2007 152.071 124.706 879.875 1.420.945 2008 152.071 124.706 879.875 1.420.945 2009 167.347 166.069 1.372.373 1.747.713 2010 749.404 666.490 4.630.590 5.387.164 Sumber : Dinas Perhubungan Kota Surabaya Source : Transportation and Communication Service of Surabaya City 350 SURABAYA DALAM ANGKA 2011
Tabel : 08.01.15 Banyaknya Kendaraan Angkutan Penumpang Umum Table Dalam Kota menurut Route / Jalur yang Ditempuh Number of Intra‐City Public Transportations by Routes 2010 K o d e L y n Route/Code 1. C Pasar Loak‐Sedayu‐Karang Menjangan PP 109 2. D Joyoboyo‐Pasar Turi‐Sidorame PP 151 3. E Petojo‐Tanjungsari‐Balongsari PP 85 4. F Joyoboyo‐Pegirian‐Endrosono PP 141 5. G Joyoboyo‐Kr Menjangan/L Santri/K Pilang PP 312 6. H2 Pasar Wonokromo‐Pagesangan PP 15 7. H2P Pasar Wonokromo‐Terminal Menanggal PP 47 8. I Kupang‐Benowo PP 72 9. K Ujung Baru‐Kalimas Barat/Pasar Loak PP 87 10. L2 Ujung Baru‐Sasak‐Petojo PP 53 11. M Joyoboyo‐Dinoyo‐Kayun‐Kalimas Barat PP 130 12. N Kalimas Barat‐Menur‐Bratang PP 109 No (2) (3) Jalur yang Ditempuh/Route Banyak Kendaraan Number of Vehicles 12. N Kalimas Barat‐Menur‐Bratang PP 109 13. TWM Tambak Wedi‐Petojo‐Keputih PP 29 14. O Kalimas Barat‐Keputih PP 134 Tambak Oso Wilangun (Depan SPBU)‐Petojo PP/ Keputih‐ PP 16. P Joyoboyo‐Gebang Putih‐Kenjeran/Petojo‐ 155 Ketintang/Joyoboyo‐Karang Menjangan‐Kenjeran PP Joyoboyo‐Karang Menjangan‐Kenjeran PP 17. Q Kalimas Barat‐Bratang PP 116 18. R Kalimas Barat‐Kapasan‐Kenjeran PP 80 19. S Joyoboyo‐Bratang‐Kenjeran PP 70 20. T1 Margorejo‐Joyoboyo‐Sawahan‐Pasar Loak PP 29 21. T2 Joyoboyo‐Mulyosari‐Kenjeran PP 82 22. U Joyoboyo‐Rungkut‐Wonorejo/Joyobekti PP 98 23. V Joyoboyo‐Tambakrejo PP 114 24. W Dukuh Kupang‐Kapas Krampung‐Kenjeran PP 119 25. Y Joyoboyo‐Demak PP 125 26. Z Kalimas Barat‐Benowo PP 120 27. TV Joyoboyo‐Citra Raya/Manukan Kulon/Banjar Sugihan PP 108 28. DP Kalimas Barat/Petekan‐Manukan Kulon PP 68 29. Z 1 Benowo‐Ujung Baru PP 104 30. J Joyoboyo‐Kalianak PP 90 31. BK Bangkingan‐Karang Pilang PP 17 (WK) 15. 101
Tabel : 08.01.15 Lanjutan/ Tabel Continued K o d e No L y n Route/Code (1) (2) Sub Jumlah 3.070 32. DA Kalimas Barat‐Citra Raya PP 57 33. JTK Joyoboyo‐Tambak Klanggri PP 4 34. JTK2 Joyoboyo‐Medokan Ayu PP 103 35. R1 Kalimas Barat‐Nambangan‐Kenjeran PP 25 36. WLD Wonoarum‐Pasar Loak‐Dukuh Kupang PP 91 37. WLD2 Bulak Banteng‐Dukuh Kupang PP 7 38. RT Rungkut‐Pasar Turi PP 66 39. LMJ Lakarsantri‐Manukan Kulon‐Kalimas Barat PP 121 40. BM Bratang‐Perumnas Menanggal PP 41 41. JBMN Joyoboyo‐Gunung Anyar PP 53 42. LK Manukan Kulon‐Pasar Loak‐Kenjeran PP 103 43. GL Pasar Loak‐Gadung PP 49 Banyak Kendaraan/ Number of Vehicles (3) (4) Jalur yang Ditempuh/Route 43. GL Pasar Loak Gadung PP 49 44. JK Joyoboyo‐Kalijudan‐Kenjeran PP 36 45. IM Benowo‐Simokerto PP 65 46. WB Wonosari‐Bratang PP 70 47. DKM Dukuh Kupang‐Menanggal PP 50 48. DKB Dukuh Kupang‐Benowo PP 16 49. BJ Benowo‐Kalimas Barat PP 158 50. RDK Dukuh Kupang‐Benowo PP 76 51. UBB Ujung Baru‐Bratang PP 34 52. UBK Ujung Baru‐Kenjeran PP 48 53. JMK Kenjeran‐Kalimas Barat PP 59 54. KIP 1 Kutisari Indah‐Petojo PP (Lewat Tengah) PP 26 55. KIP 2 Kutisari Indah‐Petojo PP (Lewat Timur) PP 37 56. GS Gunung Anyar‐Sidorame PP 58 57. RBK Rungkut Barata‐Kenjeran PP 51 58. R2 Kalimas Barat‐Teluk Langsa‐Kenjeran PP 4 1.447 Sumber : Dinas Perhubungan Kota Surabaya Source : Transportation and Communication Service of Surabaya City 352 SURABAYA DALAM ANGKA 2011 J u m l a h/T o t a l