LAPORAN AKHIR
PENELITIAN PASCASARJANA
DANA ITS 2020
ANALISIS SPATIAL DAN TEMPORAL PERUBAHAN
LUASAN MANGROVE DI WILAYAH PANTAI UTARA
JAWA TIMUR SEBAGAI PELINDUNG PANTAI ALAMI
DALAM MENDUKUNG PROGRAM BUILDING WITH
NATURE
Tim Peneliti :
Muhammad ZIKRA (Departemen Teknik Kelautan/FTK)
Hasan IKHWANI (Departemen Teknik Kelautan/FTK)
Anita Wardhani (Mahasiswa Pascasarjana Kelautan)
DIREKTORAT RISET DAN PENGABDIAN KEPADA MASYARAKAT
Sesuai Surat Perjanjian
Pelaksanaan
Penelitian No: 925/PKS/ITS/2020
Daftar Isi
Daftar Isi ... i
Daftar Tabel ... ii
Daftar Gambar ... iii
Daftar Lampiran ... iv
BAB I RINGKASAN ... 2
BAB II HASIL PENELITIAN ... 3
BAB III STATUS LUARAN ... 4
BAB IV PERAN MITRA (UntukPenelitian Kerjasama Antar Perguruan Tinggi) ... 5
BAB V KENDALA PELAKSANAAN PENELITIAN ... 6
BAB VI RENCANA TAHAPAN SELANJUTNYA ... 7
BAB VII DAFTAR PUSTAKA ... 8
BAB VIII LAMPIRAN ... 10
Daftar Tabel
Tabel 1. Data Kota dan Kecamatan di Pesisir Pantai Utara Jawa Timur ... 4
Tabel 2. Luasan Mangrove di Kabupaten Tuban ... 8
Tabel 3. Luasan Mangrove di Kabupaten Lamongan ... 9
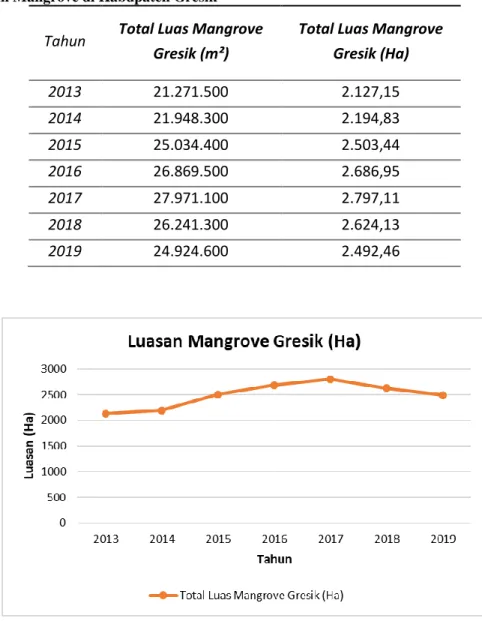
Tabel 4. Luasan Mangrove di Kabupaten Gresik ... 10
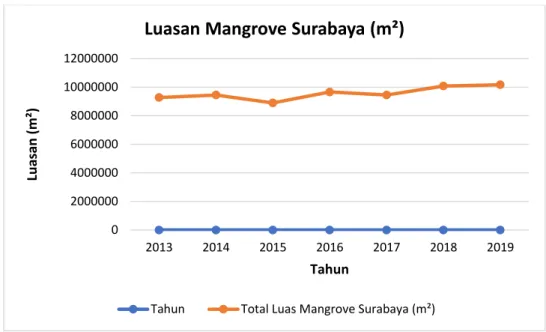
Tabel 5. Luasan Mangrove di Kota Surabaya ... 10
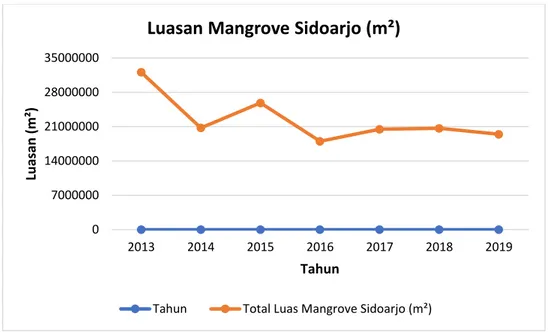
Tabel 6. Luasan Mangrove di Kabupaten Sidoarjo ... 11
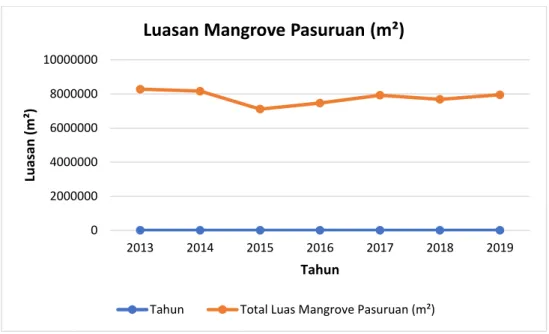
Tabel 7. Luasan Mangrove di Kabupaten Pasuruan ... 12
Tabel 8. Luasan Mangrove di Kabupaten Probolinggo ... 13
Tabel 9. Luasan Mangrove di Kabupaten Situbondo ... 14
Tabel 10. Total Potential Damage (million rupiah/year) ... 24
Tabel 11. Range of each vulnerability factor ... 26
Daftar Gambar
Gambar 1. Peta Lokasi Penelitian ... 3
Gambar 2. Perbandingan Citra Landsat Sebelum dan Sesudah dilakukan Pemotongan ... 6
Gambar 3. Perbandingan Citra Landsat Sebelum dan Sesudah dilakukan Pan sharpening ... 6
Gambar 4 Contoh Perubahan Luasan Mangrove di wilayah Kota Surabaya ... 8
Gambar 5 Shoreline Change Envelope ... 15
Gambar 6 Net Shoreline Movement ... 16
Gambar 7 End Point Rate ... 16
Gambar 8 Gross Regional Domestic Product per Capita ... 24
Gambar 9 Peta Kerentanan ... 1
Gambar 10 Peta Kerentanan ... 2
BAB I RINGKASAN
Proses alam yang berhubungan dengan daerah pantai berlangsung dalam variasi ruang (spatial) dan waktu (temporal), yaitu dalam periode waktu singkat (menit, jam) dan pada areal yang sempit ataupun luas. Daerah pantai merupakan lingkungan yang dinamis dimana proses erosi, sedimen transport dan sedimentasi memberi kontribusi terus-menerus terhadap perubahan fisik daerah pantai tersebut. Perubahan yang terjadi akibat proses-proses alam ini termasuk didalamnya akibat perubahan iklim global (global warming) dan intervensi atau aktivitas manusia. Identifikasi terhadap perubahan yang terjadi di daerah pantai perlu dilakukan untuk mengetahui dan mengantisipasi dampak negatif yang bisa terjadi terhadap aktivitas/keberadaan manusia di daerah pantai.
Peningkatan aktivitas manusia semakin meningkat disebabkan oleh bertambahnya jumlah industri dan pemukiman penduduk yang membutuhkan pembukaan lahan-lahan baru. Untuk dapat memenuhi kebutuhan tersebut, maka kawasan hutan mangrove sebagai pelindung alami di wilayah pesisir pantai mulai banyak dialihfungsikan menjadi area pemukiman dan industri. Hal ini secara langsung dapat menimbulkan dampak ekologis yang mengancam kelestarian lingkungan pesisir karena hutan mangrove yang awalnya berfungsi sebagai habitat, juga dapat menghilangkan fungsi hutan mangrove sebagai pelindung pantai alami dalam mencegah serangan gelombang laut maupun melindungi pantai dari abrasi. Oleh karena identifikasi terhadap perubahan yang terjadi di pantai ini membutuhkan kegiatan pemantauan yang bersifat kontinu.
Penelitian ini bertujuan untuk untuk mengetahui dan mengidentifikasi perubahan yang terjadi didaerah pantai terutama kawasan ekosistem mangrove akibat dari pengaruh fenomena perubahan iklim (kenaikan muka air laut, gelombang pasang) di sepanjang wilayah pantai utara Jawa Timur. Hal ini disebabkan masalah perubahan garis pantai akibat proses-proses alam termasuk didalamnya perubahan iklim dan aktivitas manusia merupakan masalah penting yang banyak terjadi di Indonesia, termasuk daerah pantai utara Jawa Timur salah satunya. Analisa ini difokuskan pada perubahan luasan kawasan ekosistem mangrove yang berfungsi sebagai pelindung pantai alami menggunakan data pengamatan citra satelit Lansat 7 dan 8. Dari hasil analisa ini diharapkan diketahui wilayah-wilayah pesisir di pantai utara Jawa Timur, Indonesia yang mengalami perubahan secara significant selama kurun 10 tahun lebih (2010-2019).
Dengan mengetahui kondisi ekosistem mangrove yang ada di pesisir pantai, maka diharapkan dapat diperoleh berbagai bentuk informasi dan data yang akurat dan mutahir dalam mendukung program ‘Building with Nature’ di pantai utara Jawa Timur. Selain itu informasi ini diharapkan berguna bagi masyarakat dan pemerintah dalam menentukan langkah-langkah kebijakan dan perencanaan pembangunan yang berkelanjutan serta untuk mitigasi bencana yang mungkin terjadi diwilayah pesisir dan pantai.
Ringkasan penelitian berisi latar belakang penelitian,tujuan dan tahapan metode penelitian, luaran yang ditargetkan, kata kunci
BAB II HASIL PENELITIAN
2.1Kemajuan Penelitian.Pada kegiatan penelitian ini hasil yang telah dilakukan adalah telah terkumpulnya data sekunder maupun primer. Beberapa kegiatan pengumpulan data sekunder dilakukan dengan mendatangi berbagai instansi terkait terutama Dinas Kelautan dan Perikanan Provinsi dan Kabupaten/Kota. Beberapa data yang dikumpulkan terutama adalah data kondisi lingkungan, data hidro-oceanografi dan data sosial masyarakat. Selain itu, data Citra Satelit dan data-data
stakeholders yang berwenang dalam pengelolaan wilayah pesisir dan laut juga menjadi salah satu prioritas data yang dibutuhkan.
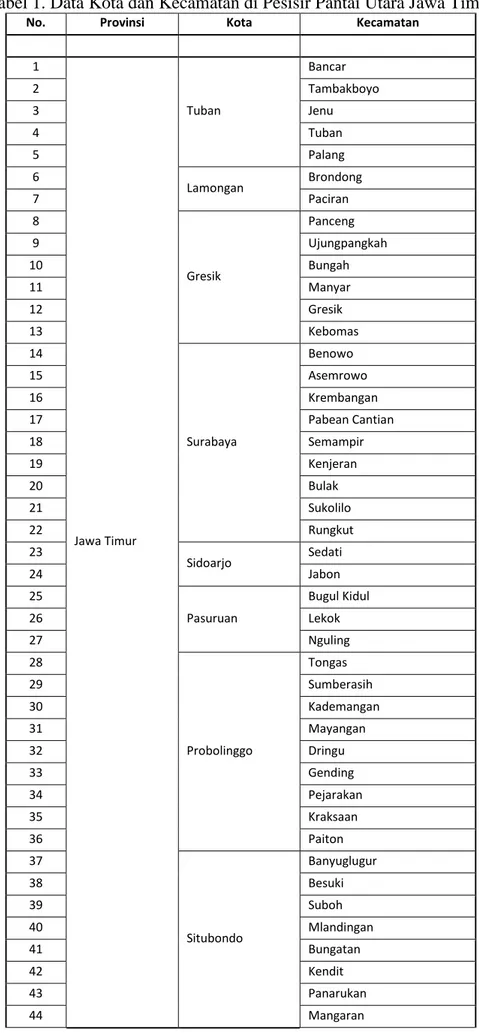
Pengumpulan data sekunder juga dilakukan melalui wawancara langsung dengan penduduk diwilayah pesisir. Hal-hal yang dibahas terutama mengenai kondisi lingkungan pantai serta berbagai keluhan masyarakat terkait perubahan kondisi alam disekitar wilayah mereka. Pengumpulan data untuk penelitian ini berada pada di daerah sepanjang pesisir utara Jawa Timur, meliputi Kabupaten Tuban, Kabupaten Lamongan, Kabupaten Gresik, Kota Surabaya, Kabupaten Sidoarjo, Kabupaten dan Kota Pasuruan, Kabupaten dan Kota Probolinggo serta Kabupaten Situbondo seperti terlihat pada gambar dibawah.
Tabel 1. Data Kota dan Kecamatan di Pesisir Pantai Utara Jawa Timur
No. Provinsi Kota Kecamatan
1 Jawa Timur Tuban Bancar 2 Tambakboyo 3 Jenu 4 Tuban 5 Palang 6 Lamongan Brondong 7 Paciran 8 Gresik Panceng 9 Ujungpangkah 10 Bungah 11 Manyar 12 Gresik 13 Kebomas 14 Surabaya Benowo 15 Asemrowo 16 Krembangan 17 Pabean Cantian 18 Semampir 19 Kenjeran 20 Bulak 21 Sukolilo 22 Rungkut 23 Sidoarjo Sedati 24 Jabon 25 Pasuruan Bugul Kidul 26 Lekok 27 Nguling 28 Probolinggo Tongas 29 Sumberasih 30 Kademangan 31 Mayangan 32 Dringu 33 Gending 34 Pejarakan 35 Kraksaan 36 Paiton 37 Situbondo Banyuglugur 38 Besuki 39 Suboh 40 Mlandingan 41 Bungatan 42 Kendit 43 Panarukan 44 Mangaran
45 Kapongan 46 Arjasa 47 Jangkar 48 Asembagus 49 Banyuputih 2.2Data
Data yang dikumpulkan dalam penelitian ini berupa data sekunder dari berbagai instansi terkait seperti berikut :
1) Data iklim angin dan batimetri diperoleh dari BMKG.
2) Data peta rupa bumi didapat dari Bakosurtanal (http://www.bakosurtanal.go.id/) 3) Data lingkungan di perairan Indonesia menggunakan data satelit. Terutama data citra
satelit LANDSAT 8 yang memiliki resolusi 30 x 30 m. 4) Data ekonomi wilayah pantai utara Jawa Timur. 5) Data penduduk wilayah pantai utara Jawa Timur. 6) Data ekologi wilayah pantai utara Jawa Timur. 7) Data arus diperoleh dari OSCAR
8) Data gelombang diperoleh dari ECMWF.
Untuk perangkat lunak yang digunakan dalam mengolah data dalam penelitian ini adalah sebagai berikut :
ArcGIS 10.5
Digunakan untuk mengolah data citra satelit dalam proses digitasi dan pembuatan peta wilayah, peta luasan mangrove, peta perubahan garis pantai, dan peta kerentanan.
DSAS 5.0
Digunakan untuk menganalisa perubahan garis pantai.
CERA 1.0
Digunakan sebagai plugin di QGIS guna menghitung kerentanan pantai akibat erosi.
2.3Pengolahan Data
Dalam proses pembuatan peta sebaran mangrove, citra Landsat akan diolah dengan melewati beberapa tahap, diantaranya seperti komposit warna dan pemotongan citra, penajaman citra, pemisahan objek dan perhitungan luasan. Tahap-tahap tersebut akan dijelaskan secara lebih rinci dalam sub bab dibawah ini.
2.3.1 Komposit Warna dan Pemotongan Citra Landsat
Tahap pengolahan citra satelit untuk ekosistem mangrove, diharuskan memilih beberapa kanal yang masuk dalam kriteria pemetaan ekosistem mangrove. Hal ini dikarenakan Landsat 8 mempunyai beberapa kanal dengan memiliki panjang gelombang dan spesifikasi yang berbeda pada tiap jenisnya. Menurut Pasaribu (2008), pembentukan citra komposit dimaksudkan untuk mendapat gambaran umum mengenai data yang akan diolah. Citra komposit penggabungan kanal (RGB) 5,6 4 untuk Landsat 7 dan Landsat 8.
koordinat akhir merupakan titik koordinat akhir dari citra hasil pemotongan. Hasilnya akan terbentuk bangun segi empat dimana pada tiap pixel yang ada pada area koordinat tertentu akan disimpan dalam citra yang baru (Informatika, 2014).
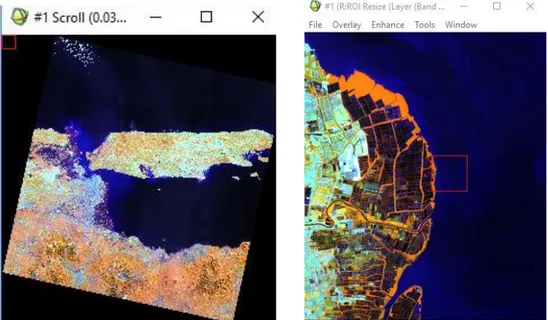
Proses ini dilakukan setelah melakukan penggabungan kanal, apabila sudah tertampil pada layar display, perbesar pada daerah yang ingin diteliti ekosistem mangrovenya. Simpan gambar tersebut dengan format (.ers).
Gambar 2. Perbandingan Citra Landsat Sebelum dan Sesudah dilakukan Pemotongan 2.3.2 Penajaman Citra Dengan Metode Image Sharpening
Cara-cara penajaman citra (image sharpening) digunakan secara automatik untuk menggabungkan (fusi) suatu citra warna, multi spektral, atau hyper spektral yang mempunyai resolusi spasial rendah dengan suatu citra tingkat keabuan yang mempunyai resolusi spasial tinggi dengan melakukan resampling terhadap ukuran elemen citra (pixel) resolusi spasial tinggi tersebut. Penajaman citra dengan menggunakan data citra Pankromatik (image pansharpening) adalah dengan menggabungkan data citra multispektral (warna) yang mempunyai resolusi rendah dengan citra pankromatik (hitam-putih atau tingkat keabuan) yang mempunyai resolusi tinggi (Sitanggang, 2008).
2.3.3 Klasifikasi Citra
Klasifikasi citra adalah proses mengatur, mengurutkan atau mengelompokkan piksel dalam beberapa kelas berdasarkan pada kriteria atau kategori objek. Setiap piksel di setiap kelas diasumsikan memiliki karakteristik homogen (Prahasta 2008).
Klasifikasi yang digunakan dalam penelitian ini adalah klasifikasi terbimbing atau supervised classification dengan metode klasifikasi maksimum likelihood. Maximum likelihood secara kuantitatif mengevaluasi varian dan korelasi pola respons dari kategori spektral ketika mengklasifikasikan piksel yang tidak diketahui (Prahasta, 2008).
2.3.4 Normalized Difference Vegetation Index (NDVI)
Dalam membedakan objek vegetasi mangrove dengan vegetasi jenis lain (non-mangrove) digunakan analisis NDVI. Dengan transformasi NDVI vegetasi mangrove akan terlihat lebih kontras dengan proporsi tingkat kecerahan yang lebih tinggi (Prahasta, 2008). Ini dikarenakan dalam pemanfaatan NDVI menggunakan gelombang sinar inframerah dekat (NIR) dan gelombang merah (R), yang mana gelombang NIR sangat peka akan klorofil pada vegetasi.
𝑁𝐷𝑉𝐼 = 𝑘𝑎𝑛𝑎𝑙 𝑁𝐼𝑅 (𝑏𝑎𝑛𝑑 5) − 𝑘𝑎𝑛𝑎𝑙 𝑅𝑒𝑑 (𝑏𝑎𝑛𝑑 4) 𝑘𝑎𝑛𝑎𝑙 𝑁𝐼𝑅 (𝑏𝑎𝑛𝑑 5) + 𝑘𝑎𝑛𝑎𝑙 𝑅𝑒𝑑 (𝑏𝑎𝑛𝑑 4)
NDVI mempunyai rentang nilai dari -1,0 hingga 1.0. Awan, air, dan objek non-vegetasi mempunyai nilai NDVI kurang dari nol. Nilai yang mewakili vegetasi terdapat pada rentang 0.1 hingga 0.7. Jika nilai indeks lebih tinggi dari rentang ini berarti penutupan vegetasi tersebut lebih sehat (Lillesand dan Kiefer 1990). Nilai threshold masing-masing kelas vegetasi ditentukan dengan melakukan pengecekan lapang serta menggunakan aplikasi Google Earth dan Google Street View untuk ground truth check.
2.3.5 Perhitungan Luasan
Proses perhitungan luasan bertujuan untuk melihat perubahan luasan mangrove mulai tahun 2013 hingga tahun 2019. Perhitungan luasan mangrove diproses dengan metode calculate geometric. Menurut Utama (2005), calculate geometric adalah prosedur perhitungan otomatis pada ArcMap berdasarkan bentuk geometri dari data GIS yang tergambar dari sistem koordinat yang digunakan. Pada proses ini digunakan data vector sehingga pada proses klasifikasi ini data raster akan dikonversi ke dalam data vector. Menurut Yekti et al. (2013), konversi data raster menjadi data vector dilakukan agar mempermudah perhitungan luas perubahan tutupan lahan dari citra hasil klasifikasi yang sudah dipotong. Konversi data ini menggunakan salah satu proses pada software ENVI yang mengubah data raster menjadi data vector dalam bentuk
shapefile (.shp). Kemudian dari shapefile tersebut akan dihitung luasannya melalui proses
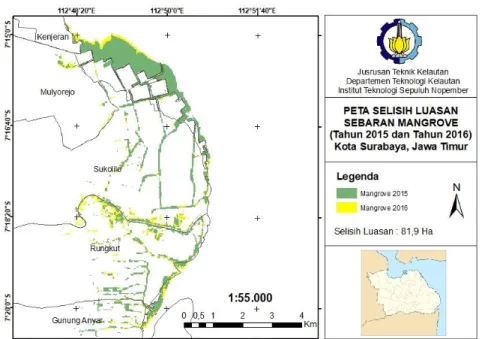
Gambar 4 Contoh Perubahan Luasan Mangrove di wilayah Kota Surabaya
2.4Analisa dan Pembahasan
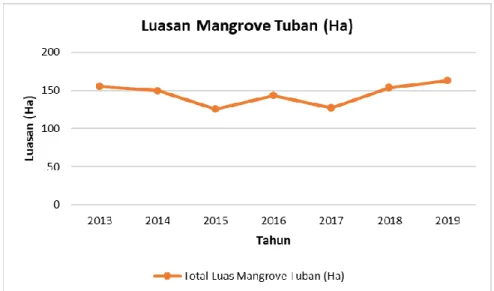
2.4.1 Kabupaten Tuban
Tabel 2. Luasan Mangrove di Kabupaten Tuban
Tahun Total Luas Mangrove
Tuban (m²)
Total Luas Mangrove Tuban (Ha) 2013 1.554.917 155,491 2014 1.495.800 149,58 2015 1.257.300 125,73 2016 1.435.451 143,545 2017 1.273.500 127,35 2018 1.537.906 153,790 2019 1.630.569 163,056
2.4.2 Kabupaten Lamongan
Tabel 3. Luasan Mangrove di Kabupaten Lamongan
Tahun Total Luas Mangrove
Lamongan (m²)
Total Luas Mangrove Lamongan (Ha) 2013 800.768 80,076 2014 783.36 78,336 2015 768 76,8 2016 870.735 87,073 2017 888.492 88,849 2018 878.062 87,806 2019 691.2 69,12
2.4.3 Kabupaten Gresik
Tabel 4. Luasan Mangrove di Kabupaten Gresik
Tahun Total Luas Mangrove
Gresik (m²)
Total Luas Mangrove Gresik (Ha) 2013 21.271.500 2.127,15 2014 21.948.300 2.194,83 2015 25.034.400 2.503,44 2016 26.869.500 2.686,95 2017 27.971.100 2.797,11 2018 26.241.300 2.624,13 2019 24.924.600 2.492,46 2.4.4 Kota Surabaya
Hasil perhitungan perubahan luasan mangrove di Kota Surabaya dengan calculate geometric pada software ArcGIS 10.5 mulai tahun 2013 hingga tahun 2019 ditampilkan pada Tabel
Tabel 5. Luasan Mangrove di Kota Surabaya
Tahun Total Luas Mangrove Surabaya (m²)
Total Luas Mangrove Surabaya (Ha) 2013 9274078 883 2014 9450189 921 2015 8899200 861 2016 9657900 933
2017 9448200 917 2018 10080675 984 2019 10169357 982 2.4.5 Kabupaten Sidoarjo
Hasil perhitungan perubahan luasan mangrove di Kabupaten Sidoarjo dengan
calculate geometric pada software ArcGIS 10.5 mulai tahun 2013 hingga tahun 2019 ditampilkan pada Tabel
Tabel 6. Luasan Mangrove di Kabupaten Sidoarjo
Tahun Total Luas
Mangrove Sidoarjo (m²)
Total Luas Mangrove Sidoarjo (Ha) 2013 32101410 2994 2014 20746350 1946 2015 25833187 2378 2016 18016200 1701 2017 20466000 1927 2018 20659692 1942 2019 19437803 1863 0 2000000 4000000 6000000 8000000 10000000 12000000 2013 2014 2015 2016 2017 2018 2019 Lu asan ( m ²) Tahun
Luasan Mangrove Surabaya (m²)
2.4.6 Kabupaten Pasuruan
Hasil perhitungan perubahan luasan mangrove di Kabupaten Pasuruan dengan
calculate geometric pada software ArcGIS 10.5 mulai tahun 2013 hingga tahun 2019 ditampilkan pada Tabel
Tabel 7. Luasan Mangrove di Kabupaten Pasuruan
Tahun Total Luas
Mangrove Pasuruan (m²)
Total Luas Mangrove Pasuruan (Ha 2013 8280783 781 2014 8162827 767 2015 7112850 657 2016 7464150 686 2017 7927950 740 2018 7683300 723 2019 8280783 745 0 7000000 14000000 21000000 28000000 35000000 2013 2014 2015 2016 2017 2018 2019 Lu asan ( m ²) Tahun
Luasan Mangrove Sidoarjo (m²)
2.4.7 Kabupaten Probolinggo
Hasil perhitungan perubahan luasan mangrove di Kabupaten Probolinggo dengan
calculate geometric pada software ArcGIS 10.5 mulai tahun 2013 hingga tahun 2019 ditampilkan pada Tabel
Tabel 8. Luasan Mangrove di Kabupaten Probolinggo
Tahun Total Luas
Mangrove Probolinggo(m²)
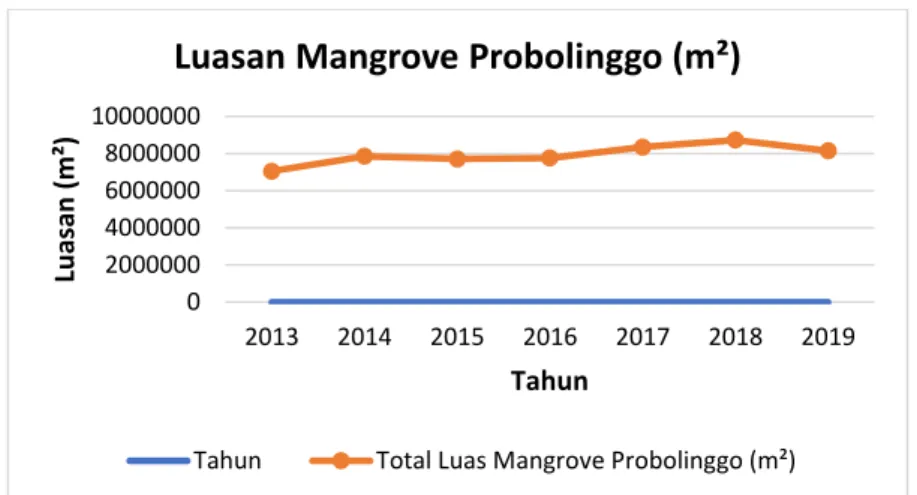
Total Luas Mangrove Probolinggo (Ha) 2013 7058986 671 2014 7860690 759 2015 7710570 733 2016 7758000 739 2017 8350800 799 2018 8734500 835 2019 8150456 771 0 2000000 4000000 6000000 8000000 10000000 2013 2014 2015 2016 2017 2018 2019 Luasa n (m ²) Tahun
Luasan Mangrove Pasuruan (m²)
2.4.8 Kabupaten Situbondo
Tabel 9. Luasan Mangrove di Kabupaten Situbondo
Tahun Total Luas Mangrove
Situbondo (m²)
Total Luas Mangrove Situbondo (Ha) 2013 4.629.273 462,927 2014 5.066.903 506,690 2015 5.227.844 522,784 2016 5.553.152 555,315 2017 5.668.864 566,886 2018 5.555.269 555,526 2019 6.344.573 634,457
2.5Perubahan Garis Pantai
Setelah membuat peta perubahan luasan mangrove di pantai utara Jawa, maka kita bisa menganalisa perubahan garis pantai masing-masing wilayah. Perubahan dapat berupa sedimentasi atau erosi dan dapat terjadi di satu area dengan sedimentasi dan erosi. Dalam
0 2000000 4000000 6000000 8000000 10000000 2013 2014 2015 2016 2017 2018 2019 Luasa n (m ²) Tahun
Luasan Mangrove Probolinggo (m²)
penelitian ini analisa perubahan garis pantai dilakukan dengan bantuan program DSAS, seperti contoh perubahan garis pantai berikut (lihat: gambar 4.2). Digital Shoreline Analysis System (DSAS) merupakan aplikasi perhitungan perubahan garis pantai milik USGS. Dalam tahap analisa perubahan garis pantai, dilakukan pembuatan transek pada peta hasil digitasi perubahan garis pantai. Transek ialah garis atau jalur yang digunakan untuk menghitung dan menganalisa daerah penelitian. Transek yang digunakan ialah kumpulan garis tegak lurus dengan garis pantai acuan atau baseline dan memanjang sepanjang garis pantai pada daerah penelitian. Pada analisa ini jarak baseline yang digunakan ialah sejauh 150 meter yang dibatasi dengan buffer dalam ArcGis.
Profil dari transek pada tiap daerah memiliki jarak antar transek sebesar 300 m, smooting
tegakan-lurus sebesar 500 dan panjang maksimum 900 m dari garis pantai acuan (baseline)
untuk mendapatkan hasil yang baik. Transek digunakan untuk menghitung perbedaan letak dari garis pantai setiap tahun dengan memotong arah tegak lurus dengan garis pantai yang dianalisa. 33. Transek kemudian digunakan pula untuk menghitung rata-rata tiap analisa Shoreline Change Envelope, Net Shoreline Movement,dan End Point Rate dari penelitian ini.
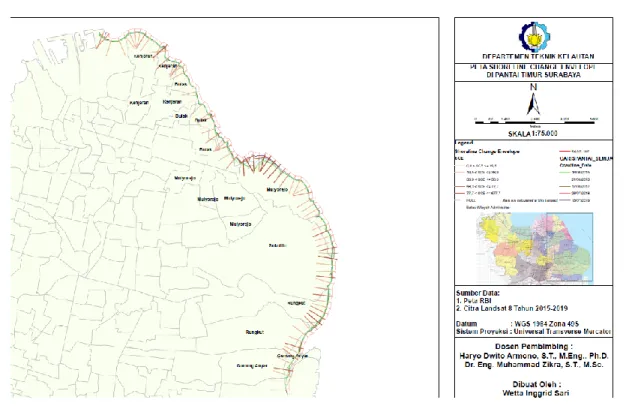
Gambar 6 Net Shoreline Movement
Gambar 7 End Point Rate
2.5.4 Kota Surabaya
2.5.7 Kabupaten Probolinggo
2.6Menentukan Kepadatan Populasi
Untuk menghitung nilai kepadatan populasi, pertama kita harus membuat daftar populasi dan area masing-masing daerah. Dua hal ini dapat dilihat dalam publikasi dari Badan Pusat Statistik (BPS) masing-masing daerah. Kita dapat mencari dengan kata kunci “Kecamatan dalam angka tahun” sesuai dengan nama wilayah dan tahun yang kita butuhkan. Kami menggunakan data ini untuk menghitung kerentanan sosial (lihat: gambar 4.3).
2.7Menentukan Produk Domestik Regional Bruto
Terakhir, kita harus menghitung PDRB per kapita dari setiap wilayah yang kita miliki. tetapi dalam publikasi Statistik Pusat Badan tidak ada PDRB per kecamatan, oleh karena itu kami menganggap Produk Domestik Regional Bruto sama dengan Produk Domestik Regional Bruto kabupaten / kota yang akan dibagi dengan total populasi kabupaten / kota. Meskipun Produk Domestik Regional Bruto dari masing-masing kecamatan di satu kabupaten / kota tidak mungkin sama, kami menganggapnya sama. Kami menggunakan data ini untuk menghitung kerentanan ekonomi.
2.8Analisa Kerentanan
Setiap jenis kerentanan memiliki formula yang berbeda. Rumus setiap kerentanan tergantung pada data yang dikumpulkan dari masing-masing kerentanan. Rumus yang digunakan adalah sebagai berikut:
𝑉𝑎𝑙𝑢𝑒 𝑜𝑓 𝐶ℎ𝑎𝑛𝑔𝑒 =length of time of change(year)erosion (m)
2. Social Vulnerability
𝑃𝑜𝑝𝑢𝑙𝑎𝑡𝑖𝑜𝑛 𝐷𝑒𝑛𝑠𝑖𝑡𝑦 =total population (person)
total area (km2) 3. Economic Vulnerability
𝐺𝑅𝐷𝑃 𝑝𝑒𝑟 𝐶𝑎𝑝𝑖𝑡𝑎 =GRDP of an area (million rupiah)
Total Population (person) 4. Total Potential Damage
𝑇𝑜𝑡𝑎𝑙 𝑃𝑜𝑡𝑒𝑛𝑡𝑖𝑎𝑙 𝐷𝑎𝑚𝑎𝑔𝑒 = 𝑎 𝑥 𝑏 𝑥 𝑐
a : Physical Vulnerability; b : Social Vulnerability; c : Economic Vulnerability.
Daftar perhitungan kerentanan sosial.
Di sini kami hanya menampilkan diagram lingkaran dari provinsi yang berbatasan langsung dengan pantai utara jawa. Dapat dilihat bahwa kepadatan penduduk paling banyak berada di Provinsi Jawa Timur (lihat Gambar 4.3). Untuk populasi masing-masing kecamatan juga dapat dilihat pada Lampiran A.
Gambar 4.3: Kepadatan populasi
Perhitungan Kerentanan Ekonomi
Kemudian kita akan menghitung kerentanan ekonomi. Untuk menghitung kerentanan ekonomi ini, kita membutuhkan nilai PDRB dari setiap kecamatan dan penduduknya. Tetapi karena kita bergantung pada data publikasi dari BPS, maka PDRB dari masing-masing kecamatan tidak memiliki data. Jadi, kami membuat asumsi berikut:
2,279 11,982 1,218 1,499 1,120 BANTEN DKI JKT JABAR JATENG JATIM - 5,000 10,000 15,000
Population Density (person/km2)
Population Density (person/km2)
Setelah membuat asumsi seperti di atas, maka kami membaginya dengan populasi setiap kecamatan untuk mendapatkan nilai PDRB per kapita daerah. Untuk melihat lihat PDRB dari masing-masing kecamatan dapat dilihat pada Lampiran A. Dari grafik di bawah ini, dapat dilihat bahwa PDRB per kapita bahwa pendapatan ekonomi regional terbesar yang berbatasan dengan Pantai Utara Jawa adalah Jakarta Utara, kemudian Surabaya dan sebagainya (lihat: gambar 4.4).
Gambar 8 Gross Regional Domestic Product per Capita
Perhitungan Total Potential Damage.
Setelah semua faktor kerentanan telah dihitung dan diketahui, maka kami akan menghitung total potensi kerusakan dengan mengalikan semuanya. Sebelum mengalikan, kita harus menyamakan semua unit kerentanan. Maka dari itu kerentanan fisik m / tahun akan diubah menjadi ha / tahun, kerentanan sosial orang / km² akan diubah menjadi orang / ha, dan kerentanan ekonomi tetap sama. Kemudian pada akhirnya total potensi kerusakan akan memiliki unit juta / tahun (lihat: tabel 4.2).
Tabel 10. Total Potential Damage (million rupiah/year)
N o. Provinsi Kabupaten/ Kota Kecamatan Erosi (ha/thn) Population Density (jiwa/ha)
Pendapatan per kapita (juta/jiwa) Total PD 110 Jawa Timur Tuban Bancar 0,00 5,47 31,20 0,00 111 Tambakboy o 0,00 5,46 31,20 0,00 112 Jenu 0,00 6,87 31,20 0,00 113 Tuban 0,00 42,33 31,20 0,00 114 Palang 0,00 12,52 31,20 0,00 0 20 40 60 80 100 120 140 160 180 200 Ko ta S era ng Ka b. S era ng K a b . Ta ng era ng K ot a Ja ka rt a U ta ra K a b . B eka si K a b . K a ra wa ng K a b . S ub a ng K a b . I nd ra ma yu K a b . C ire b on K ot a C ire b on K a b . B re b es Ko ta Te ga l Ka b. Te ga l K a b . P ema la ng K a b . P eka lo ng a n K ot a P eka lo ng a n K a b . B a ta ng K a b . K end a l K a b . S ema ra ng K a b . D ema k K a b . Je p a ra K a b . P a ti K a b . R emb a ng K a b . Tu b a n K a b . La mo ng a n Ka b. G re si k K ot a S ura b a ya K a b . S id oa rj o K ot a P a suru a n K a b . P a suru a n K ot a P ro b ol ing g o K a b . P ro b ol ing g o K a b . S itu b ond o
GRDP per Capita
115 Lamongan Brondong 0,00 10,87 20,98 0,00 116 Paciran 0,00 16,37 20,98 0,00 117 Gresik Panceng 0,00 8,39 70,70 0,00 118 Ujungpangk ah 0,69 5,39 70,70 261,68 119 Bungah 0,00 8,53 70,70 0,00 120 Manyar 0,00 11,95 70,70 0,00 121 Gresik 0,00 164,48 70,70 0,00 122 Kebomas 0,00 35,90 70,70 0,00 123 Surabaya Benowo 0,00 22,87 131,81 0,00 124 Asemrowo 0,00 36,96 131,81 0,00 125 Krembanga n 0,00 203,66 131,81 0,00 126 Pabean Cantian 0,00 212,34 131,81 0,00 127 Semampir 0,20 273,16 131,81 7054,1 3 128 Kenjeran 0,00 209,02 131,81 0,00 129 Bulak 0,00 63,96 131,81 0,00 130 Sukolilo 0,00 48,04 131,81 0,00 131 Rungkut 0,00 54,92 131,81 0,00 132 Sidoarjo Sedati 0,00 12,38 64,28 0,00 133 Jabon 0,00 6,70 64,28 0,00 134 Pasuruan Bugul Kidul 0,00 28,97 27,08 0,00 135 Lekok 0,00 16,48 58,62 0,00 136 Nguling 0,00 12,95 58,62 0,00 137 Probolinggo Tongas 0,00 8,86 17,80 0,00 138 Sumberasih 0,00 20,13 17,80 0,00 139 Kademanga n 0,00 35,02 31,87 0,00 140 Mayangan 0,00 72,69 31,87 0,00 141 Dringu 0,00 16,76 17,80 0,00 142 Gending 1,07 11,26 17,80 214,24 143 Pejarakan 0,00 19,61 17,80 0,00 144 Kraksaan 0,00 18,64 17,80 0,00 145 Paiton 0,59 13,29 17,80 139,42 146 Situbondo Banyuglugu r 0,00 3,28 17,29 0,00 147 Besuki 0,00 24,67 17,29 0,00 148 Suboh 0,00 8,84 17,29 0,00 149 Mlandingan 0,00 5,66 17,29 0,00 150 Bungatan 0,00 3,84 17,29 0,00 151 Kendit 0,00 2,50 17,29 0,00 152 Panarukan 0,00 10,45 17,29 0,00 153 Mangaran 0,00 7,07 17,29 0,00 154 Kapongan 0,00 8,62 17,29 0,00
158 Banyuputih 0,00 1,23 17,29 0,00
Setelah semua perhitungan selesai, itu akan pergi ke langkah pemodelan. Tetapi jika kita ingin memodelkan dengan GIS, untuk membuatnya lebih mudah maka kita dapat membagi data menjadi beberapa indeks sesuai dengan rentang yang kita inginkan. Di sini kita bagi menjadi 5 rentang yaitu sangat rendah, rendah, sedang, tinggi, dan sangat tinggi (lihat: tabel 4.3). Kita dapat membaginya dengan bantuan pencar di excel sehingga kita dapat melihat batas bawah dan atas (lihat: gambar 4.5). Oleh karena itu kita akan mendapatkan hasil dari semua data saat digabungkan dan telah diberi kategori indeks sesuai dengan masing-masing rentang, (lihat: tabel 4.4).
Tabel 11. Range of each vulnerability factor
RANGE EROSI(m/year) Very Low 0 - 10 Low 10 - 20 Medium 20 - 30 High 30 - 40 Very High 40 - RANGE PENDUDUK(person/km²) Very Low 0 - 1000 Low 1000 - 4000 Medium 4000 - 7000 High 7000 - 10000 Very High 10000 - RANGE PENDAPATAN(million/person) Very Low 0 - 30 Low 30 - 50 Medium 50 - 70 High 70 - 100 Very High 100 - RANGE TOTAL(million/year) Very Low 0 - 60 Low 60 - 200 Medium 200 - 400 High 400 - 1000 Very High 1000 -
Tabel 12. Indexing result for all vulnerability
No. Provinsi Kabupaten/Kota Kecamatan Erosi (ha/thn) Informasi Population Density (jiwa/ha) Informasi Pendapatan per kapita (juta/jiwa) Informasi Kategori Total PD Informasi
Pendapatan Ekonomi
110
Jawa Timur
Tuban
Bancar 0,00 Very Low 5,47 Very Low 31,20 Low 0,00 Very Low
111 Tambakboyo 0,00 Very Low 5,46 Very Low 31,20 Low 0,00 Very Low
112 Jenu 0,00 Very Low 6,87 Very Low 31,20 Low 0,00 Very Low
113 Tuban 0,00 Very Low 42,33 Medium 31,20 Low 0,00 Very Low
114 Palang 0,00 Very Low 12,52 Low 31,20 Low 0,00 Very Low
115
Lamongan Brondong 0,00 Very Low 10,87 Low 20,98 Very Low 0,00 Very Low
116 Paciran 0,00 Very Low 16,37 Low 20,98 Very Low 0,00 Very Low
117
Gresik
Panceng 0,00 Very Low 8,39 Very Low 70,70 High 0,00 Very Low
118 Ujungpangkah 0,69 Very Low 5,39 Very Low 70,70 High 261,68 Medium
119 Bungah 0,00 Very Low 8,53 Very Low 70,70 High 0,00 Very Low
120 Manyar 0,00 Very Low 11,95 Low 70,70 High 0,00 Very Low
121 Gresik 0,00 Very Low 164,48 Very High 70,70 High 0,00 Very Low
122 Kebomas 0,00 Very Low 35,90 Low 70,70 High 0,00 Very Low
123
Surabaya
Benowo 0,00 Very Low 22,87 Low 131,81 Very High 0,00 Very Low
124 Asemrowo 0,00 Very Low 36,96 Low 131,81 Very High 0,00 Very Low
125 Krembangan 0,00 Very Low 203,66 Very High 131,81 Very High 0,00 Very Low 126 Pabean Cantian 0,00 Very Low 212,34 Very High 131,81 Very High 0,00 Very Low 127 Semampir 0,20 Very Low 273,16 Very High 131,81 Very High 7054,13 Very High
128 Kenjeran 0,00 Very Low 209,02 Very High 131,81 Very High 0,00 Very Low
129 Bulak 0,00 Very Low 63,96 Medium 131,81 Very High 0,00 Very Low
130 Sukolilo 0,00 Very Low 48,04 Medium 131,81 Very High 0,00 Very Low
131 Rungkut 0,00 Very Low 54,92 Medium 131,81 Very High 0,00 Very Low
132
Sidoarjo Sedati 0,00 Very Low 12,38 Low 64,28 Medium 0,00 Very Low
133 Jabon 0,00 Very Low 6,70 Very Low 64,28 Medium 0,00 Very Low
134
Pasuruan
Bugul Kidul 0,00 Very Low 28,97 Low 27,08 Very Low 0,00 Very Low
135 Lekok 0,00 Very Low 16,48 Low 58,62 Medium 0,00 Very Low
136 Nguling 0,00 Very Low 12,95 Low 58,62 Medium 0,00 Very Low
141 Dringu 0,00 Very Low 16,76 Low 17,80 Very Low 0,00 Very Low
142 Gending 1,07 Low 11,26 Low 17,80 Very Low 214,24 Medium
143 Pejarakan 0,00 Very Low 19,61 Low 17,80 Very Low 0,00 Very Low
144 Kraksaan 0,00 Very Low 18,64 Low 17,80 Very Low 0,00 Very Low
145 Paiton 0,59 Very Low 13,29 Low 17,80 Very Low 139,42 Low
146
Situbondo
Banyuglugur 0,00 Very Low 3,28 Very Low 17,29 Very Low 0,00 Very Low
147 Besuki 0,00 Very Low 24,67 Low 17,29 Very Low 0,00 Very Low
148 Suboh 0,00 Very Low 8,84 Very Low 17,29 Very Low 0,00 Very Low
149 Mlandingan 0,00 Very Low 5,66 Very Low 17,29 Very Low 0,00 Very Low
150 Bungatan 0,00 Very Low 3,84 Very Low 17,29 Very Low 0,00 Very Low
151 Kendit 0,00 Very Low 2,50 Very Low 17,29 Very Low 0,00 Very Low
152 Panarukan 0,00 Very Low 10,45 Low 17,29 Very Low 0,00 Very Low
153 Mangaran 0,00 Very Low 7,07 Very Low 17,29 Very Low 0,00 Very Low
154 Kapongan 0,00 Very Low 8,62 Very Low 17,29 Very Low 0,00 Very Low
155 Arjasa 0,00 Very Low 1,88 Very Low 17,29 Very Low 0,00 Very Low
156 Jangkar 0,22 Very Low 5,55 Very Low 17,29 Very Low 21,58 Very Low
157 Asembagus 0,56 Very Low 4,05 Very Low 17,29 Very Low 39,17 Very Low
2.9Hasil Peta Kerentanan
Dalam membuat peta kerentanan, kami menggunakan perangkat lunak QGIS. Kami membutuhkan batasan regional yang akan kami gunakan dan masukan ke dalam perangkat lunak QGIS. Kita bisa mendapatkan data batas regional ini dari Peta Rupa Bumi Indonesia, setelah itu kita gabungkan dengan tabel data excel yang memiliki indeks (sangat rendah, rendah, dll.). Setelah digabungkan, kita bisa membuat peta dengan warna yang akan menunjukkan indeks masing-masing wilayah (lihat gambar dibawah). Dari setiap faktor kerentanan akan memiliki peta sendiri, sehingga akan ada peta kerentanan fisik, kerentanan sosial, kerentanan ekonomi, dan total potensi kerusakan. Ini karena Pantai Utara JawaTimur sangat panjang, sehingga akan terlihat sangat kecil pada tata ruang jika tidak dibagi menjadi beberapa daerah.
Gambar 10 Peta Kerentanan
Kesimpulan
Berdasarkan peta perubahan garis pantai diketahui bahwa dinamika perubahan garis pantai dalam kurun waktu 2015-2019 mengalami perubahan setiap tahunnya mengikuti perubahan pada luasan mangrove. Berdasarkan hasil analisa net shoreline movement di Pantai Timur Surabaya menggunakan perangkat lunak DSAS diketahui bahwa sejak tahun 2015-2019 mengalami pergerakan kemajuan terbesar sejauh 677,64 m yang diketahui berada di wilayah Kecamatan Mulyorejo dan pergerakan kemunduran terbesar sejauh 36,76 m yang diketahui berada di wilayah Sukolilo. Sepanjang Pantai Timur Surabaya memiliki rata-rata pergerakan kemajuan garis pantai sebesar 27,79 m.
Berdasarkan peta luasan mangrove yang telah dibuat, diketahui bahwa luasan mangrove pada kurun waktu 2015-2019 mengalami perubahan setiap tahun yang mempengaruhi perubahan garis pantai di wilayah penelitian. Berdasarkan hasil analisa digitasi perhitungan area geometri diketahui bahwa mulai tahun 2015-2016 terjadi penambahan luasan mangrove, namun terjadi penurunan luasan mangrove pada tahun 2017 dan kembali mengalami penambahan luasan mangrove pada tahun 2018 dan 2019 di wilayah Pantai Timur Surabaya.
BAB III STATUS LUARAN
Untuk luaran yang dicapai sekarang yaitu : 1. PUBLIKASI ILMIAH
Berupa Jurnal dengan judul ‘ASSESSMENT OF MANGROVE AS A NATURAL BEACH PROTECTION IN SURABAYA COAST, INDONESIA’ disubmit pada International Journal of Conservation Science, Journal (Q2)
2. SEMINAR INTERNASIONAL
Berupa publikasi dengan judul Temporal and Spatial Analysis of Mangrove Forest Change in the North Coast of East Java, pada the 8th International Seminar on Ocean and Coastal Engineering, Environmental and Natural Disaster Management, 27-28 October 2020.
BAB IV PERAN MITRA
BAB V KENDALA PELAKSANAAN PENELITIAN
Untuk luaran masih menunggu hasil review dari pihak Journal International Journal of Conservation Science (IJCS), Journal (Q2)
BAB VI RENCANA TAHAPAN SELANJUTNYA
Jika dalam tahun ini masih belum ada hasil review dari jurnal yang dituju, maka kemungkinan Jurnal akan disubmit ke jurnal yang lain
BAB VII DAFTAR PUSTAKA
1. Campbell J. 2013. Landsat 8 Set to Extend Long Run of Observing
2. Hossain, M.D., Chen, D. 2019. Segmentation for Object-Based Image Analysis (OBIA): A Review of Algorithms and Challenges from Remote Sensing Perspective. ISPRS Journal of Photogrammetry and Remote Sensing.
3. Lillesland, Thomas. M dan Ralph W. Kiefer.2007. Penginderaan Jauh dan Interpretasi Citra. Yogyakarta. Gadjah Mada University Press
4. NASA, 2016. Mission Updates. http://www.nasa.gov
5. Prahasta, Eddy. 2008. Remote Sensing Praktis Penginderaan Jauh dan Pengolahan data Citra Dijtal dengan Perangkat Lunak ER Mapper, Informatika Bandung.
6. Pramudji, 2000. Dampak Perilaku Manusia PADA Ekosistem Hutan Mangrove di Indonesia. Oseana, Vol.XXV, No.2, 13-20.
7. Pramudji, 2001. Ekosistem Hutan angrove dan Peranannya sebagai Habitat Berbagai Fauna Aquatik. Oseana, Vol.XXVI, No.4, 13-23.
8. Roy, D.P., V. Kovalskyy., H.K. Zhang., E.F. Vermote., L. Yan., S.S Kumar., A. Egorov. 2015. Characteristic of Landsat-7 to Landsat-8 Reflective Wavelength and Normalized Difference Vegetation Index Continuity. Remote Sensing of Environment. Elsevier.
9. Shalihati, S.F. 2014. Pemanfaatan Penginderaan Jauh dan Sistem Informasi Geografi dalam Pembangunan Sektor Kelautan serta Pengembangan Sistem Pertahanan Negara Maritim. Geoedukasi Volume III Nomer 2. 115 – 126.
10.Sitanggang, Gokmaria, 2008. Teknik dan Metode Fusi (Pansharpening) Data Alos (Avnir-2 dan Prism) untuk Identifikasi Penutup Lahan/Tanaman Petanian Sawah. LAPAN. Jakarta
11.Sukardjo, S. 1996. Gambaran umum ekologi mangrove di Indonesia Lokakarya Strategi Nasional Pengelolaan Hutan Mangrove di Indonesia. Direktorat Jenderal Reboisasi dan Rehabilitasi lahan, Departemen Kehutanan, Jakarta: 26 hal.
12.Tomlinson, P.B. 1986. The botany of mangrove. Cambridge University Press. Cambridge, London, New York, New Rochelle, Melbourne, Sydney: p. 413.
13.Akbar, A. A., Sartohadi, J., Djohan, T. S. & Ritohardoyo, S., 2017. Erosi Pantai, Ekosistem Hutan Bakau dan Adaptasi Masyarakat Terhadap Bencana Kerusakan Pantai di Negara Tropis. Ilmu Lingkungan Vol. 15 Issue 1, pp. 1-10.
14.Anonim, 2000. Geochaching. [Online] Available at: geochaching.com/how-the-beach-build [Accessed 16 January 2020].
15.Arisandi, P., 1998. Panduan Pengenalan Mangrove Pantai Timur Surabaya Mangrove Sang Pelindung. Surabaya: Ecoton.
16.Aryanti, O. D., 2016. Laporan Kuliah Lapangan Kawasan Mangrove Wonorejo Surabaya, Surabaya: Jurusan Perencanaan Wilayah dan Kota, FTSP, Institut Teknologi Sepuluh Nopember.
17.Atmaja, A. P. E., 2007. Wilayah Pesisir (Coastal Zone), Semarang: Fakultas Hukum Universitas Diponegoro.
18.Dedi, 2020. Keberadaan Wilayah Mangrove Kecamatan Mulyorejo [Interview] (17 Januari 2020).
19.Dinas Kelautan dan Perikanan, 2004. Rancangan Undang-undang tentang Pengelolaan Wilayah Pesisir dan Pulau-pulau Kecil tahun 2004. Jakarta : Dinas Kelautan dan Perikanan.
20.Dinas Lingkungan Hidup Surabaya, 2018. Laporan Survey Analisa Vegetasi Mangrove 2018 Kota Surabaya. Surabaya: Pemerintah Kota Surabaya.
21.Haya, N., Zamani , N. P. & Soedharma, D., 2015. Analisis Struktur Ekosistem Mangrove di Desa Kukupang Kecamatan Kepulauan Joronga Kabupaten Halmahera Selatan Maluku Utara. Teknologi Perikanan dan Kelautan Vol. 6 No. 1, pp. 79-89.
22.Ika, N., 2017. Selamatkan Mangrove Surabaya dari Konversi Lahan. [Online] Available at: academia.ecu
23.Kementrian Lingkungan Hidup dan Kehutanan, 2017. Miliki 23% Ekosistem Mangrove Dunia, Indonesia Tuan Rumah Konferensi Internasional Mangrove 2017. [Online] Available at: ppid.menlhk.go.id
24.Lillesand, T. M. & Kiefer, R. W., 1979. Remote Sensing and Image Interpretation. New York: Cambridge University Press.
25.Mujabuddawat, M. A., 2016. Perangkat Sistem Informasi Geografis (SIG) Dalam Penelitian dan Penyajian Informasi Arkeologi. Kapata Arkeologi Vol. 12 No. 1, pp. 29-42.
26.Opa, E. T., 2011. Perubahan Garis Pantai Desa Bentenan Kecamatan Pusomaen Minahasa Tenggara. Jurnal Perikanan dan Kelautan Tropis, pp. Vol. VII-3. 58
27.Pedro Narra, C. C. F. S. J. P., 2017. CERA: An open source tool for coastal erosion risk assessment. Ocean & Coastal Management, pp. 1-14.
28.Poerbandono, 1999. Hidrografi Dasar. Bandung: Institut Teknologi Bandung.
29.Putra, D. S. W., 2017. Analisa Dampak Ekosistem Mangrove Terhadap Perubahan Garis Pantai di Pesisir Timur Surabaya dan Sidoarjo Tahun 2006-2015. Surabaya: Jurusan Teknik Kelautan, FTK, Institut Teknologi Sepuluh Nopember.
30.Risnandar, C., 2018. Hutan Mangrove. Jurnal Bumi Lingkungan hidup.
31.Supriharyono, 2000. Pelestarian dan Pengelolaan Sumber Daya Alam di Wilayah Pesisir Tropis. Jakarta: Gramedia.
32.Sutanto, 1992. Penginderaan Jauh. Jilid 1 ed. Yogyakarta: Gadjah Mada University Press. 33.Syamsu, I. F., Nugraha, A. Z., Nugraheni, C. T. & Wahwakhi, D. S., 2018. Kajian Perubahan
Tutupan Lahan di Ekosistem Mangrove Pantai Timur Surabaya. Media Konservasi Vol. 23 No. 2, pp. 122-131.
34.Triatmodjo, B., 1999. Teknik Pantai. Yogyakarta: Beta Offset.
35.Tufaila, M., Karim, J. & Alam, S., 2012. Pemanfaatan Penginderaan Jauh dan Sistem Informasi Geografis Untuk Pemetaan Bentuklahan di DAS Morami. Agroteknos Vol. 2 No 1, pp. 9-20. 36.Tukin, 2020. Keberadaan Mangrove di Pantai Timur Surabaya [Interview] (17 Januari 2020). 37.USGS, 2013. United State Geological Survey. [Online] Available at: usgs.gov [Accessed 16
January 2020].
38. Walikota Surabaya, 2014. Rencana Tata Ruang Wilayah Kota Surabaya Tahun 2014-2034 Perda No.12 Tahun 2014 Kota Surabaya. Surabaya: Pemerintah Daerah Kota Surabaya.
LAMPIRAN 1 Tabel Daftar Luaran
Program : Penelitian Pascasarjana
Nama Ketua Tim : Muhammad Zikra
Judul : ANALISIS SPATIAL DAN TEMPORAL PERUBAHAN LUASAN
MANGROVE DI WILAYAH PANTAI UTARA JAWA TIMUR SEBAGAI PELINDUNG PANTAI ALAMI DALAM MENDUKUNG PROGRAM BUILDING WITH NATURE
1.Artikel Jurnal
No Judul Artikel Nama Jurnal Status Kemajuan*)
1 ASSESSMENT OF MANGROVE AS A NATURAL BEACH PROTECTION IN SURABAYA COAST, INDONESIA
International Journal of Conservation ad Science
Review Proses
*) Status kemajuan: Persiapan, submitted, under review, accepted, published
2. Artikel Konferensi
No Judul Artikel Nama Konferensi (Nama
Penyelenggara, Tempat, Tanggal)
Status Kemajuan*)
Temporal and Spatial Analysis of Mangrove Forest Change in the North Coast of East Java
ISOCEEN 2020, Surabaya, 27-28 Oktober 2020
Presented
*) Status kemajuan: Persiapan, submitted, under review, accepted, presented
3. Paten
No Judul Usulan Paten Status Kemajuan
*) Status kemajuan: Persiapan, submitted, under review
4. Buku
No Judul Buku (Rencana) Penerbit Status Kemajuan*)
*) Status kemajuan: Persiapan, under review, published
5. Hasil Lain
No Nama Output Detail Output Status Kemajuan*)
*) Status kemajuan: cantumkan status kemajuan sesuai kondisi saat ini
6. Disertasi/Tesis/Tugas Akhir/PKM yang dihasilkan
ISSN: 2067-533X
INTERNATIONAL JOURNAL
OF
CONSERVATION SCIENCE
Volume XX, Issue X, Month-Month 202X: XXX-XXX www.ijcs.ro
ASSESSMENT OF MANGROVE AS A NATURAL BEACH PROTECTION IN SURABAYA COAST, INDONESIA
Muhammad ZIKRA1,*, Hasan Ikhwani, Anita Kusuma WARDHANI1
1 Ocean Engineering Department, Institut Teknologi Sepuluh Nopember, Kampus ITS Keputih Sukolilo, Surabaya,
Indonesia
Abstract
Mangrove area in east coast of Surabaya region is becomes a fortress to protect the city from the threat of erosion and sea intrusion. According to its function, the development of mangrove areas will help this area in dealing with coastal erosion. This study presents a GIS model that aims to determine the effect of mangrove changes to coastal erosion risk. The method used Landsat satellite images during 2015-2019 to calculate mangrove changes. DSAS (Digital Shoreline Analysis System) is used to calculate shoreline changes. Finally, the model used CERA to analysis coastal erosion risk. The results showed that there is the dynamics change of shoreline (both accretion and abrasion) in the 2015-2019 period in each district. This change is influenced by the density of mangroves. Meanwhile, the analysis of CERA showed that the Kenjeran and Bulak Districts are classified as high risk of erosion. This condition is not only based on the extent of mangrove, but is also caused by other parameters such as geomorphology, land cover, population density, and so on.
Keywords: CERA, DSAS, Risk, Mangrove, Coastal
Introduction
Pamurbaya is an open space area that plays a major role in controlling the geographical situation of the city of Surabaya, East Java, Indonesia. It is because the mangrove area on the east coast of Surabaya is a stronghold of the city of Surabaya from the threat of abrasion, sea intrusion, and subsidence. Indonesia's mangrove ecosystem is the largest in the world and has the highest biodiversity. Traditional fisheries and aquaculture are also directly assisted by the presence of mangrove forests as breeding grounds and nurseries [1].
One of the mangrove areas in Indonesia that is indicated to be damaged is the east coast of Surabaya. Whereas according to the Surabaya City Spatial Plan and Region of 2014, this area is designated as a protected area.
As an area of green open space that remains and becomes a fortress to protect the city of Surabaya from the threat of erosion, sea intrusion, and subsidence, the mangrove area in Pamurbaya has begun to experience changes due to land development for housing. This happens because of the inconsistency of the Conservation Law and the housing permit that was issued [2].
Zikra and Wardhani
However, there has been a degradation in the coastal area and the mangrove ecosystems due to human activities. If this situation continues, the city of Surabaya will be very dangerous and vulnerable to natural disasters [3].
The objective of this research is to determine the effect of mangrove changes to coastal erosion risk using GIS model. The method analysis mangrove coastlines changes from 2015 to 2019 on the east coast of Surabaya using Landsat satellite images and DSAS. Also, CERA is combine in this study to analysis coastal erosion risk The results of this study are expected to provide an overview of the condition of mangroves and changes in the shoreline in order to manage and to protect this area from erosion.
Material and Method
Study Location
This study is located in coastal area of Surabaya at coordinates 7° 14' - 7° 21' Latitute and 112° 37' - 112° 57' Longitude. Surabaya east coast or also called Pamurbaya is located in the eastern part of the city of Surabaya and is directly adjacent to the Madura Strait as seen in Figure 1. This area has coastline length of 35.7 km along. Pamurbaya is divided into six district as shown in Table 1. Surabaya features typical a tropical monsoon climate, with distinct dry and wet seasons. For average high temperature of 32 °C and average low temperatures about 25 °C.
ASSESSMENT OF MANGROVE AS A NATURAL BEACH PROTECTION IN SURABAYA COAST, INDONESIA
Table 1. East Coast of Surabaya Area
No District Sub-District
1 Gunung Anyar Gunung Anyar
2 Rungkut Medokan Ayu, Wonorejo
3 Sukolilo Keputih
4 Mulyorejo Dukuh Sutorejo, Kalisari, Kejawan
5 Bulak Kedung Cowek, Bulak, Komp. Kenjeran, Kenjeran, Sukolilo
6 Kenjeran Tambak Wedi, Bulak Banteng
Data
In the present study, we used Landsat 8 satellite image database which has a resolution of 30-meter x 30 of the east coast region of Surabaya from 2015 to 2019. The LANDSAT image data were downloaded from the United States Geological Survey homepages for free (http://earthexplorer.usgs.gov). Added, the high spatial resolution images, which were collected in 2015 and 2019 and derived from Google Earth, were used to validate the accuracy of the classification image. Data of this study also supported by Digital Elevation Model and Geological Map of Surabaya. Added, economic data, population density, ecological data, wave height and tidal data in the Surabaya region are collected to support risk analysis model.
Methods
Image Analysis
First preparation in image management is radiometric correction and geometric correction. Radiometric correction to correct pixel values from solar or atmospheric radiation variation, while geometric correction to obtain correct geometry of the image that matches the reference image with ground control points.
Then, composite image was carried out using ENVI 5.3 software. This process is done to classsify or to identification the mangrove vegetation. The RGB composite of 564 was used in Landsat 8 satellite imagery.
Next, to distinguish mangroves from other types of land use, image classification was implemented in this analysis. Image classification is sorting process by grouping pixels in several classes based on objective or category. Every pixel in each class is assumed to have similar characteristics. The classification method used in this paper is the supervised classification with the maximum likelihood classification [4].
Finally is the calculation of mangroves area during 5 years from 2015 to 2019. The calculation is done using the method of calculate geometric. Calculate geometrically method is an automatic calculation procedure on ArcMap based on the geometric shape or coordinate system used in GIS data. In this analysis, raster data will be converted into vector data to simplify the calculation of land cover change area from the image of the classification results. This data conversion uses one of tool in ENVI software. Then, the area will be calculated by using calculate geometric method contained in ArcMap 10.5 software.In the present study, we used Landsat 8 satellite image database which has a resolution of 30-meter x 30 of the east coast region of Surabaya from 2015 to 2019. The LANDSAT image data were downloaded from the United States Geological Survey homepages for free (http://earthexplorer.usgs.gov). Added, the high spatial resolution images, which were collected in 2015 and 2019 and derived
Zikra and Wardhani
from Google Earth, were used to validate the accuracy of the classification image. Data of this study also supported by Digital Elevation Model and Geological Map of Surabaya. Added, economic data, population density, ecological data, wave height and tidal data in the Surabaya region are collected to support risk analysis model.
Fig. 2. Mangrove change analysis
Digita Shoreline Analysis System (DSAS)
In the analysis of shoreline changes, Digital Shoreline Analysis System (DSAS) was used in this study. DSAS is a GIS-based system invented and developed by USGS (the United States Geological Survey) [5,6,7]. Analysis of shoreline changes is done by three methods, namely SCE (Shoreline Change Enelope), NSM (Net Shoreline Movement), and EPR (End Point Rate). In this paper, the EPR was chosen the statistical parameters describing the spatial patterns of shoreline change [7]. EPR measures mangrove shoreline change by calculating the rate of shoreline change by dividing the distance of the mangrove shoreline between its initial (year 2015) and the last position of shoreline (year 2019).
Coastal Erosion Risk Assessment (CERA)
CERA is a tool based on geographic information systems, so it can be used in GIS software especially open source software like QGIS or it can be used on ArcGIS software [8]. CERA will help calculate vulnerability, consequences, and erosion risks that occur in an area by entering all the main parameters of vulnerability data, namely distance to shoreline, topographic maps, geological maps, geomorphological data, human activity data, waves, average tides, etc.
The CERA software will analyze the risk of erosion by looking at vulnerability assessments and assessing the consequences of existing parameters. A vulnerability map, a consequence map and a risk map are generated outputs from CERA [8].
In CERA, the risk assessment analysis is divided into 2 parts. First is the vulnerability assessment which estimates qualitatively the level of vulnerability of a coastal area to coastal
ASSESSMENT OF MANGROVE AS A NATURAL BEACH PROTECTION IN SURABAYA COAST, INDONESIA Table 2. Classification of Vulnerability Level Parameters [10,11,12,13]
Parameters Very Low
(1) Low (2) Moderate (3) High (4) Very High (5) Distance to coastline (m) >1000 200-1000 50-200 20-50 < 20 Topography (m) >30 20-30 10-20 5-10 <5
Geology Igneous rock Metamorphic
rocks Sedimentary rocks Coarse-textured sediment Fine textured sediments
Geomorphology mountains Rocky cliffs
The eroded cliffs that extend along the beach Beach tourism, plain fluvio marin Sand dunes, river mouths, estuaries
Land cover forest Agricultural
crops Open field
Rural settlement Urban settlements, industrial areas Anthropogenic action Coastal stabilization interventions Intervention without reduction of sediment sources Intervention with reduction of sediment sources Without intervention or reduction of sediment sources Without intervention, there is a reduction in sediment sources Maximum significant wave height (m) <3 3-5 5-6 6-6.9 >6.9 The maximum distance of tides (m) <1 1-2 2-4 4-6 >6 Average level of beach erosion / accretion (m/tahun)
>0 (accretion) (erosion) (-1) – 0 (-3) – (-1) (erosion) (-5) – (-3) (erosion) < (-5) (erosion)
Table 3. Classification of the Level of Consequences [14, 15].
Parameters Very low
(1) Low (2) Moderate (3) High (4) Very High (5) Population density (people/ km2) 500 500-1000 1000-2000 2000-4000 >4000 Economic Level (number of workers) 0 0-10 10-30 30-50 >50 Ekology Not an ecological protection area Strategic agricultural area Ecological conservation area Ecological
protected area National Parks
Historic Site Not a historic site There are several historic constructions There are historic constructions and community activities therein Regional-level historic construction National Monument
The risk assessment matrix is as follows:
Table 4. Matrix of erosion risk assessment using CERA [14].
The consequences I II III IV V V u ln er a b il it y I I I I II III II I I II III IV III I II III IV V IV II III IV V V V III IV V V V
Zikra and Wardhani
At the analysis stage using CERA, data from each parameter are classified according to table 4-5, respectively. The data used is data collected from various sources. Furthermore, all parameters are inputted in the CERA tools for raster map operations according to the weight calculation algorithm presented by CERA.
Results and discussion
Mangrove and Coastline Change
Figure 3 present the distribution of mangrove area in Surabaya east coast during 2015-2019. Figure 4 present change in mangrove area based on Google Earth satellite during 2010-2019. After the results of the digitization process are formed, the mangrove area is calculated using the image processing software that produces the data in Table 2 as follows:
Table 5. Total Area of Mangrove for 2015-2019
No Year Area (Ha)
1 2015 475,40
2 2016 496,96
3 2017 490,04
4 2018 555,60
5 2019 609,88
Based on field survey [9], mangrove type in the study area are dominated by several species, including Rhizophora sp., Avicennia sp., Exoecaria sp., Sonneratia sp., Xylocarpus sp. and Bruguiera sp. as shown in Figure 5 below.
ASSESSMENT OF MANGROVE AS A NATURAL BEACH PROTECTION IN SURABAYA COAST, INDONESIA
(c) (d)
Fig. 3. Figures of mangrove area distribution; (a) 2015 to 2016; (b) 2016 to 2017; (c) 2017 to 2018; (d) 2018 to 2019.
(a) (b) (c)
Fig. 4. Figures of change in mangrove area; (a) 2010; (b) 2015; (c) 2019.
Table 6. Total Area of Mangrove for Every District
No District 2015 (Ha) 2016 (Ha) 2017 (Ha) 2018 (Ha) 2019 (Ha)
1 Kenjeran 25.28 35.41 32.59 38.38 44.77 2 Bulak 68.47 49.62 25.85 36.14 61.62 3 Mulyorejo 232.52 248.64 268.12 289.69 293.6 4 Sukolilo 62.54 71.53 71.15 96.05 111.46 5 Wonorejo 62.88 66.32 62.18 69.4 72.64 6 Gunung Anyar 23.65 25.43 22.16 25.93 25.8
Table 7. Shoreline Changes for Every District
No District 2015 (m) 2016 (m) 2017 (m) 2018 (m) 2019 (m) 1 Kenjeran - 46.72 24.4 27.83 29.4 2 Bulak - 36.16 33.98 27.61 31.85 3 Mulyorejo - 33.3 36.53 68.96 99.84 4 Sukolilo - 61.54 14.81 29.18 41.05 5 Wonorejo - 45.37 18.55 25.56 32.91 6 Gunung Anyar - 38.41 18.35 21.2 21.22
Zikra and Wardhani
Fig. 5. Mangrove species in eastern Surabaya
(a) (b)
ASSESSMENT OF MANGROVE AS A NATURAL BEACH PROTECTION IN SURABAYA COAST, INDONESIA
(e) (f)
Fig. 6. Changes in Coastline and Mangrove in eastern Surabaya; (a) Kenjeran; (b) Bulak; (c) Mulyorejo; (d) Sukolilo; (e) Rungkut; (f) Gunung Anyar.
The results of changes in coastline and mangrove area in Surabaya east coast from 2015 to 2019 can be seen in Figure 6. In Figure 6, it can be seen that the change in coastline is in line or have similar trend with the change in mangrove area. If mangrove area is decrease, the shoreline also will be retreat.
Mostly, in every district such as Kenjeran, Sukolilo, Rungkut and Gunung Anyar, the mangrove area was a decrease in 2017. In the next following year, the area was increasing again. Logging activies from local fisherman is thought to have caused this decline
But in Mulyorejo, mangrove in this area increase every year. Based on the field investigation, in this region there are mangrove planting activities were carried out by many communities in large or small scale group. So it can be assumed that this can affect the addition of mangroves area at all times. Added, start 2017, the mangrove area in every district in east coast Surabaya was become an eco-tourism area and botanical garden.
Based on the analysis of the net shoreline movement on the East Coast of Surabaya using DSAS software, it is known that from 2015-2019 the largest progression was 677.64 m, which was known to be in the Mulyorejo district and the largest setback was 36.76 m which was known to be at Sukolilo district. Overall, along the East Coast of Surabaya, the average coastline progress has been 27.79 m.
Vulnerability Analysis
The data in the analysis of vulnerability levels are first classified based on predetermined classification rules. Furthermore, all parameters can be input into the CERA application. The following parameters are used in the analysis of vulnerability levels.
Based on the results of data from the Geospatial Information Agency it is known that the highest tide distance in the East Coast of Surabaya is 2,367 m in Kenjeran sub-district, 2,367 in Bulak sub-district, 2,686 m in Mulyerojo sub-district, 2,705 in Sukolilo sub-district, 2,716 in Rungkut sub-district, and 2,705 in Gunung sub-district Anyar. The maximum wave height on the east coast of Surabaya is included in the very low category because the average wave height is 0.16 m. Wave height data was obtained from the Geospatial Information Agency during 2015-2019 in the east coast region of Surabaya.
Zikra and Wardhani
Topographic characteristics or land elevation in the East Coast region of Surabaya have the same characteristics because it has a land height of 2 m. Topographic altitude data were obtained from the Digital Elevation Model from the Shuttle Radar Topography Mission website. Based on the analysis of shoreline changes through DSAS software, it is known that in the east coast of Surabaya it has an erosion rate of> 5 m in each district. In general, the east coast of Surabaya is dominated by urbanization in the Kenjeran district and Bulak sub-district. For the districts of Mulyorejo, Sukolilo, Rungkut, and Gunung Anyar are forest/pond areas. Land cover data can be seen from Google Earth.
Anthropogenic actions are actions in an effort to reduce the level of erosion and beach accretion. Google earth from Kenjeran and Bulak sub-districts is a coastline stabilization intervention area, but for Mulyorejo sub-district, Sukolilo sub-district, Rungkut sub-district, and Gunung Anyar sub-district are areas without intervention or reduction of sediment sources.
The distance to the coastline is calculated by drawing a line in the study area to the coastline using the Google Earth software. From the analysis results it is known that parameters of the coastline are classified as very low.
In general, the Surabaya east coast region is an area detected as land with fine sediments based on geological maps in Indonesia. Therefore, the geology of the research area is classified as very high. In geomorphological parameters, the study area has a different classification. In Kenjeran and Bulak sub-districts are areas directly adjacent to the coast, while the sub-districts of Mulyorejo, Sukolilo, Rungkut and Gunung Anyar do not directly border the coast.
Based on the results of the vulnerability level analysis as shown in Figure 7 (left), it was found that the zones with a medium level of vulnerability in the Mulyorejo sub-district, Sukolilo sub-district, Rungkut sub-district, and Gunung Anyar sub-district. Whereas in Kenjeran and Bulak sub-districts they have a high level of vulnerability.
Consequence Analysis
The level of consequences is based on the estimated impact caused by erosion hazards in the Surabaya east coast region. The more important an area will be marked by population density, the distribution of ecological zones, the distribution of historic buildings, and economic level activities, the area has consequences for coastal erosion that will occur because it will affect the economic, social, and environmental structure in the region. The following parameters are used in assessing the level of consequences for coastal erosion in the east coast of Surabaya.
The economic level is measured based on the number of workers in a unit of land or in this analysis is the district area. Therefore, all sub-districts are classified as very high economic levels because they have an economic level of more than 480 workers/sub-districts. Where in Kenjeran sub-district has 2400 workers, in Bulak sub-district has 2276 workers, in Mulyorejo sub-district has 524 workers, in Sukolilo sub-district has 1172 workers, in Rungkut sub-district has 9272 workers, and in Gunung Anyar sub-district has 9369 workers. All data are obtained from data from BPS Surabaya City in 2018.
The level of population density is generally classified as very high in each district on the East Coast of Surabaya because the population is more than 1000 people. It is known from BPS
ASSESSMENT OF MANGROVE AS A NATURAL BEACH PROTECTION IN SURABAYA COAST, INDONESIA
High classified historical sites are found in Kenjeran sub-district, namely the Kedung Cowek Fortress historic building. In addition, in other districts classified as very low because there are no historic sites.
Ecological zone protection areas based on the Surabaya BLH [16] document show that in Rungkut sub-district are classified as high because the ecological protection area, in Kenjeran sub-district, Sukolilo is classified high because there are ponds and beaches, and in Mulyorejo sub-district and Gunung Anyar sub-district classified as very high due to natural zones.
Based on the analysis results as presented in Figure 7 (middle), it is known that the consequence level map has a different value distribution from the level of vulnerability because in this analysis has different parameters and different weights. The level of secondary consequences is found in the districts of Bulak, Sukolilo and Rungkut. Whereas the high level of consequences is found in Mulyorejo and Gunung Anyar sub-districts. High levels of consequence are found in Kenjeran sub-district.
Risk Analysis
Risk level analysis is the relationship between the results of the analysis of the level of vulnerability and analysis of the level of consequences to erosion in the study area. This analysis relationship is arranged in a matrix in the previous erosion matrix table. From the results of this analysis is the final result of the erosion risk assessment in the east coast of Surabaya and it will be seen that the zone or district that has a high level of erosion risk requires special attention by making it a priority area for erosion risk management.
Based on the analysis it can be seen that the level of risk of middle class erosion erosion is found in Mulyorejo sub-district, in Sukolilo sub-district, in Rungkut sub-district, and Gunung Anyar sub-district as seen in Figure 7 (right). Whereas the high classified areas are in Kenjeran sub-district and Bulak sub-district. High risk assessment in Kenjeran and Bulak Districts is due to the geomorphological parameters of the tourist beach area, land cover is rural settlements that have a very high population density, has historic construction and has a natural mangrove area so it does not have special treatment programs by the local government.
(a) (b) (c)
Zikra and Wardhani
Conclusions
Based on the analysis it is known that the extent of mangroves in the period of 2019 has changed every year which affects changes in coastline in the study area. From 2015-2016 there was an increase in mangrove area, but there was a decrease in mangrove area in 2017 and again experiencing mangrove area expansion in 2018 and 2019 in the east coast region of Surabaya.
Based on the analysis using CERA, the level of vulnerability and consequence indicate that the Kenjeran sub-district and the Bulak sub-district have a high risk of erosion. This condition is not only based on the extent of mangroves, but is also influenced by the parameters of vulnerability and consequences used in the analysis.
Acknowledgments
The authors are grateful to RISTEK BRIN and DRPM ITS for supporting this project. This research was funded by grant number 925/PKS/ITS/2020.
References
[1] Asokan, P. K. Mangroves and its importance to Fisheries. ISO 690, 2012.
[2] Aryanti, O. D. Report on Field Study of the Wonorejo Mangrove Area Surabaya, Surabaya: Department of Regional and City Planning, FTSP, Institut Teknologi Sepuluh November, 2016.
[3] Syamsu, I. F.; Nugraha, A. Z.; Nugraheni, C. T.; and Wahwakhi, D. S. Study of Land Cover
Change in Mangrove Ecosystems in East Coast of Surabaya. Conservation Media 2018,
Vol. 23 No. 2, (pp. 122-131).
[4] McLachlan G. Discriminant Analysis and Statistical Pattern Recognition. New York: Wiley, 1991.
[5] Thieler ER., and Danforth WW. Historical shoreline mapping (1) Improving techniques and
reducing positioning errors. Journal of Coastal Research 1994a, 10, (pp. 549-563).
[6] Thieler ER., and Danforth WW. Historical shoreline mapping (II) Application of the Digital Shoreline Mapping and Analysis Systems (DSMS/DSAS) to shoreline change mapping in
Puerto Rico. Journal of Coastal Research 1994b, 10(3), (pp. 600-620).
[7] Thieler, E.R.; Himmelstoss E.A.; Zichichi J.L.; Ergul A. Digital Shoreline Analysis System (DSAS) version 4.0 - An ArcGIS extension for calculating shoreline change. U.S. Geological Survey Open-File Report, 2009, 2008-1278
