Pedagogical Innovations
for Sustainable
Development
Ken D. Thomas
Auburn University, USA
Helen E. Muga
University of Mount Union, USA
Published in the United States of America by
Information Science Reference (an imprint of IGI Global) 701 E. Chocolate Avenue
Hershey PA 17033 Tel: 717-533-8845 Fax: 717-533-8661 E-mail: [email protected] Web site: http://www.igi-global.com
Copyright © 2014 by IGI Global. All rights reserved. No part of this publication may be reproduced, stored or distributed in any form or by any means, electronic or mechanical, including photocopying, without written permission from the publisher. Product or company names used in this set are for identification purposes only. Inclusion of the names of the products or companies does not indicate a claim of ownership by IGI Global of the trademark or registered trademark.
Library of Congress Cataloging-in-Publication Data
British Cataloguing in Publication Data
A Cataloguing in Publication record for this book is available from the British Library.
All work contributed to this book is new, previously-unpublished material. The views expressed in this book are those of the authors, but not necessarily of the publisher.
For electronic access to this publication, please contact: [email protected].
Handbook of research on pedagogical innovations for sustainable development / Ken D. Thomas and Helen E. Muga, edi-tors.
pagea cm
Includes bibliographical references and index.
Summary: “This book brings together case study examples in the fields of sustainability, sustainable development, and education for sustainable development”-- Provided by publisher.
ISBN 978-1-4666-5856-1 (hardcover) -- ISBN 978-1-4666-5857-8 (ebook) -- ISBN 978-1-4666-5859-2 (print & perpetual access) 1. Sustainable development--Study and teaching. I. Thomas, Ken D., 1982- II. Muga, Helen E., 1977-
HC79.E5C3743 2014 338.9’27071--dc23
2014000907
This book is published in the IGI Global book series Practice, Progress, and Proficiency in Sustainability (PPPS) (ISSN: 2330-3271; eISSN: 2330-328X)
Typesetter: Cover Design:
Chapter 27
Analyzing Farmers’ Learning
Process in Sustainable
Development:
The Case of Organic Paddy Farmers
in North Sumatra, Indonesia
ABSTRACT
Rice is the staple food grain for Indonesians. With the increasing population, Indonesia has tried to improve its rice production by using high yielding varieties (HYV) and more chemical fertilizers and pesticides. Initially the program was quite successful, but later production began to stagnate with subse-quent environmental and health issues. As an alternative, Indonesia embarked on wide scale promotion of organic rice farming. However, success seems unlikely. One of the first barriers to successful imple-mentation was that not many rice crop (paddy) farmers converted their farms to the organic system. In fact, this chapter relates that the early stages of farmers’ learning process actually went smoothly but did not continue in the final stages. Lack of time, labor, and funds to cover extra activities of the first years of the conversion mainly explain the barriers for farmers to complete the learning process. The barriers need to be understood and addressed in order to improve the sustainable integration of organic rice farming into Indonesian cultural practices.
Diana Chalil
University of Sumatera Utara, Indonesia
ORGANIZATION BACKGROUND
Indonesia is the 3rd largest rice producer in the
world. During the 1980s Indonesia was success-fully self-sufficient in rice production. These results were achieved by utilizing HYV in con-junction with increasing quantities of chemical fertilizers and pesticides. Also almost all rice farmers adapted that rice production model. However, with a continued increase in population, the production cannot keep pace with the needs of the domestic rice consumption. In 2008-2012, Indonesia was recorded as the world’s 7th largest
rice importer—requiring on average over 1.1 mil-lion tons of imports per year.
Rice farmers in Indonesia are accounted for approximately 77% of all farmers in the country. One of the paddy production centers is Desa Lu-buk Bayas. Farmer groups in this village can be seen as one of the more developed and received the best group award in 2003. The average farm size is very small at less than 1 hectare, with the majority of farmers cultivating landholdings
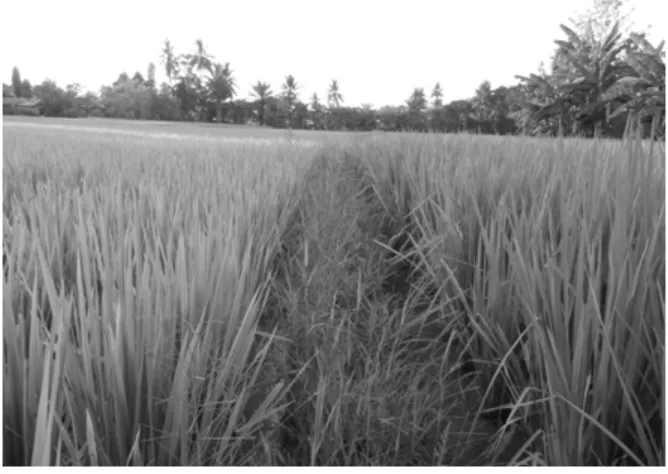
between 0.1-0.5 hectares in size (USDA, 2012). Most of these farmers are engaged in groups that were formed by the government. Each group has three administrators: the leader, the secretary and the treasurer. At first, the group division was based on the farmers’ house location, but eventually they were divided based on their paddy field locations. Decisions and coordination are made through group discussions and include routine activities such as schedules and cropping patterns, pest and diseases crop prevention, and water conservation (Nuryanti and Swastika, 2011). In Lubuk Bayas, farmer groups conduct meetings at least twice a year for discussing the planting schedule. There are a number of villages that conduct meetings once every 2-3 months, even every week. Farmers know the importance of planting crops simulta-neously, but this can be complicated when one “paving” contains both organic and conventional paddy (Figure 1).
Farmer groups are often used as means to dis-seminate new technology. In the 1970s and 1980s the farming intensification program that used
HYV, chemical fertilizers and pesticides was introduced and implemented through farmer groups in every village in Indonesia. Currently, organic farming is also being introduced through the farmer group. Therefore, in general farmers that have started organic farming were conven-tional farmers that have been accustomed to using chemical fertilizers and pesticides intensively.
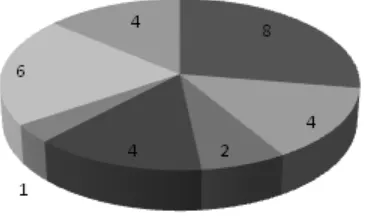
Farmers generally admit to taking part in al-most every activity that is conducted by the group, because the activities are relevant and fulfill their farming needs (Tubene & Holder, 2001 in Franz et al., 2010). Lubuk Bayas has six farmer groups. Of those six groups, only Subur Group makes the claim to be an organic farmer group. Subur Group appears to have the least number of members with 63 farmers, while others ranged from 75 to 172 farmers. In reality, only 9 farmers from all of
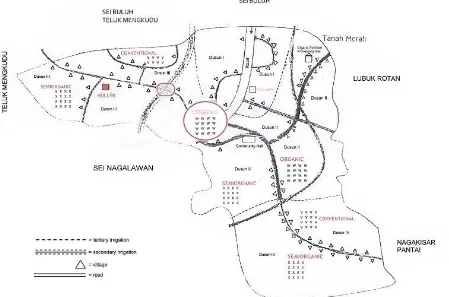
the Subur Group members have consistently and fully used the organic systems of rice production. However, the Subur Group’s rice has not been certified as organic. One of the main constraints to being certified stems from the irrigation chan-nels currently supplying water to conventional, organic and semi-organic pavings or paddies and have not yet been segregated. Even in areas listed as organic acreage, for example, semi-organic and conventional farming still exist (Figure 2).
Another group, called Mawar, is considered as semi-organic because most of their members still use a mixture of both chemical and organic fertilizers and pesticides. Mawar Group produces and supplies organic fertilizer not only for its own group members but also for other groups in Lubuk Bayas. The organic fertilizer processing was de-veloped in 2004 when the group awarded as the
national best farmer groups in 2003 and received a Rp.1.8 billion (U.S.$202,475) funding in 2004 for establishing the organic fertilizer processing.
Rice farming in the village of Lubuk Bayas is bequeathed from generation to generation. Results from this study shows that 93% of farmers have the same job as their parents. Most of them (90%) have their own land, but less than their parents’ land ownership (0.9 hectares and 2.3 hectares, respectively). The main cause for this reduction is the division of inheritance. Some farmers were able to increase their land area by buying from other farmers, thus many farmers owned non-contiguous land (60%). In general, labor involved in rice crop farming is family labor. More than 30% of the farmers work the entire paddy field on their own, without the help of others. Approximately 50% of the sample farmers are assisted by their wives and children, and the rest by wage earn-ers. With a land area of less than a hectare and a family consisting of three members on average, about 70% of farmers stated that their income from rice farming has not been able to meet all the needs of the family.
However, farmers do not seek other jobs be-cause by working on their own land and using family member workers, land rental and labor costs are not incurred. On average, rice farmers in Lubuk Bayas have been farming for over 20 years, with some even nearing 50 years, but in general they have only started organic rice farming in the past 5 years. Since all farmers work on their own land, farmers can directly make decisions on matters related to farming, including the conver-sion to organic farming. With planting two times
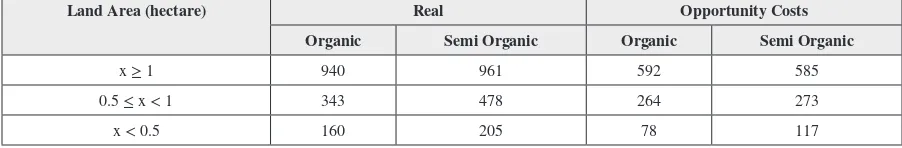
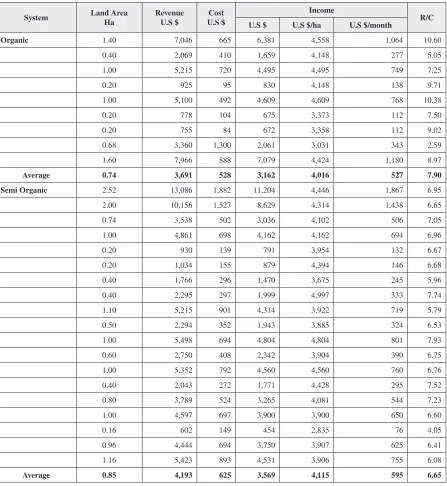
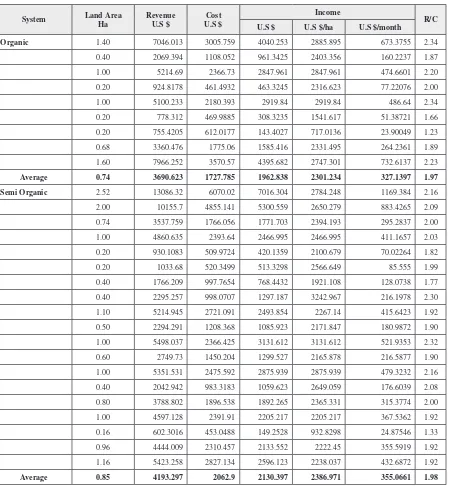
per year and an average production of 5.78 tons / season, the average monthly income per family in the village of Lubuk Bayas is Rp.5 million (U.S. $ 508/ha/month) with R/C around 7 (see Appendix). However, if the cost of labor and land rent are put into the calculation (opportunity costs) then the average monthly income earned is less than Rp.4 million (U.S.$407/ha/month) with R/C less than 2 (see Appendix). The difference between the calcu-lation of earnings per month with the calcucalcu-lation of real and opportunity costs are quite large with a range between 49% and 77%. The larger their land area is, the greater the average income. Farmers with land area more than 1 hectare, earned about Rp 9.2 million (U.S.$936) for the organic farmers and Rp.9.4 million (U.S.$956) the semi-organic farming (Table 1).
SETTING THE STAGE
In Indonesia, rice is cultivated in both lowland and upland elevations, with the upland crop typi-cally being rain fed and receiving only low levels of fertilizer applications. Irrigated lowland rice is both well watered and heavily fertilized—ac-counting for approximately 90% of total national paddy area and 94% of total production. Rice is the staple food for most Indonesians. The government estimates that its people obtain roughly 50% and 40% of their daily calorie and protein requirements, respectively, from their rice consumption (USDA, 2012). Therefore, this subsector is highly regu-lated by the government. In 1975, the government launched a rice intensification program using HYV
Table 1. Farmers’ income based on real costs and opportunity costs calculation (U.S.$/month)
Land Area (hectare) Real Opportunity Costs
Organic Semi Organic Organic Semi Organic
x ≥ 1 940 961 592 585
0.5 ≤ x < 1 343 478 264 273
and chemical fertilizers. Subsequently in 1984, the government added chemical pesticide usage to the intensification program to address the attack of hoppers. Apparently with these programs, Indo-nesia successfully achieved rice self-sufficiency in 1984 to 1986. Data from the International Fertilizer Industry Association (IFA) show that the total of Indonesian national fertilizer consump-tion increased from 144 thousand tons in 1961 to 4.47 million tons in 2009, or a 3,000% increase. However, the increasing demand of chemical fertilizers and pesticides has led to the increase in the fertilizers and pesticides prices. Food and Agricultural Organization (FAO) has documented that roughly 52% of all the fertilizer consumed is applied to the rice crop (USDA, 2012). Moreover, the impact has raised environmental quality and public health concerns. As an alternative, some NGOs and individual farmers began to develop organic rice farming. At first these efforts were regarded as in opposition to the intensification program. However, since 2001 the government has lent their support to the organic rice farming system through the “Go Organic 2010” program, which set targets to achieve significant growth of the organic industry and market within 10 years of the program. As part of their efforts, in 2004-2009, the government, through the House of Representa-tives, diverted 35.4% or Rp.6.2 trillion (U.S.$630,8 million) subsidizes from chemical fertilizers to organic fertilizers. While the chemical fertilizer subsidy was given to fertilizer companies, the organic fertilizer subsidy was given directly to farmers through the government organic fertilizer facility program in 10,000 villages. One of them is received by Mawar Group in Lubuk Bayas. This move had a huge impact because many farm-ers lack the necessary capital to risk trying new processes. Under “Go Organic 2010” a number of manufacturers with governmental assistance were successfully certified as organic. However, along with the expiration of the program, many manufacturers do not continue certification (SPOI, 2012 in AOI, 2013). Therefore, by the end of the
program, organic rice accounted for less than 20% of the market share.
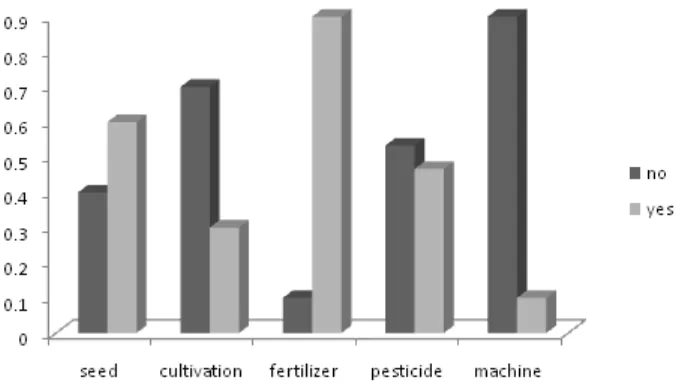
A similar scenario occurred in the implemen-tation of organic rice farming in Lubuk Bayas. Figure 3 shows that among them, the usage of organic fertilizers appear to be implemented by 90% of the farmers, while those of the organic seeds and pesticides are only 60% and 47%, re-spectively. This can be explained by the ease of access to organic fertilizers to obtain the inputs. The organic fertilizers are abundantly provided, and farmers can just buy from the Mawar Group that produces the fertilizers. In contrast, the organic seeds and pesticides are not always available, and are therefore harder to obtain.
CASE DESCRIPTION
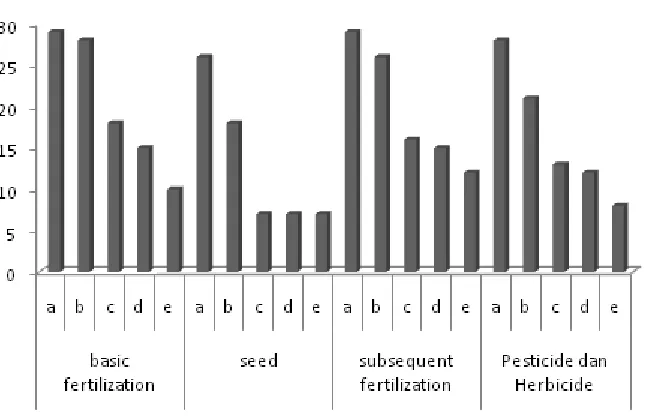
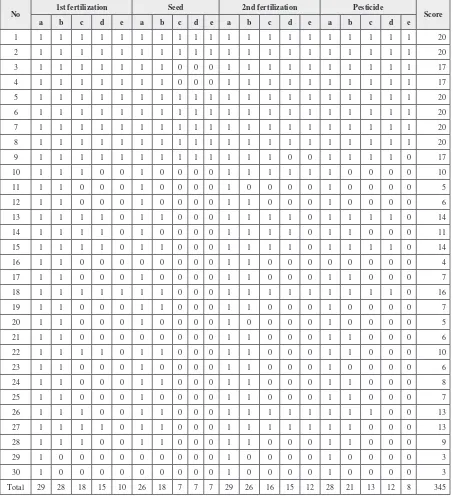
Sawkut et al. (2010) review various studies related to learning theories and describe two different points of view, whether learning is a product or a process. Both lead to a change in behavior, but the product is more observable than the process. In this case, the product of learning can be described by the achievement of innovation adoption, which is estimated from the fulfillment of 4 organic components. The first component is the basic fertilization, which is recommended to be 1 ton/ha of manure. The second component is the using of seed that has been neutralized for 1-2 growing season. The third is the subsequence fertilization, which is 25 percent of the basic fertilization plus liquid organic fertilization. The last one is the usage of 5 liters of organic pesticide plus managing the irrigation and weeding. The maximum score of the adoption of the 4 com-ponents is 16, with 3 ranges of adoption criteria from low (0 ≤ score ≤ 7), middle (7 < score ≤ 14) to high (14 < score ≤ 20). The average farmer’s score is 11.5, so it can be concluded that they are still in the middle level of adoption (see Ap-pendix). The farmers have passed the learning process and have the potential to change, but it takes time to be realized. According to Merriem
and Caffarella (1991, in Sawkut et al., 2010), not all outcomes of the learning process can be observed in the form of behavior change. This is common for the adoption of innovations related to environmental or sustainable development. The main reason is that the benefits derived from the adoption of environmental innovation are gener-ally not instantaneous; there is a transition period in which additional costs are incurred or there is a decline in production and income. As a result, the process of change is delayed until farmers have the ability to handle the associated repercussions (Chalil, 2013). This study finds that all farmers are interested in trying organic farming as long as they have sufficient time and a sufficient budget. Around 60% stated that the organic farming is only good in the long run. However, more than 25% of the sample farmers have already planned to gradu-ally decrease the use of their chemical fertilizer and substitute it with the organic one. In detail it can be seen that in all components farmers have passed knowledge and persuasion stages. In basic and subsequent fertilization only some farmers have passed the confirmation stage (Figure 4). However, the high manure transportation cost and the declining level of production reduces their
family income. Without other income sources to overcome the income shortfall, these farmers re-use the chemical fertilizers and do not reach-ing the confirmation stage. The lack of organic seed and pesticide usage significantly contribute to the low score.
The learning process can be seen through observation, communication (Tarnoczi, 2011), experience (Baars, 2011) or participation (Thaennin et al., 2012). Through observation and communication, learning can be categorized into instrumental, communicative and transformative learning. Instrumental learning is understood as a learning process to control the environment, while communicative is a process to understand what someone means. If the instrumental and communicative learning lead to a critical reflec-tion and alter the habits of mind, then transforma-tive learning occurs. Kolb and Fry (1975 in Palis 2006) explain that the learning cycle comprises four processes, including: (1) concrete experience, (2) observation and reflection, (3) the formation of abstract concepts and (4) testing in new situa-tions (Kolb & Fry, 1975, in Palis, 2006). The experience is not only limited to farmers own experience, but also other farmers’. More than
60% of the farmers obtain preliminary information on organic farming from other farmers, either from the same or different village (Figure 5). They believe other farmers that face similar conditions might give more practical and realistic solutions. The learning process occurs when they exchange their different experience, in informal conversation and shared observations until giving an opinion about one another’s farm situation (Baars, 2011; Thaennin, 2012). The adjacent farm locations in Lubuk Bayas facilitate farmers’ ability to learn from the experience of other farmers, which in turn affects the diffusion process. Moreover, they also meet on a daily basis.
The learning process covers both the acquisi-tion of knowledge and the progress of implemen-tation. The acquisition of knowledge is influenced by socioeconomics characteristics, personality variables and communication behavior (Rogers, 2003, in Putri, 2011), while the progress of imple-mentation is influenced by challenges faced by the doer (Seppänen, 2004). The doer is differen-tiated into champion farmers who adopt the or-ganic farming system mostly through self-study learning process and followers who follow other (successful) farmers’ experiences through the
diffusion process. Risgaard, Frederikson, and Kaltoft. (2007) suggested that champion farmers
are not only those that are highly informed and skilled in agriculture but who are also respected by the local community. They have a positive influence on farmers who are undergoing the learning process and have the potential to try and move on to organic farming.
In Lubuk Bayas Mr. Sarman and Mr. Kama-ruddin can be seen as champion farmers. Just like most farmers in Lubuk Bayas, Mr. Sarman first learned to cultivate paddy in the 1960s by helping his parents every day after school. His knowledge and skill were developed from repeated daily activity. During this time, farmers in Lubuk Bayas used local seed and were not using chemical fertilizers and pesticides. Therefore Mr. Sarman suggests that such a farming system can be called organic farming, although the terminology was not known yet.
After having his own farm, Mr. Sarman al-ways actively participated in various agricultural gatherings and training, including those related to paddy farming intensification. In 1970 as the paddy production center, Lubuk Bayas was also targeted as the location of intensive farming, and Mr. Sarman was even believed to coordinate the chemical fertilizers distribution for the members
of his group. However, since the late 80s, with the increasing chemical fertilizer price, organic farming was begun to be widely discussed as an alternative. Through a number of agricultural trainings held by the Government and NGOs, Mr. Sarman begun to review the concept and skills for organic paddy farming. He found that there is little difference between the concept and technique of the organic paddy farming and that obtained from his parents and from the early trainings. Both use fewer chemical inputs, but the former only relies on the naturally available soil nutrient, while the latter adds more organic inputs as the substitute for the chemical ones. In the trainings Mr. Sarman was taught how to make organic fertilizers and pesticides using available inputs in the surrounding environment. He first tried the new concept of organic farming in the 1990s, although at that time it was regarded as the opponent to the intensification program. Since then, he consistently motivates other farmers to implement organic farming. He experimented with the program and learned a lot along the way, and most of the trial and error results are recorded.
Mr. Sarman usually communicated his results with other farmers, both in formal and informal gatherings. Initially Mr. Sarman introduced and spread the organic farming information among
relatives. Many were interested because Mr. Sar-man is a good communicator. His participation in a number of gatherings and trainings indirectly improved his communication skill. Thaennin (2012) suggests that communication is important in expanding a learning process to public.
Mr. Kamaruddin’s communication skill is not as good as Mr. Sarman, but his entrepreneurship ability shows other farmers that organic farming can be profitable. In general, economic benefits are the main reason for the changes in farmers’ practices, while the environmental are secondary (Tarnoczi, 2011). Many farmers in Lubuk Bayas grow organically only in a small part of their land for family consumption but still apply the conventional farming to gain a higher income. Mr. Kamaruddin initiated an organic rice busi-ness, put an organic label on the rice package and successfully sells it with higher prices than the conventional kind. He also supplies organic pesticide, so that farmers do not have to spend more time to produce the pesticide. In addition he provides some loans for farmers, so that they can pay their debt to chemical fertilizers and pes-ticides dealers and switch their farming system to the organic one. His organic paddy’s field is located close to the main road, which is passed by many farmers. They could observe the differ-ence in performance between Mr Kamaruddin’s paddy crops with those at the adjacent locations, and began to ask about the way Mr. Kamaruddin managed his farm.
Both Mr. Sarman and Mr. Kamaruddin have five attitudes of transformative learners (Tarnoczi, 2011). First they questioned the social norms when they started practicing organic agriculture during the time when almost all farmers used chemical fertilizers and pesticides to support the govern-ment program. Second, they have enhanced their instrumental competence by consistently study-ing various organic farmstudy-ing techniques, trystudy-ing the techniques in their own land and finding the best suited to the local environmental conditions. Third, they have also set on a pathway for further
premise-based reflection by gradually developing organic farming in Lubuk Bayas. They support other farmers who are interested in learning or-ganic farming but still hesitant to fully substitute the chemical fertilizer and pesticides with the organic ones, and they help them to gradually reduce the chemical usage. Fourth, they have enhanced their communicative competence and social change not only by communicating about organic farming through verbal discussion, but also by directly showing them how. Finally, they have also gained insight into their own learning style.
organic and marketing will be accordance with the recommended standards. They do not receive salaries from the government or the farmer group. They are unlikely to be replaced as administrators until they are no longer able. These farmers have also always been active in various trainings held by the NGO and government.
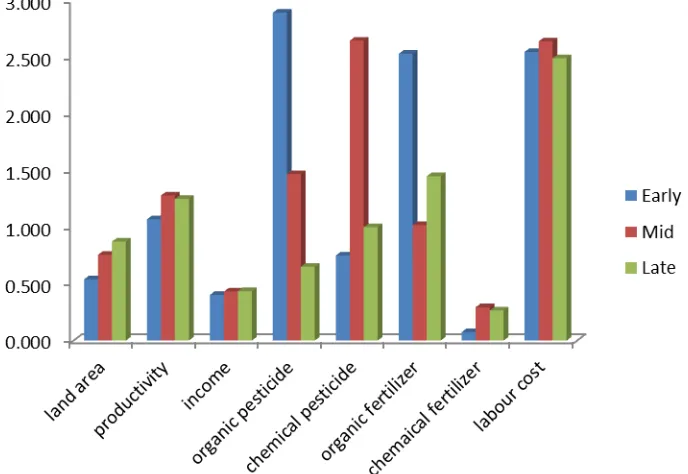
Many of the mid and late adopters have the organic knowledge and a positive perception of it far before deciding to start implementing it. They started implementing the knowledge after receiving funds to overcome the risks of trying new techniques. With the availability of produc-tion inputs and the number of sources to discuss and learn when faced with problems, late adopters require a relatively short time to pass the stage of changing in knowledge and attitude. Figure 6 shows that early adopters have minimal chemi-cal fertilizers and pesticides usage, and maximal organic fertilizers and pesticides ones. In contrast, mid and late adopters use more chemical fertil-izers and pesticides and less organic fertilizer and pesticides. However, there is no trend that shows a certain correlation between time and the level of implementation. Compared to the usage of chemi-cal fertilizer, the usage of chemichemi-cal pesticides is relatively high. Farmers assume the reduction in chemical fertilizer usage will only reduce their production levels, but the reduction in chemical pesticides usage can result in crop loss due to pests and diseases. Moreover, organic pesticides are also not widely available so that farmers have to produce it themselves, thus giving them a dis-incentive to use it.
Initially, the development of organic rice farm-ing in Lubuk Bayas was very slow, because most farmers were hesitant to try something uncertain. However, after champion farmers and early adopt-ers have proved that the production would rise again after the period of soil neutralization, the development improved. A study in Japan shows that land which has been contaminated with chemical fertilizers requires at least 5 years for recovery to achieve its optimum productivity again
(Sucihatiningsih & Soesilowati, 2012). Based on experience, Lubuk Bayas farmers suggest that the recovery process will only require 0.5 to 2.5 years. However, Figure 6 shows many farmers still in-consistently use the organic fertilizers and pesti-cides, thus the land restoration process became ineffective. Moreover, on average the input us-ages are still lower than recommended, thus the result is not optimal (Table 2).
However, such conditions are still happening from time to time. One reason is that farmers do not have records on their input usage and level of production. They believe that it might be good to have such records and use it for evaluation and planning, but most of the farmers do not have enough time for updating records regularly. More-over, comparing to other internal factors, most farmers think the influence of recording is not very significant (see Appendix).
land preparation to harvest. Almost all the sample farmers stated that Farmer Field School (FFS) is the best teaching method. The learning style that uses practices from stage to stage is known as Concrete Sequential Learning Style (Johnson et al., 2008). At the time of learning from their parents, farmers also used a similar learning style, but the stages in the Farmer Field School are more planned and structured, and are completed with the case problem solving. Therefore, the learning process in the Farmer Field School requires a shorter time than those undertaken with their parents.
In organic paddy farming, the Farmer Field School needs 21 weekly sessions, comprising 5 weeks for raising their awareness and establishing the concept of organic farming, and 16 weeks for learning the cultivation techniques. During the awareness topic meetings, facilitators reminded the participants about the benefit of organic farm-ing system that has been experienced with their parents. Generally this leads to a positive effect on farmers’ perceptions of organic farming, espe-cially those who are in their 50s. The cultivation technique topics are designed by an NGO called Bitra, based on various farmers’ experiences in
Figure 6. Input usages among early, mid and late adopters
Table 2. Recommendation and Realization of Inputs
System Type Recommendation Realization %
Organic Organic fertilizer 2 tons/ha 1,5 tons/ha 74
Organic pesticide 5 liter/ha 1.3 liter/ha 26
Semi Organic Organic fertilizer 2 tons/ha 0.8 tons/ha 44
Urea 0.5 tons/ha 0.3 ton/ha 65
organic farming, including both from local and other region farmers. Some of the experiences even came from farmers from other countries, such as Japan and Philippines, which were obtained by sending their staff to study organic farming in those countries. Therefore, the topics cover fewer theories and more “bottom-up” experiences. The topics are delivered by a Bitra facilitator who was a local farmer and has been trained in Japan and Philippines, or who has surveyed various organic farming methods from various villages in Indo-nesia. Learning activities are based on farmer experimentation and take place in the fields of agriculture. The session begins with a discussion of a simple theory, and is followed by practice and observation. Farmers observe the growth of the organic paddy crop, within three different organic cultivation systems. Each system is managed by a group of ten, including champion farmers, NGO staff and extension workers. Farmers in each group are mixed between older farmers who had experienced the organic farming with their par-ents and younger farmers who had used chemical fertilizers and pesticides since the very beginning. Group learning has several advantages compared to individual learning. First, group learning allows for interaction between farmers with different experience, knowledge and skills (Baars, 2011). Second, farmers enjoy teaching each other, hence creating an environment conducive to learning for farmers (Franz et al., 2010). Third, group learning also allows farmers for collectively overcoming physical or socio-economics fears of taking risks in adopting uncertain innovation (Palis, 2006). This is especially beneficial for the adoption of envi-ronmental innovations such as organic farming, where the effects are not instantaneous. Fourth, group learning can also improve participants’ self-esteem since their knowledge was validated and recognized as integral to the group learning process (Blisset et al., 2004). Finally, group learn-ing can also encourage farmers to help each other in the community (Thaennin, 2012).
Having completed a Farmer Field School these early adopters still continue the regular learning process. For example, in the Farmer Field School they use cow manure produced by farmer groups in their neighbor village. However, after applying it in 2-4 growing season, they found that goat manure produced by themselves has a better qual-ity and gives higher production. They also found that lower and more humid land need a smaller amount of manure. This shows that these early adopters learn not only through active experi-ence but also reflective observation, which leads them to the abstract conceptualization and active experimentation to find solutions.
CURRENT CHALLENGES
FACING THE ORGANIZATION
Organic farming is one of the innovations related to environmental issues. Environmental innovation is generally more difficult to be accepted as com-pared with non-environmental innovations. The main cause is the perceived benefits of adopting environmental innovation are not instantaneous. There at the time of the transition, farmers have to face the decline in production and income. As a result, it is not uncommon that farmers who have adopted organic farming could not continue to do so. Similar situations happen to organic rice farmers in Lubuk Bayas; bulky organic fertilizer requires higher transportation costs and workers. In fact, many farmers only work alone or assisted by a spouse and have nine working hours every day. Therefore, taking more working hours would be relatively difficult for them.
conventional, the difference is not enough to cover the decrease of production. The organic price will be higher if it has been certified. According to Standard Operating Procedures (SOP) issued by the Department of Agriculture (2007) certification of organic rice will be given if the basic principles of cultivation, post-harvest and marketing of or-ganic farming have been fulfilled. Related to this there are several things that must be fixed. First, farmers in Lubuk Bayas understand that they can produce organic rice as long as they use neutral-ized seeds and fully use organic fertilizers and pesticides. However, organic rice produced also need to be free from chemicals, including from the irrigation water. In Lubuk Bayas there is only one source of irrigation, which is used by all farmers, including those with organic, semi-organic and conventional farming. Moreover, locations of the three farming systems are not separated, and they also share the same rice milling.
Another challenge is the dominance of the
champion farmers. Champion farmers carry out almost all activities, ranging from participating in the Training for Trainers, designing and socializing the program, mobilizing members of the group, until evaluating and monitoring through ICS. It will not be a problem as long as the champion farmers
are still be able to maintain the learning process among all farmers in Lubuk Bayas. However, with the increasing number of farmers involved in the program, ideally the system of farmer groups needs to be more active with more equitable role division among farmers. With a good system, the continuity of the learning process will not depend only on few champion farmers, thus the accelera-tion of the learning process would be better.
SOLUTIONS AND
RECOMMENDATIONS
Previous explanation shows that the first problem is an unsustainable learning process, which is caused mainly by the lag between time of
imple-mentation and receiving benefits. Farmers need to cover extra costs of transporting organic fertilizer to farm locations. To solve this, the government can establish organic fertilizer processing sites or warehouses close to farm locations. Alternatively, government or financial institutions could also provide loans with soft interest. Finally, to ensure that the transition goes smoothly, farmers must be intensively accompanied by extension agents, ICS coordinators or NGOs, to ensure farmers use organic fertilizers or pesticides in accordance with the needs of each development of adaptation.
The second problem is the income decrease. To overcome this, the government together with farmer groups can make an effort to differentiate their products and receive a higher selling price. First, government and farmers can select market-ing channels and segmented consumers that are willing to buy at a premium price. This could be in the modern market, specialty organic food shops or European markets. This means that farmers’ products need to be certified. As a consequence, farmers need to fulfill all of the organic require-ments, including the use of uncontaminated irri-gation water. Currently, all the farmers, whether organic or not, use the same irrigation water with same irrigation channels. The problem can be remedied if all the farmers agree to convert their farming to organic. Another alternative is to have a separate irrigation for organic and nonorganic farming.
REFERENCES
Blisset, H., Simmons, S., Jordan, N., & Nelson, K. (2004). Evaluation of learning group approaches for fostering integrated cropping systems man-agement. Journal of Natural Resources and Life Sciences Education, 33, 134–140.
Chalil, D. (2013). Assessment of smallholders’ barriers to adopt sustainable practices: Case study on oil palm (Elaesis Guineensis) smallholders’ certification in North Sumatra, Indonesia. In M. E. Muga, & K. D. Thomas (Eds.), Cases on the diffusion and adoption of sustainable develop-ment practices (pp. 439–467). Hershey, PA: IGI Global, USA.
Department of Agriculture. (2007). Pedoman penyusunan Standar Prosedur Operasional (SPO) padi organik. Direktorat Pengolahan Hasil Pertanian, Ditjen Pengolahan dan Pemasaran Hasil Pertanian. Jakarta, Indonesia: Departemen Pertanian.
Franz, N., Piercy, F., Donaldson, J., Richard, R., & Westbrook, J. (2010). How farmers learn: Implications for agricultural educators. Journal of Rural Social Science, 25(1), 37–59.
Johnson, S. B., Carter, H. S., & Kaufman, E. K. (2008). Learning styles of farmers and others involved with the Maine potato industry. Journal of Extension, 46(4).
Nuryanti & Swastika. (2011). Peran kelompok tani dalam penerapan teknologi pertanian. Forum Penelitian Agro Ekonomi, 29(2), 115–128. Palis, F. G. (2006). The role of culture in farmer learning and technology adoption: A case study of farmer field schools among rice farmers in Central Luzon, Philippines. Agriculture and Hu-man Values, 23, 491–500. doi:10.1007/s10460-006-9012-6
Putri, N. I. (2011). Penerapan teknologi pertanian padi organik di Kampung Ciburuy, Desa Ciburuy, Kecamatan Cigombong, Kabupaten Bogor (Un-published undergraduate thesis). Institut Pertanian Bogor, Bogor, Indonesia.
Risgaard, M. L., Frederikson, P., & Kaltoft, P. (2007). Socio-cultural processes behind the differ-ential distribution of organic farming in Denmark: A case study. Agriculture and Human Values, 24, 445–459. doi:10.1007/s10460-007-9092-y Sawkut, R., Seetanah, B., Sanassee, V., & Lamport, M. (2010). Learning theories: A Review. Oxford Business and Economics Conference Program. Retrieved June 20, 2013 from http://www.gebe. us/2010_obec/data/confc.d/index.htm
Seppänen, L. (2004). Learning challenges in or-ganic vegetable farming: An activity theoretical study on-farm practices (Unpublished doctoral dissertation). University of Helsinki, Helsinki, Finland.
Sucihatiningsih, D. W. P., & Soesilowati, E. (2012). The effectiveness of policy ” Go Organic “: A study on implementation and efficiency of organic vegetable cultivation in Semarang Municipality.
Sociology Study, 2(6), 468–482.
Tarnoczi, T. (2011). Transformative learning and adaptation to climate change in the Canadian Prairie agro-ecosystem. Mitigation and Adapta-tion Strategies for Global Change, 16, 387–406. doi:10.1007/s11027-010-9265-7
KEY TERMS AND DEFINITIONS
Champion Farmers: Farmers who have extensive experience in farming and mastered the knowledge and skills, and diffused them to other farmers.
High Yielding Varieties (HYV): Hybrid seeds that have been selected and developed to give high productivity with using more chemical fertilizers and pesticides.
Intensification: An effort to increase agricul-tural production without expanding the planting area, but by increasing the land productivity (for example by using HYV seeds, closer planting spaces or more chemical fertilizers.
Learning Process: A process that people pass through to acquire new knowledge and skills and ultimately influence their attitudes, decisions and actions.
Level of Adoption: The level of acceptance of an innovation, which consists of five stages namely knowledge, persuasion, decision, implementation and confirmation.
Organic Paddy: Rice paddy that is produced using free chemical seeds, fertilizers and pesti-cides.
APPENDIX
Table 3. Paddy farm financial analysis based on real cost
System Land Area Ha
Revenue U.S $
Cost U.S $
Income
R/C U.S $ U.S $/ha U.S $/month
Organic 1.40 7,046 665 6,381 4,558 1,064 10.60
0.40 2,069 410 1,659 4,148 277 5.05
1.00 5,215 720 4,495 4,495 749 7.25
0.20 925 95 830 4,148 138 9.71
1.00 5,100 492 4,609 4,609 768 10.38
0.20 778 104 675 3,373 112 7.50
0.20 755 84 672 3,358 112 9.02
0.68 3,360 1,300 2,061 3,031 343 2.59
1.60 7,966 888 7,079 4,424 1,180 8.97
Average 0.74 3,691 528 3,162 4,016 527 7.90
Semi Organic 2.52 13,086 1,882 11,204 4,446 1,867 6.95
2.00 10,156 1,527 8,629 4,314 1,438 6.65
0.74 3,538 502 3,036 4,102 506 7.05
1.00 4,861 698 4,162 4,162 694 6.96
0.20 930 139 791 3,954 132 6.67
0.20 1,034 155 879 4,394 146 6.68
0.40 1,766 296 1,470 3,675 245 5.96
0.40 2,295 297 1,999 4,997 333 7.74
1.10 5,215 901 4,314 3,922 719 5.79
0.50 2,294 352 1,943 3,885 324 6.53
1.00 5,498 694 4,804 4,804 801 7.93
0.60 2,750 408 2,342 3,904 390 6.75
1.00 5,352 792 4,560 4,560 760 6.76
0.40 2,043 272 1,771 4,428 295 7.52
0.80 3,789 524 3,265 4,081 544 7.23
1.00 4,597 697 3,900 3,900 650 6.60
0.16 602 149 454 2,835 76 4.05
0.96 4,444 694 3,750 3,907 625 6.41
1.16 5,423 893 4,531 3,906 755 6.08
Table 4. Paddy farm financial analysis based on opportunity cost
System Land Area Ha
Revenue U.S $
Cost U.S $
Income
R/C U.S $ U.S $/ha U.S $/month
Organic 1.40 7046.013 3005.759 4040.253 2885.895 673.3755 2.34
0.40 2069.394 1108.052 961.3425 2403.356 160.2237 1.87
1.00 5214.69 2366.73 2847.961 2847.961 474.6601 2.20
0.20 924.8178 461.4932 463.3245 2316.623 77.22076 2.00
1.00 5100.233 2180.393 2919.84 2919.84 486.64 2.34
0.20 778.312 469.9885 308.3235 1541.617 51.38721 1.66
0.20 755.4205 612.0177 143.4027 717.0136 23.90049 1.23
0.68 3360.476 1775.06 1585.416 2331.495 264.2361 1.89
1.60 7966.252 3570.57 4395.682 2747.301 732.6137 2.23
Average 0.74 3690.623 1727.785 1962.838 2301.234 327.1397 1.97
Semi Organic 2.52 13086.32 6070.02 7016.304 2784.248 1169.384 2.16
2.00 10155.7 4855.141 5300.559 2650.279 883.4265 2.09
0.74 3537.759 1766.056 1771.703 2394.193 295.2837 2.00
1.00 4860.635 2393.64 2466.995 2466.995 411.1657 2.03
0.20 930.1083 509.9724 420.1359 2100.679 70.02264 1.82
0.20 1033.68 520.3499 513.3298 2566.649 85.555 1.99
0.40 1766.209 997.7654 768.4432 1921.108 128.0738 1.77
0.40 2295.257 998.0707 1297.187 3242.967 216.1978 2.30
1.10 5214.945 2721.091 2493.854 2267.14 415.6423 1.92
0.50 2294.291 1208.368 1085.923 2171.847 180.9872 1.90
1.00 5498.037 2366.425 3131.612 3131.612 521.9353 2.32
0.60 2749.73 1450.204 1299.527 2165.878 216.5877 1.90
1.00 5351.531 2475.592 2875.939 2875.939 479.3232 2.16
0.40 2042.942 983.3183 1059.623 2649.059 176.6039 2.08
0.80 3788.802 1896.538 1892.265 2365.331 315.3774 2.00
1.00 4597.128 2391.91 2205.217 2205.217 367.5362 1.92
0.16 602.3016 453.0488 149.2528 932.8298 24.87546 1.33
0.96 4444.009 2310.457 2133.552 2222.45 355.5919 1.92
1.16 5423.258 2827.134 2596.123 2238.037 432.6872 1.92
Table 5. Level of adoption score
No
1st fertilization Seed 2nd fertilization Pesticide
Score
a b c d e a b c d e a b c d e a b c d e
1 1 1 1 1 1 1 1 1 1 1 1 1 1 1 1 1 1 1 1 1 20
2 1 1 1 1 1 1 1 1 1 1 1 1 1 1 1 1 1 1 1 1 20
3 1 1 1 1 1 1 1 0 0 0 1 1 1 1 1 1 1 1 1 1 17
4 1 1 1 1 1 1 1 0 0 0 1 1 1 1 1 1 1 1 1 1 17
5 1 1 1 1 1 1 1 1 1 1 1 1 1 1 1 1 1 1 1 1 20
6 1 1 1 1 1 1 1 1 1 1 1 1 1 1 1 1 1 1 1 1 20
7 1 1 1 1 1 1 1 1 1 1 1 1 1 1 1 1 1 1 1 1 20
8 1 1 1 1 1 1 1 1 1 1 1 1 1 1 1 1 1 1 1 1 20
9 1 1 1 1 1 1 1 1 1 1 1 1 1 0 0 1 1 1 1 0 17
10 1 1 1 0 0 1 0 0 0 0 1 1 1 1 1 1 0 0 0 0 10
11 1 1 0 0 0 1 0 0 0 0 1 0 0 0 0 1 0 0 0 0 5
12 1 1 0 0 0 1 0 0 0 0 1 1 0 0 0 1 0 0 0 0 6
13 1 1 1 1 0 1 1 0 0 0 1 1 1 1 0 1 1 1 1 0 14
14 1 1 1 1 0 1 0 0 0 0 1 1 1 1 0 1 1 0 0 0 11
15 1 1 1 1 0 1 1 0 0 0 1 1 1 1 0 1 1 1 1 0 14
16 1 1 0 0 0 0 0 0 0 0 1 1 0 0 0 0 0 0 0 0 4
17 1 1 0 0 0 1 0 0 0 0 1 1 0 0 0 1 1 0 0 0 7
18 1 1 1 1 1 1 1 0 0 0 1 1 1 1 1 1 1 1 1 0 16
19 1 1 0 0 0 1 1 0 0 0 1 1 0 0 0 1 0 0 0 0 7
20 1 1 0 0 0 1 0 0 0 0 1 0 0 0 0 1 0 0 0 0 5
21 1 1 0 0 0 0 0 0 0 0 1 1 0 0 0 1 1 0 0 0 6
22 1 1 1 1 0 1 1 0 0 0 1 1 0 0 0 1 1 0 0 0 10
23 1 1 0 0 0 1 0 0 0 0 1 1 0 0 0 1 0 0 0 0 6
24 1 1 0 0 0 1 1 0 0 0 1 1 0 0 0 1 1 0 0 0 8
25 1 1 0 0 0 1 0 0 0 0 1 1 0 0 0 1 1 0 0 0 7
26 1 1 1 0 0 1 1 0 0 0 1 1 1 1 1 1 1 1 0 0 13
27 1 1 1 1 0 1 1 0 0 0 1 1 1 1 1 1 1 0 0 0 13
28 1 1 1 0 0 1 1 0 0 0 1 1 0 0 0 1 1 0 0 0 9
29 1 0 0 0 0 0 0 0 0 0 1 0 0 0 0 1 0 0 0 0 3
30 1 0 0 0 0 0 0 0 0 0 1 0 0 0 0 1 0 0 0 0 3
Table 6. Weighted score of internal and external factors
Internal Factors Weight Score Weighted score
Strengths
Farmer human resource 0.14 2.57 0.37
Level of production 0.12 2.21 0.27
Organic farming management 0.16 2.21 0.36
Farmer perception 0.19 2.71 0.52
Capital availability 0.15 3.00 0.46
Level of income 0.12 2.11 0.25
Weaknesses
Land Area 0.05 1.39 0.07
Farm record 0.05 1.21 0.07
Total 1.00 2.37
External Factors Weight Score Weighted score
Opportunities
Input availability 0.14 3.52 0.50
Marketing 0.15 2.33 0.36
Farm Group Support 0.17 3.76 0.64
NGO support 0.13 4.00 0.51
Threats
Huller and Drying Floor availability 0.17 1.76 0.30
Rice quality 0.09 1.21 0.11
Government support 0.09 2.00 0.19
Irrigation system 0.05 2.00 0.10