Refining the Concept of Scientific Inference
When Working with Big Data
Proceedings of a Workshop
Ben A. Wender,
Rapporteur
Committee on Applied and Theoretical Statistics
Board on Mathematical Sciences and Their Applications
Division on Engineering and Physical Sciences
THE NATIONAL ACADEMIES PRESS
Washington, DC
THE NATIONAL ACADEMIES PRESS 500 Fifth Street, NW Washington, DC 20001
This workshop was supported by Contract No. HHSN26300076 with the National Institutes of Health and Grant No. DMS-1351163 from the National Science Foundation. Any opinions, findings, or conclusions expressed in this publication do not necessarily reflect the views of any organization or agency that provided support for the project.
International Standard Book Number-13: 978-0-309-45444-5 International Standard Book Number-10: 0-309-45444-1 Digital Object Identifier: 10.17226/24654
Epub ISBN: 978-0-309-45447-6
This publication is available in limited quantities from: Board on Mathematical Sciences and Their Applications 500 Fifth Street NW
Washington, DC 20001 [email protected]
http://www.nas.edu/bmsa
Additional copies of this publication are available for sale from the National Academies Press, 500 Fifth Street, NW, Keck 360, Washington, DC 20001; (800) 624-6242 or (202) 334-3313; http://www .nap.edu.
Copyright 2017 by the National Academy of Sciences. All rights reserved. Printed in the United States of America
The National Academy of Sciences was established in 1863 by an Act of Congress, signed by President Lincoln, as a private, nongovernmental institution to advise the nation on issues related to science and technology. Members are elected by their peers for outstanding contributions to research. Dr. Marcia McNutt is president.
The National Academy of Engineering was established in 1964 under the charter of the National Academy of Sciences to bring the practices of engineering to advising the nation. Members are elected by their peers for extraordinary contributions to engineering. Dr. C. D. Mote, Jr., is president.
The National Academy of Medicine (formerly the Institute of Medicine) was established in 1970 under the charter of the National Academy of Sciences to advise the nation on medical and health issues. Members are elected by their peers for distinguished contributions to medicine and health. Dr. Victor J. Dzau is president.
The three Academies work together as the National Academies of Sciences, Engineering, and Medicine to provide independent, objective analysis and advice to the nation and conduct other activities to solve complex problems and inform public policy decisions. The National Academies also encourage education and research, recognize outstanding contributions to knowledge, and increase public understanding in matters of science, engineering, and medicine.
Reports document the evidence-based consensus of an authoring committee of experts. Reports typically include findings, conclusions, and recommendations based on information gathered by the committee and committee deliberations. Reports are peer reviewed and are approved by the National Academies of Sciences, Engineering, and Medicine.
Proceedings chronicle the presentations and discussions at a workshop, symposium, or other convening event. The statements and opinions contained in proceedings are those of the participants and have not been endorsed by other participants, the planning committee, or the National Academies of Sciences, Engineering, and Medicine.
PLANNING COMMITTEE ON REFINING THE CONCEPT OF
SCIENTIFIC INFERENCE WHEN WORKING WITH BIG DATA
MICHAEL J. DANIELS, University of Texas, Austin, Co-Chair
ALFRED O. HERO III, University of Michigan, Co-Chair
GENEVERA ALLEN, Rice University and Baylor College of Medicine CONSTANTINE GATSONIS, Brown University
GEOFFREY GINSBURG, Duke University
MICHAEL I. JORDAN, NAS1/NAE,2 University of California, Berkeley ROBERT E. KASS, Carnegie Mellon University
MICHAEL KOSOROK, University of North Carolina, Chapel Hill RODERICK J.A. LITTLE, NAM,3 University of Michigan
JEFFREY S. MORRIS, MD Anderson Cancer Center
RONITT RUBINFELD, Massachusetts Institute of Technology
Staff
MICHELLE K. SCHWALBE, Board Director BEN A. WENDER, Associate Program Officer LINDA CASOLA, Staff Editor
RODNEY N. HOWARD, Administrative Assistant ELIZABETH EULLER, Senior Program Assistant __________________
COMMITTEE ON APPLIED AND THEORETICAL STATISTICS
CONSTANTINE GATSONIS, Brown University, Chair
DEEPAK AGARWAL, LinkedIn
MICHAEL J. DANIELS, University of Texas, Austin KATHERINE BENNETT ENSOR, Rice University
MONTSERRAT (MONTSE) FUENTES, North Carolina State University ALFRED O. HERO III, University of Michigan
AMY HERRING, University of North Carolina, Chapel Hill
DAVID M. HIGDON, Social Decision Analytics Laboratory, Biocomplexity Institute of Virginia Tech
ROBERT E. KASS, Carnegie Mellon University JOHN LAFFERTY, University of Chicago
JOSÉ M.F. MOURA, NAE, Carnegie Mellon University SHARON-LISE T. NORMAND, Harvard University ADRIAN RAFTERY, NAS, University of Washington LANCE WALLER, Emory University
EUGENE WONG, NAE, University of California, Berkeley
Staff
MICHELLE K. SCHWALBE, Director
LINDA CASOLA, Research Associate and Staff Writer/Editor BETH DOLAN, Financial Associate
BOARD ON MATHEMATICAL SCIENCES AND THEIR
APPLICATIONS
DONALD SAARI, NAS, University of California, Irvine, Chair
DOUGLAS N. ARNOLD, University of Minnesota
JOHN B. BELL, NAS, Lawrence Berkeley National Laboratory VICKI M. BIER, University of Wisconsin, Madison
JOHN R. BIRGE, NAE, University of Chicago RONALD COIFMAN, NAS, Yale University
L. ANTHONY COX, JR., NAE, Cox Associates, Inc. MARK L. GREEN, University of California, Los Angeles PATRICIA A. JACOBS, Naval Postgraduate School BRYNA KRA, Northwestern University
JOSEPH A. LANGSAM, Morgan Stanley (retired) SIMON LEVIN, NAS, Princeton University
ANDREW W. LO, Massachusetts Institute of Technology DAVID MAIER, Portland State University
WILLIAM A. MASSEY, Princeton University JUAN C. MEZA, University of California, Merced FRED S. ROBERTS, Rutgers University
GUILLERMO R. SAPIRO, Duke University CARL P. SIMON, University of Michigan
KATEPALLI SREENIVASAN, NAS/NAE, New York University ELIZABETH A. THOMPSON, NAS, University of Washington
Staff
MICHELLE K. SCHWALBE, Board Director NEAL GLASSMAN, Senior Program Officer
LINDA CASOLA, Research Associate and Staff Writer/Editor BETH DOLAN, Financial Associate
Acknowledgment of Reviewers
This proceedings has been reviewed in draft form by individuals chosen for their diverse perspectives and technical expertise. The purpose of this independent review is to provide candid and critical comments that will assist the institution in making its published proceedings as sound as possible and to ensure that the proceedings meets institutional standards for objectivity, evidence, and responsiveness to the study charge. The review comments and draft manuscript remain confidential to protect the integrity of the deliberative process. We wish to thank the following individuals for their review of this proceedings:
Joseph Hogan, Brown University,
Iain Johnstone, NAS, Stanford University, Xihong Lin, Harvard University, and
Hal Stern, University of California, Irvine.
Contents
1 INTRODUCTION Workshop Overview Workshop Themes
Organization of This Workshop Proceedings 2 FRAMING THE WORKSHOP
Perspectives from Stakeholders
Introduction to the Scientific Content of the Workshop
3 INFERENCE ABOUT DISCOVERIES BASED ON INTEGRATION OF DIVERSE DATA SETS Data Integration with Diverse Data Sets
Data Integration and Iterative Testing Panel Discussion
Statistical Data Integration for Large-Scale Multimodal Medical Studies Discussion of Statistical Integration for Medical and Health Studies Panel Discussion
4 INFERENCE ABOUT CAUSAL DISCOVERIES DRIVEN BY LARGE 30 OBSERVATIONAL DATA
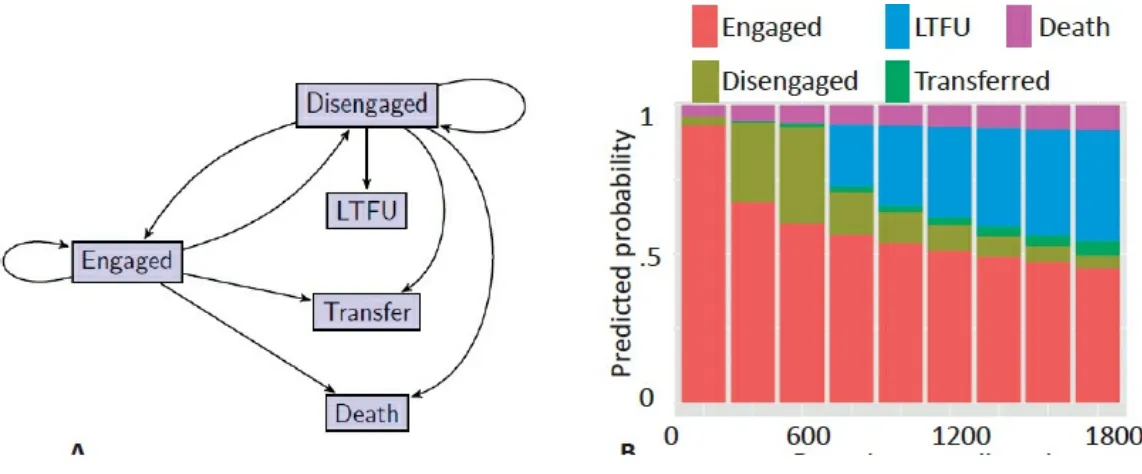
Using Electronic Health Records Data for Causal Inferences About the Human Immunodeficiency Virus Care Cascade
Discussion of Causal Inferences on the Human Immunodeficiency Virus Care Cascade from Electronic Health Records Data
Panel Discussion
A General Framework for Selection Bias due to Missing Data in Electronic Health Records-Based Research
Discussion of Comparative Effectiveness Research Using Electronic Health Records Panel Discussion
5 INFERENCE WHEN REGULARIZATION IS USED TO SIMPLIFY FITTING OF HIGH-DIMENSIONAL MODELS
Learning from Time
Discussion of Learning from Time Panel Discussion
Selective Inference in Linear Regression
Discussion of Statistics and Big Data Challenges in Neuroscience Panel Discussion
6 PANEL DISCUSSION
Research Priorities for Improving Inferences from Big Data Inference Within Complexity and Computational Constraints Education and Cross-disciplinary Collaboration
Identification of Questions and Appropriate Uses for Available Data Facilitation of Data Sharing and Linkage
The Boundary Between Biostatistics and Bioinformatics REFERENCES
APPENDIXES
A Registered Workshop Participants B Workshop Agenda
1
Introduction
The concept of utilizing big data to enable scientific discovery has generated tremendous excitement and investment from both private and public sectors over the past decade, and expectations continue to grow (FTC, 2016; NITRD/NCO, 2016). Big data is considered herein as data sets whose heterogeneity, complexity, and size—typically measured in terabytes or petabytes— exceed the capability of traditional approaches to data processing, storage, and analysis. Using big data analytics to identify complex patterns hidden inside volumes of data that have never been combined could accelerate the rate of scientific discovery and lead to the development of beneficial technologies and products. For example, an analysis of big data combined from a patient’s electronic health records (EHRs), environmental exposure, activities, and genetic and proteomic information is expected to help guide the development of personalized medicine. However, producing actionable scientific knowledge from such large, complex data sets requires statistical models that produce reliable inferences (NRC, 2013). Without careful consideration of the suitability of both available data and the statistical models applied, analysis of big data may result in misleading correlations and false discoveries, which can potentially undermine confidence in scientific research if the results are not reproducible. Thus, while researchers have made significant progress in developing techniques to analyze big data, the ambitious goal of inference remains a critical challenge.
WORKSHOP OVERVIEW
The Committee on Applied and Theoretical Statistics (CATS) of the National Academies of Sciences, Engineering, and Medicine convened a workshop on June 8-9, 2016, to examine critical challenges and opportunities in performing scientific inference reliably when working with big data. With funding from the National Institutes of Health (NIH) Big Data to Knowledge (BD2K) program and the National Science Foundation (NSF) Division of Mathematical Sciences, CATS established a planning committee (see p. v) to develop the workshop agenda (see Appendix B). The workshop statement of task is shown in Box 1.1. More than 700 people registered to participate in the workshop either in person or online (see Appendix A).
and Medicine. In addition to the summary provided here, materials related to the workshop can be found on the CATS webpage (http://www.nas.edu/statistics), including speaker presentations and archived webcasts of presentation and discussion sessions.
BOX 1.1 Statement of Task
An ad hoc committee appointed by the National Academies of Sciences, Engineering, and Medicine will plan and organize a workshop to examine challenges in applying scientific inference to big data in biomedical applications. To this end, the workshop will explore four key issues of scientific inference:
Inference about causal discoveries driven by large observational data, Inference about discoveries from data on large networks,
Inference about discoveries based on integration of diverse data sets, and
Inference when regularization is used to simplify fitting of high-dimensional models. In addressing these four issues, the workshop will:
Bring together statisticians, data scientists, and domain researchers from different biomedical disciplines,
Identify new methodologic developments that hold significant promise, and Highlight potential research program areas for the future.
One or more rapporteurs who are not members of the committee will be designated to prepare a workshop summary.
WORKSHOP THEMES
While the workshop presentations spanned multiple disciplines and active domains of research, several themes emerged across the two days of presentations, including the following: (1) big data holds both great promise and perils, (2) inference requires evaluating uncertainty, (3) statisticians must engage early in experimental design and data collection activities, (4) open research questions can propel both the domain sciences and the field of statistics forward, and (5) opportunities exist to strengthen statistics education at all levels. Although some of these themes are not specific to analyses of big data, the challenges are exacerbated and opportunities greater in the context of large, heterogeneous data sets. These themes, described in greater detail below and expanded upon throughout this proceedings, were identified for this publication by the rapporteur and were not selected by the workshop participants or planning committee. Outside of the identified themes, many other important questions were raised with varying levels of detail as described in the summary of individual speaker presentations.
Many presenters called attention to the tremendous amount of information available through large, complex data sets and described their potential to lead to new scientific discoveries that improve health care research and practice. Unfortunately, such large data sets often contain messy data with confounding factors and, potentially, unidentified biases. These presenters suggested that all of these factors and others be considered during analysis. Many big data sources—such as EHRs—are not collected with a specific research objective in mind and instead represent what presenter Joseph Hogan referred to as “found data.” A number of questions arise when trying to use these data to answer specific research questions, such as whether the data are representative of a well-defined population of interest. These often unasked questions are fundamental to the reliability of any inferences made from these data.
With a proliferation of measurement technologies and large data sets, often the number of variables (p) greatly exceeds the number of samples (n), which makes evaluation of the significance of discoveries both challenging and critically important, explained Michael Daniels. Much of the power of big data comes from combining multiple data sets containing different types of information from diverse individuals that were collected at different times using different equipment or experimental procedures. Daniels explained that this can lead to a host of challenges related to small sample sizes, the presence of batch effects, and other sources of noise that may be unknown to the analyst. For such reasons, uncritical analysis of these data sets can lead to misleading correlations and publication of irreproducible results. Thus, big data analytics offers tremendous opportunities but is simultaneously characterized by numerous potential pitfalls, said Daniels. With such abundant, messy, and complex data, “statistical principles could hardly be more important,” concluded Hogan.
Andrew Nobel cautioned that “big data isn’t necessarily the right data” for answering a specific question. He alluded to the fundamental importance of defining the question of interest and assessing the suitability of the available data to support inferences about that question. Across the 2-day workshop, there was notable variety in the inferential tasks described; for example, Sebastien Haneuse described a comparative effectiveness study of two antidepressants to draw inferences about differential effects on weight gain, whereas Daniela Witten described the use of inferential tools to aid in scientific discovery. Some presenters remarked that big data may invite analysts to overuse exploratory analyses to define research questions and underemphasize the fundamental issues of data suitability and bias. Understanding bias is particularly important with large, complex data sets such as EHRs, explained Daniels, as analysts may not have control over sample selection among other sources of bias. Alfred Hero explained that when working with large data sets that contain information on many diverse variables, quantifying bias and understanding the conditions necessary for replicability can be particularly challenging. Haneuse encouraged researchers using EHRs to compare available data to those data that would result from the ideal randomized trial as a strategy to define missing data and explore selection bias. More broadly, when analyses of big data are used for scientific discovery, to help form scientific conclusions, or to inform decision making, statistical reasoning and inferential formalism are required.
Inference Requires Evaluating Uncertainty
Genevera Allen, Daniela Witten, Michael Kosorok, and Bin Yu). For example, data mining algorithms that generate network structures representing a snapshot of complex genetic processes are of limited value without some understanding of the reliability of the nodes and edges identified, which in this case correspond to specific genes and potential regulatory relationships, respectively. In an applied setting, Allen and Witten suggested using several estimation techniques on a single data set and similarly using a single estimation technique with random subsamples of the observations. In practice, results that hold up across estimation techniques and across subsamples of the data are more likely to be scientifically useful. While this approach offers a starting place, researchers would prefer the ability to compute a confidence interval or false discovery rate for network features of interest. Assessment and communication of uncertainty are particularly important and challenging for exploratory data analyses, which should be viewed as hypothesis-generating activities with high levels of uncertainty to be addressed through follow-up data collection and confirmatory analyses.
Statisticians Must Engage Early in Experimental Design and Data Collection
Activities
Emery Brown, Xihong Lin, Cosma Shalizi, Alfred Hero, and Robert Kass noted that too often statisticians become involved in scientific research projects only after experiments have been designed and data collected. Inadequate involvement of statisticians in such “upstream” activities can negatively impact “downstream” inference, owing to suboptimal collection of information necessary for reliable inference. Furthermore, these speakers indicated that it is increasingly important for statisticians to become involved early in and throughout the research process so as to consider the potential implications of data preprocessing steps on the inference task. In addition to engaging experimental collaborators early, Lin emphasized the importance of cooperating and building alliances with computer scientists to help develop methods and algorithms that are computationally tractable. Responding to a common mischaracterization of statisticians and their scientific collaborators, several other speakers emphasized that statisticians are scientists too and encouraged more of their colleagues to become experimentalists and disciplinary experts pursuing research in a specific domain as opposed to focusing on statistical methods development in isolation from scientific research. Hero suggested that in order to be viewed as integral contributors to scientific advancements, statisticians could aim to be positive and constructive in interacting with collaborators.
Open Research Questions Can Propel Both the Domain Sciences and the Field
of Statistics Forward
processes and because integrative models typically require tracking and relating multiple processes. Andrew Nobel and Xihong Lin discussed the importance of developing scalable and computationally efficient inference procedures designed for cloud environments, including increasingly widespread cloud computing and data storage. Similarly, several speakers suggested that the use of artificial intelligence and automated statistical analysis packages will become prevalent and that significant opportunity exists to improve statistical practices for many disciplines by ensuring appropriate methods are implemented in such emerging tools. Finally, a few presenters encouraged research into methods that could better define the questions that a given data set could potentially answer based on the contained information.
Opportunities Exist to Strengthen Statistics Education at All Levels
Emery Brown, Robert Kass, Bin Yu, Andrew Nobel, and Cosma Shalizi emphasized that there are opportunities to improve statistics education and that increased understanding of statistics broadly across scientific disciplines could help many researchers avoid known pitfalls that may be exacerbated when working with big data. One suggestion was to teach probability and statistical concepts and reasoning in middle and high school through a longitudinal and reinforcing curriculum, which could provide students with time to develop statistical intuition. Another suggestion was to organize undergraduate curricula around fundamental principles rather than introducing students to a series of statistical tests to match with data. Many pitfalls faced in analysis of large, heterogeneous data sets result from inappropriate application of simplifying assumptions that are used in introductory statistics courses, suggested Shalizi. Thus, while teaching those classes, it would be helpful for educators to clearly articulate the limitations of these assumptions and work to avoid their misapplication in practice. Beyond core statistics-related teaching and curricular improvements, placing greater emphasis on communications training for graduate students could help improve interdisciplinary collaboration between statisticians and domain scientists. Finally, several presenters agreed that the proliferation of complex data and increasing computational demands of statistical inference warrants at least cursory training in efficient computing, coding in languages beyond R,1 and the basics of database curation.
ORGANIZATION OF THIS WORKSHOP PROCEEDINGS
Subsequent chapters of this publication summarize the workshop presentations and discussions largely in chronological order. Chapter 2 provides an overview of the workshop and its underlying goals, Chapter 3 focuses on inference about discoveries based on integration of diverse data sets,
Chapter 4 discusses inference about causal discoveries from large observational data, and Chapter 5
describes inference when regularization methods are used to simplify fitting of high-dimensional models. Each chapter corresponds to a key issue identified in the statement of task in Box 1.1, with the second issue of inference about discoveries from data on large networks being interwoven throughout the other chapters.
__________________
2
Framing the Workshop
The first session of the workshop provided an overview of its content and structure. Constantine Gatsonis (Brown University and chair of the Committee on Applied and Theoretical Statistics [CATS]) introduced the members of CATS, emphasized the interdisciplinary nature of the committee, and mentioned several recently completed and ongoing CATS activities related to big data, including
Frontiers in Massive Data Analysis (NRC, 2013) and Training Students to Extract Value from Big Data: Summary of a Workshop (NRC, 2014). Alfred Hero (University of Michigan and co-chair of the workshop) said the overarching goals of the workshop were to characterize the barriers that prevent one from drawing reliable inferences from big data and to identify significant research opportunities that could propel multiple fields forward.
PERSPECTIVES FROM STAKEHOLDERS
Michelle Dunn, National Institutes of Health Nandini Kannan, National Science Foundation
Chaitan Baru, National Science Foundation
Michelle Dunn and Nandini Kannan delivered a joint presentation describing the shared interests and ongoing work between the National Institutes of Health (NIH) and the National Science Foundation (NSF). Dunn said the two agencies share many interests, particularly across the themes of research, training, and collaboration. She described NIH’s long history of funding both basic and applied research at the intersection of statistics and biomedical science, beginning with biostatistics and more recently focused on biomedical data science. She introduced the Big Data to Knowledge (BD2K) initiative as a trans-NIH program that aims to address limitations to using biomedical big data. Kannan described NSF’s support for foundational research across mathematics, statistics, computer science, and engineering. She noted the broad portfolio of big data research across many scientific fields, including geosciences, social and behavioral sciences, chemistry, biology, and materials science. Since NSF does not typically fund biomedical research, coordination with NIH is important, Kannan said.
science training as well as open educational resources and short courses that improve understanding in the broader research community. Kannan described NSF’s focus on the training and education of the next generation of science, technology, engineering, and mathematics researchers and educators. She listed examples including postdoctoral and graduate research fellowships, which include mathematics and statistics focus areas, as well as research experiences for undergraduates that can bring new students into the field. Kannan also mentioned the Mathematical Sciences Institutes as an existing opportunity to bring together researchers across many areas of mathematical science, as well as other opportunities for week-long through year-long programs.
Dunn described a third general area of shared interest for NIH and NSF as fostering collaboration between basic scientists typically funded by NSF and the biomedical research community funded by NIH. The NIH-NSF innovation lab provides a 1-week immersive experience each year that brings quantitative scientists and biomedical researchers together to develop outside-the-box solutions to challenging problems such as precision medicine (2015) and mobile health (2016).
Dunn and Kannan said they hoped this workshop would help identify open questions related to inference as well as opportunities to move biomedical and other domain sciences forward. Dunn requested that presenters articulate what biomedical data science research could look like in 10 years and describe why and how it might be an improvement from current practices. Kannan agreed, adding that NSF wants to identify foundational questions and challenges, especially those whose solutions may be applied in other domains as well. She also encouraged speakers to help identify a roadmap forward—not just the state of the art and current challenges, but also what the future holds and what resources are required to get there. Kannan mentioned the National Strategic Computing Initiative (NSCI, 2016) and asked participants to think about what challenges could be addressed with sufficient computational resources.
Chaitan Baru remarked on the rapid growth of data science related conferences, workshops, and events nationally. Similarly, he described the increasing frequency of cross-disciplinary interactions among mathematicians, statisticians, and computer scientists. Both trends were valuable for the emerging discipline of data science, which is bringing together approaches from different disciplines in new and meaningful ways.
Baru described the NSF Big Data Research Initiative that cuts across all directorates. This initiative seeks proposals that break traditional disciplinary boundaries, he said. As NSF spans many scientific domains, a critical objective of the program is to develop generalizable principles or tools that are applicable across disciplines. Across research, education, and infrastructure development, NSF seeks to harness the big data revolution and to make it a top-level priority in the future.
Baru described several high-level challenges that NSF and the emerging discipline of data science are tackling. For example, NSF is seeking to create the infrastructure and institutions that will facilitate hosting and sharing large data sets with the research community, thereby reducing barriers to analysis and allowing easier replication of studies. Regarding education, Baru pointed to the proliferation of master’s-level programs but suggested that principles-based undergraduate curricula and doctoral programs are required for data science to become a true discipline. In reference to the White House Computer Science for All program (Smith, 2016), which introduces computing content in high school courses, Baru identified the similar need to introduce data science principles at this level of education.
Michael Daniels, University of Texas, Austin
Michael Daniels presented an overview of, and the motivations for, the scientific content of the workshop. He quoted the 2013 National Research Council report Frontiers in Massive Data Analysis, which stated, “The challenges for massive data go beyond the storage, indexing, and querying that have been the province of classical database systems . . . and, instead, hinge on the ambitious goal of inference. . . . Statistical rigor is necessary to justify the inferential leap from data to knowledge . . . .” (NRC, 2013). Daniels said it is important to use big data appropriately; given the risk of false discoveries and the concern regarding irreproducible research, it is critical to develop an understanding of the uncertainty associated with any inferences or predictions made from big data.
Daniels introduced three major big data themes that would feature prominently across all workshop presentations: (1) bias remains a major obstacle, (2) quantification of uncertainty is essential, and (3) understanding the strength of evidence in terms of reproducibility is critical. He explained that the workshop was designed to explore scientific inference using big data in four specific contexts:
1. Causal discoveries from large observational data: for example, evaluating the causal effect of a specific treatment in a certain population using electronic health records (EHRs) or determining the causal effect of weather on glacial melting using satellite monitoring data;
2. Discoveries from large networks: which are increasingly used in biological and social sciences, among other disciplines, to visualize and better understand interactions in complex systems;
3. Discoveries based on integration of diverse data sets: for example, combining data from subcellular genomics studies, animal studies, a small clinical trial, and longitudinal studies into one inference question despite each data type having distinct errors, biases, and uncertainties; and
4. Inference when regularization is used to simplify fitting of high-dimensional models:
specifically how to assess uncertainty and strength of evidence in models with far more parameters (p) than observations (n).
Regarding inference about causal discoveries, Daniels described the tremendous amount of observational data available but noted that this information could be misleading without careful treatment. He emphasized the difference between confirmatory data analysis to answer a targeted question and exploratory analyses to generate hypotheses. He used the example of comparative effectiveness research based on EHRs to call attention to challenges related to missing data and selection bias, confounding bias, choice of covariates to adjust for these biases, and generalizability. Beyond these general challenges, comparative effectiveness research must evaluate the role of effect modifiers and gain an understanding of pathways through which different interventions are acting. Audience member Roderick Little commented that measurement error for big data can be a significant issue that is distinct from bias and warrants attention from statistical analysts.
over time.
Making inferences based on the integration of diverse data sets poses many of the same challenges —for example, related to missing data and bias in available data—as well as the additional hurdle of integrating data across many different temporal and spatial scales. As an illustrative example, Daniels encouraged participants to think about the challenges and assumptions necessary to estimate the health impacts of air pollution by combining large-scale weather data from satellite images, regional weather stations, localized pollution monitors, and health records.
Analyses of big data often require models with many more parameters (p) than there are observations (n), and a growing number of regularization tools have emerged (e.g., Lockhart et al., 2014; Mukherjee et al., 2015) based on the assumption of sparsity. Daniels explained that the general strategy with these regularization methods is to find the relationships with the greatest magnitude and assume that all others are negligible. While some regularization methods and associated penalties are more helpful than others, there is little formal treatment of uncertainty when these methods are used. This remains an open challenge, according to Daniels. Additionally, many of the current approaches have been developed for relatively simple settings, and it is unclear how these can be modified for more complex systems, particularly when the assumption of sparsity may not be valid. Daniels concluded by stating that because existing statistical tools are in many cases inadequate for supporting inference from big data, this workshop was designed to demonstrate the state of the art today and point to critical research opportunities over the next 10 years.
__________________
3
Inference About Discoveries Based on Integration
of Diverse Data Sets
The first session of the workshop focused on inference about discoveries from integration of diverse data sets. The session highlighted opportunities and challenges for reliably combining different data types, such as genomic and proteomic data, physiological measurements, behavioral observations, and cognitive assessments, in the context of sound statistical modeling. Alfred Hero (University of Michigan) described the possibilities and risks of big data integration using a case study of genetic biomarker discovery for viral infection and presented a method for uncertainty estimation in graphical network models. Andrew Nobel (University of North Carolina, Chapel Hill) discussed the relationship between statistical and data management challenges when working with large, diverse data sets and presented an iterative testing procedure for community detection and differential correlation mining. Genevera Allen (Rice University and Baylor College of Medicine) discussed two large longitudinal medical cohort studies and described a flexible framework for modeling multivariate distributions with exponential families. Last, Jeffrey Morris (MD Anderson Cancer Center) discussed incorporating biological knowledge into statistical model development to reduce the parameter space and increase the biological coherence of results.
DATA INTEGRATION WITH DIVERSE DATA SETS
Alfred Hero III, University of Michigan
size relative to the number of variables—before running the analysis.
Hero described the potential benefits of integrating diverse data sets, including the development of better predictors and better descriptive models. However, realizing these benefits is difficult because assessment of bias and replicability is challenging, especially in high-dimensional cases, and may require more sophisticated methods. Hero described three distinct categories of data integration:
1. Integration of data within a single study, in which the analyst has control over the experimental design and all data collection. In principle, bias can be measured, heterogeneity and variability in the data—for example, from batch effects or sample misregistration—can be controlled for, and uncertainty can be quantified. While there will always be some noise in the data due to biological diversity and temporal progression, these studies are the best-case scenario for analysts, albeit expensive and not always feasible. Examples of this type of integration can be found in Wang et al. (2009), Chen et al. (2012), and Hsiao et al. (2014).
2. Integration of primary data across several studies, in which the analyst has access to primary data but does not control all elements of experimental design. In this context, the bias and uncertainty in the data are at least partially unknown; for example, there may be one type of data collected by different laboratories with different protocols. This requires a different set of tools for analysts to account for these uncontrolled noise errors—for example, as presented by Deng et al. (2009), Morris et al. (2012), and Sripada et al. (2014).
3. Integration of metadata across several studies, in which the analyst does not have access to primary data but instead combines metrics such as mean aggregated effect sizes, computed p-values, or imputed relationships. Examples of this type of post-experimental integration can be found in Singh et al. (2008), Langfelder et al. (2013), and Rau et al. (2014).
Across all of these categories, Hero said there are statistical principles for data integration. Given two data sets X and Y, and assuming a model f(X,Y | θ) that gives joint probability distribution for X
and Y conditioned on the parameter of interest θ, Fisher’s sufficiency principle yields that there is a minimal sufficient statistic T(X,Y) satisfying Fisher-Neyman Factorization following equation 1:
Hero explained that this provides the best possible integration algorithm available and supports any type of inference task, but it requires a model. Furthermore, if the analyst has access to reliable prior information on the variable of interest, the Bayesian posterior distribution induces dimensionality reduction. While these principles provide an optimistic target, Hero reminded the audience that it is challenging to develop such a model and repeated the famous George Box mantra: “all [statistical] models are wrong, but some are useful” (Box, 1979).
constraint on statistical inference are still in their infancy, said Hero (see e.g., Duchi et al., 2014;
Song et al., 2015).
Hero then presented several case studies, the first trying to predict the onset of illness before peak expression of symptoms by looking at various biomarkers over time and identifying the biomarkers that are most useful for predicting the onset of symptoms. Pre- and post-inoculation data describing ribonucleic acid (RNA) expression; protein expression; nasal, breath, and urine cytokines; and self-reported symptoms were collected 3 times daily for 121 subjects over 5 days, resulting in more than 18,000 samples assayed. The collected data have high dimensionality, exhibit large biological and technical variability, and have missing samples. These complexities are typical of big data. Hero presented an overview of select findings from the study, including a novel factor analysis method (Huang et al., 2011; Woods et al., 2013), identification and validation of a biological predictor of viral symptom onset (Zaas et al., 2013), demonstration that use of a personalized baseline reference sample improves predictor performance (Liu et al., 2016), and demonstration that whole blood messenger RNA (mRNA) is the best data type (a “modality”) for predicting illness. This study raised additional questions such as whether additional baseline samples could further improve the accuracy of the predictor and how generalizable findings are to the broader population. These questions are currently being explored in a follow-up study that includes more baseline samples and a collection of additional data modalities, said Hero.
These projects are very challenging in terms of both data management and statistical methods, and Hero briefly introduced several inference-driven data integration techniques developed in this project. The novel factor analysis method used to estimate a small number of explanatory variables as biological predictors for onset of symptoms is easily extendable to many data modalities. The novel aspect of this method, Hero explained, is that the positive sum-to-one constraint in the factor model avoids known problems of masking and interference faced by principal component analysis. The novel factor analysis method was more effective for predicting onset of symptoms than other methods in the literature and was validated with additional data sets (Huang et al., 2011; Bazot et al., 2013).
FIGURE 3.1 Spectral clustering of p-value trajectories classifies pathways having similar patterns of differential expression. SOURCE: Reproduced with permission from Huang (2011).
In the final section of his talk, Hero focused on network inference and how to evaluate the significance and replicability of network edges by controlling for false discoveries. This is challenging in the high-dimensional context of big data when fitting models with many more parameters (p) than samples (n), often denoted as p>>n, as the classical central limit theorem applies only for fixed p as n goes to infinity. Similarly, Hero described analogous approximations used in the mixed high-dimensional setting that allow both p and n to go to infinity (Bühlmann and van de Geer, 2011), which are not useful for small samples. Hero derived a “purely high-dimensional regime,” allowing p to go to infinity with a fixed n (Hero and Rajaratnam, 2011, 2012, 2016), that he used to calculate a critical phase transition threshold (ρc) for sample correlation values (equation 2), below which false discoveries dominate:
DATA INTEGRATION AND ITERATIVE TESTING
Andrew Nobel, University of North Carolina, Chapel Hill
Andrew Nobel began by remarking that the trade-off between computational error and statistical error is more important than ever because of the growing size of data sets. He cautioned that having a lot of data does not necessarily mean one has the right data to answer the analysis question of interest. Often, the obvious statistical techniques, or those deemed appropriate by a disciplinary scientist, are not the ones actually required. For these reasons, in practice most data analysis problems require sustained interaction between statisticians and disciplinary scientists; the process works best if scientists understand some elements of the statistical analysis, and likewise statisticians understand some of the underlying science.
Nobel then presented a taxonomy of data integration, contrasting classical approaches with the challenges of big data. Classical data integration focuses on integrating data from multiple experiments or multiple groups of samples on a common measurement platform, said Nobel. While this is still relevant today, integration techniques increasingly bring together many data types into a common, or at least overlapping, sample group. Nobel presented an example of a data set from The Cancer Genome Atlas (TCGA) consortium, which contains gene expression data (approximately18,000 genes), micro RNA data (650 miRNAs), copy number data (200,000 probes), methylation data (22,000 regions), and gene mutation data (12,000 genes), as well as patient survival or treatment response descriptors for 350 breast cancer tumors. In such large data sets, frequently data are missing and the analyst does not have coverage across all data modalities for all subjects. For example, Nobel described data from the Genotype-Tissue Expression (GTEx) consortium in which genotype single nucleotide polymorphism (SNP) information is available at 5 million genomic locations for each individual, but gene expression data are available only for a subset of tissues that varies from individual to individual.
The potential benefits of integrating data across many measurement platforms are enhanced statistical power and improved prediction, said Nobel, and these can be used to provide new or better insights into complex biological phenomena. However, this comes at the expense of greater challenges in managing, curating, and analyzing data. Before even getting to formal statistical analysis, Nobel explained, many preprocessing decisions are made—for example, normalization, imputation, and removal of appropriate covariates—that must be scrutinized closely. Even seemingly small decisions may have significant impacts on later analyses, and it can take months to fully understand what processing has been or should be performed on the data. This is another reason for stronger and more frequent collaboration between statisticians and disciplinary scientists, Nobel urged. Moving to model selection, he said that integration of diverse data sets often requires modeling assumptions to reduce the dimensionality of the parameter space—such as sparsity assumptions. While it is critically important to check the validity of these assumptions, this is often more difficult than simply checking for normality. Furthermore, many statistical models have free parameters that must be specified by the analyst, and these decisions also have a significant impact on the final analysis.
may not adequately capture heterogeneity among samples.
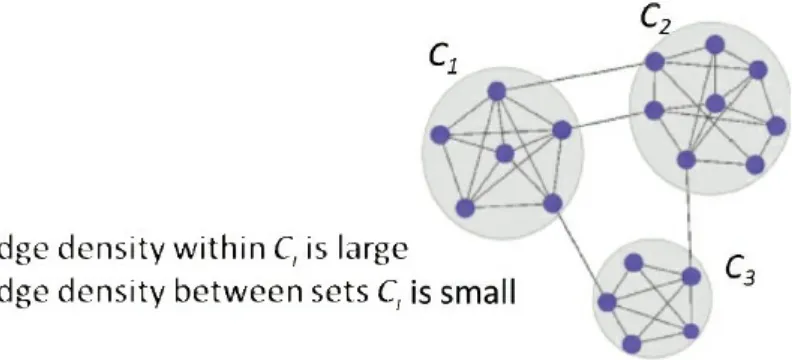
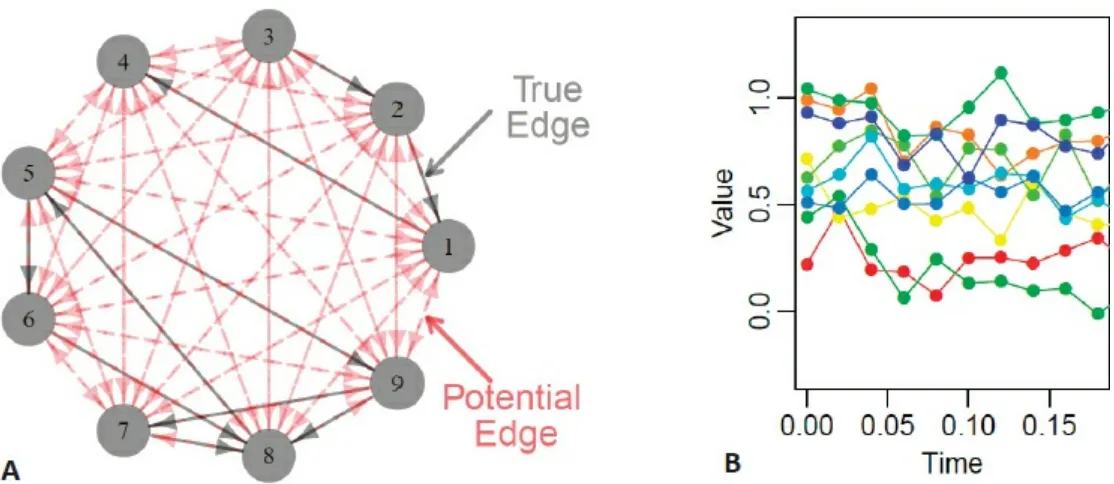
He described an iterative testing method for community detection in large networks, in which a community is a group of nodes that are significantly interconnected but have relatively few connections to nodes outside the community (Figure 3.2). Given a group of nodes that represent a candidate community (Bt), the iterative testing algorithm calculates a p-value for each node in the network relative to the configuration null model, which represents how significantly each node is connected to the community Bt. The nodes are ordered from most to least significantly connected to Bt and those nodes with a p-value above a specified threshold are omitted, following the Benjamini-Hochberg step-up procedure (Benjamini and Hochberg, 1995). This process is repeated with this new community (Bt+1) and repeats until Bt+1 = Bt. This procedure is competitive with other community detection methods in the literature, is relatively insensitive to the selection of the rejection threshold, and does not require partitioning of the network, said Nobel. Running this process with initial node sets derived from vertex neighborhoods can identify meaningful communities in a network. Importantly, nodes not assigned to any community can be assigned to background.
FIGURE 3.2 Community detection in networks identifies sets of nodes that are highly interconnected but have relatively few connections with nodes outside the set. SOURCE: Reproduced with permission from Wilson et al. (2014).
Nobel described a similar procedure to identify variable sets that are differentially correlated in two sample groups, illustrating the method using cancer subtypes from the TCGA data set. Identifying differentially correlated variables is a useful form of exploratory analysis to generate hypotheses worthy of further study, said Nobel. As a second example, he presented results from differential correlation mining of a functional magnetic resonance imaging (fMRI) data set from the Human Connectome Project. Figures from the analysis show that brain voxels exhibiting differential correlation between language and motor tasks exhibit a distinct spatial pattern that corresponds to known regions of neural activity and that differs from a standard analysis of differential activity. This calls attention to the potential advantages of studying higher-order differences to gain additional biological insights.
PANEL DISCUSSION
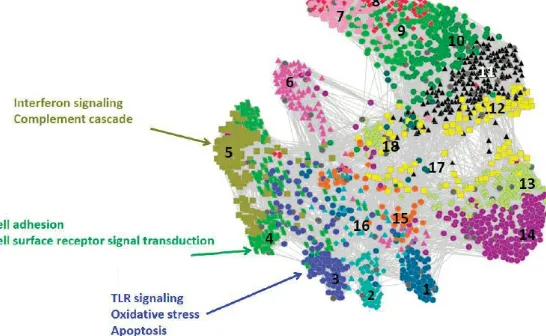
known biological mechanisms as well as how or if findings were replicated in any of the presented studies. Hero responded that many of the gene signatures identified—toll-like receptor pathways, inflammation pathways, and interferon inducible transcription factors—are well known in the literature. But there are also some factors in this signature that are unknown and seem unrelated to the infection, and the current hypothesis is that these genes and proteins are associated with susceptibility factors that are not currently characterized. Further study may provide some mechanistic understanding of their presence, said Hero. Regarding replication, there have been a number of cross-validation efforts within and across multiple studies, as well as in clinical trials. Interestingly, the biomarker is equally effective for predicting onset of other viral infections, and follow-up research may identify a similar marker for bacterial illness or develop a composite biomarker that can help distinguish the two different causes. Nobel added that interpretation of gene pathways is challenging but often the best available explanation, and Hero agreed, saying that a critical limitation is that gene pathway data present a snapshot rather than account for temporal changes in expression.
Another audience member noted that relying on prediction for model validation provides only an aggregate indicator of model suitability and asked Hero if model residuals were used as an alternative approach to validation. Hero agreed that looking at model fit is feasible, but there is limited value with so few subjects and so many parameters; he would be concerned with overfitting of residuals. He suggested that there is a need to develop methods for residual analysis with few samples and many parameters.
An online participant asked if model development, analysis, and results might be impacted by the fact that much of the data was collected years ago and there are likely differences and improvements in data curation and storage practices over time. Nobel answered first, saying that in his experience there is no such thing as a final data set; rather, the data used in analyses are always evolving. Furthermore, reevaluating any decision about a data preprocessing step can substantially change the downstream analysis. Data preprocessing was discussed extensively in the initial stages of the GTEx project: “As a theoretician . . . I never would have imagined how complex [data curation and sharing] is . . . and I don’t know if anyone has the right system,” Nobel said. Hero agreed, adding that improvements have been driven to some extent by top journals and funding agencies that require data sharing. Nonetheless, there is still a long way to go before all data produced from publicly funded research will be available to the public. He noted that large data sets produced by private companies are almost never made public. Hero emphasized that software should be shared more frequently, and Nobel commented that pseudocode is not a substitute.
STATISTICAL DATA INTEGRATION FOR LARGE-SCALE MULTIMODAL
MEDICAL STUDIES
Genevera Allen, Rice University and Baylor College of Medicine
Genevera Allen provided an overview of data integration for large-scale multimodal medical studies. Large-scale medical cohort studies typically have many types of data—including clinical evaluations; EHRs; images; gene and protein expression; and social, behavioral, and environmental information—and the objective of data integration in this context is to combine all of these to better understand complex diseases. Allen defined multimodal data as coming from multiple sources or measurement technologies applied to a common set of subjects. If these data take different forms, including discrete, continuous, and binary, they are called mixed multimodal data and require additional processing to integrate. She suggested that multimodal data integration be thought of as the opposite of classical meta-analysis, in which analysts aggregate across many sets of subjects (n) to conduct inference on variables. Conversely, the focus of data integration is to aggregate multiple sets of variables to conduct inference on the subjects.
Allen described some of the data collected through TCGA, which contains information from more than 11,000 patients and totals nearly 2.5 petabytes of data. Genetic data collected include mutation information, copy number variations, gene and miRNA expression, and methylation data. Individually, each modality provides information on only one component of a complex process, and many of the biological malfunctions in cancer development happen between these types of data. Thus, developing a comprehensive understanding of cancer biology requires integration of these diverse data, said Allen. However, integration of these data is particularly challenging both because they are large and because of the mixed data types with different scales and domains. Allen described some of the objectives for integration of TCGA data: (1) to discover the sets of mutations, gene expression changes, and epigenetic changes that are most associated with, and potentially causative of, tumor cell growth; (2) to identify different cancer subtypes and patient groups that have tumors with similar characteristics; and (3) to discover new, potentially personalized, therapies for treating cancer.
In a second case study, Allen introduced the Religious Orders Study (ROS) and the Rush Memory and Aging Project (MAP), which are longitudinal cohort studies tracking dementia and Alzheimer’s disease in nearly 3,000 patients. Alzheimer’s is a large and growing public health burden, said Allen, and is the only “top-10” cause of death in the United States with no prevention or cure. One key facet of these studies is that patients’ brains were donated at death, allowing for full pathological analysis, in addition to containing baseline data describing patients’ genetics, lifestyle, environment, and behavior, as well as clinical evaluation, results from 19 distinct cognitive tests, and neuroimaging data collected through the duration of the study. At the time of death, more than 60 percent of patients’ brains had symptoms of Alzheimer’s disease but less than half of these patients had been diagnosed with the disease, pointing to a large discrepancy between clinical interpretation of cognition and the pathology. Key goals of data integration in these studies include developing a biological understanding of this discrepancy and identifying additional risk factors to guide development of new treatments. Alzheimer’s disease is complex, and individual data modalities have been studied extensively, said Allen, making integration an important strategy for advancing understanding of the disease.
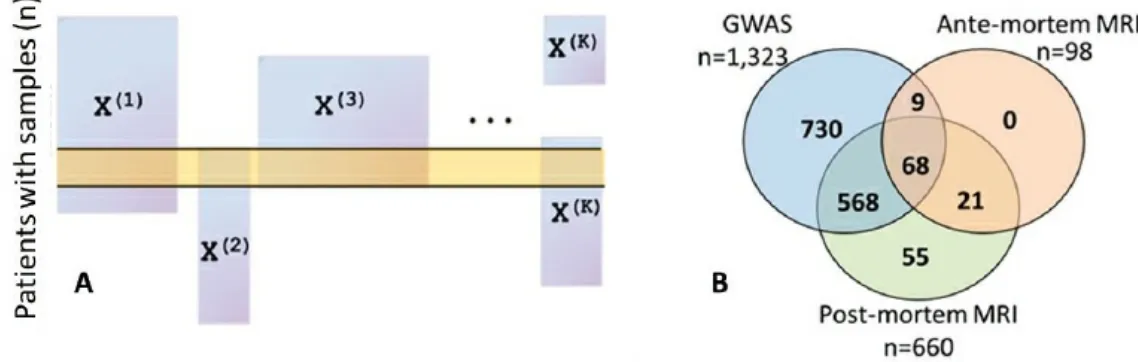
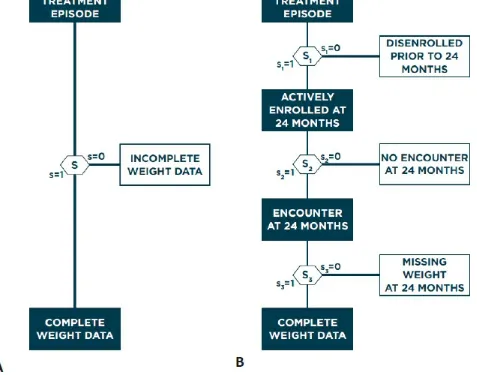
data-related challenges faced regardless of the statistical methods applied. One critical challenge is identifying and correcting for batch effects, which arise from differences in data collection procedures across different laboratories or technologies and are problematic because they can be confounded across data modalities or across time. Allen showed the results of principal component analysis for methylation data and RNA sequencing data from the ROS and MAP studies, which showed clear grouping and batch effects, in one case due to instrument maintenance. Similarly, structural neuroimaging data collected in the ROS and MAP studies before 2012 relied on a 1.5 tesla magnet that was replaced with a 3 tesla magnet to provide greater resolution; how to reconcile these two batches of imaging data remains an open question, said Allen. Another critical challenge is that not all data modalities are measured for every subject, which creates missing or misaligned data and can result in a very limited sample size if the analysis is restricted only to patients for whom complete data are available (Figure 3.3A). This is problematic because these studies begin with small sample sizes relative to the number of variables. Allen showed several Venn diagrams illustrating the small fraction of patients who have multiple data types available: only 68 out of nearly 3,000 patients have genetic information, pre-mortem magnetic resonance imaging (MRI), and postmortem MRI available in the ROS and MAP studies (Figure 3.3B).
FIGURE 3.3 (A) Generic visualization of how making inferences from the integration of multiple data modalities (X(1) through X(K)) can be challenging due to potentially small numbers of patients for whom complete data are available, and (B) illustration with data available from the ROS and MAP studies. SOURCE: Genevera Allen, Rice University and Baylor College of Medicine, “Statistical data integration for large-scale multimodal medical studies,” presentation to the workshop, June 8, 2016.
Moving to methodological challenges faced in analysis of mixed multimodal data sets, Allen said that prediction is a relatively easy task. Although understudied, there are a number of methods that can be applied: (1) black box methods (e.g., random forests), (2) ensemble learning in which a model is fit to each data modality and then combined, and (3) feature learning approaches (e.g., principal component analysis) on each data modality followed by supervised models using the identified features. More challenging are data-driven discoveries that provide new biological knowledge; for instance, the ROS and MAP studies not only aim to predict if a patient will get Alzheimer’s, but also seek to know why, said Allen.
describes network methods for some types of data—for example, the Gaussian network model for continuous valued data and the Ising model for binary valued data—others are less well researched (e.g., count-valued data, bounded random variables), and bringing all of these data types into a common network model is a significant challenge. Allen introduced a framework for graphical models via exponential families, which assumes that all conditional distributions can be described as a distribution from the exponential family (containing many of the most common distributions including the normal, Gaussian, Bernoulli, and Poisson) and takes the general form of the following:
where θ is the canonical parameter, B(X) is the sufficient statistic, C(X) is the base measure, and D(θ) is the log-partition function. Based on this assumption, it follows that the joint multivariate distribution takes the form of the following:
in which the pairwise dependencies between variables s and t are given by the product of their sufficient statistics. This flexible framework accommodates diverse data types, permits a wide range of dependence structures, and allows model fitting with penalized generalized linear models, said Allen. To the best of her knowledge, this is the first multivariate distribution that parameterizes dependencies of mixed data types. According to Allen, one of the main challenges in fitting these models is that each type of data is on a different scale, which requires different levels of regularization, and preliminary work shows that standardization of the different data types is inappropriate and potentially misleading. Furthermore, because of correlation within and between data modalities, there may be confounding interference that obscures weaker signals.
While Allen focused on methods for mixed multimodal data, she called attention to existing work on data integration and dimension reduction for single data types such as joint and individual variation explained (Lock et al., 2013) and integrative clustering (Shen et al., 2009). Developing statistical methods for dimension reduction and clustering within mixed multimodal data sets remains an open problem, said Allen. Referring back to the ROS and MAP studies, she said longitudinal studies with mixed multimodal data also present open statistical problems related to aligning data collected at different times. In the bigger picture, the ROS and MAP studies are two of many ongoing projects looking at aging and cognitive health, which creates the opportunity for meta-analysis across similar integrative studies to increase statistical power, which is an objective of the Accelerating Medicines Partnership–Alzheimer’s Disease project.
DISCUSSION OF STATISTICAL INTEGRATION FOR MEDICAL AND
HEALTH STUDIES
Jeffrey S. Morris, MD Anderson Cancer Center
Jeffrey Morris remarked that the last 10 years have produced a large amount of complex, information-rich data that has transformed biomedical research. For example, research in molecular biology produces genome-wide data through a variety of platforms that provides information on deoxyribonucleic acid (DNA), RNA, protein expression, and epigenetics data on mediating processes such as methylation. Similarly, imaging technologies continue to evolve and currently provide both structural and functional information, said Morris. Given the abundance of data, the critical question is how biological knowledge can be extracted from these large, complex, and heterogeneous data sets. Integrative modeling is one of the key scientific challenges and will be critical for translating information to knowledge, said Morris, who showed an example of five different types of neuroimaging that each contains different types of information. This is particularly challenging when data and measurement platforms describe biological phenomena across several orders of magnitude in spatial and temporal scales, ranging from single neurons to whole brain regions.
Integrative modeling faces numerous challenges—for example, the small sample size for complete data sets—said Morris, referencing the small overlapping area in a Venn diagram in Figure 3.3B. This requires implementing creative ways to best use the information that is available or developing strategies for multiple imputation of missing data. Similarly, batch effects are a serious problem if they are confounded with important factors and are even more challenging with complex, high-dimensional data sets. Morris also mentioned the importance of understanding data preprocessing— echoing the call for analysts to consider preprocessing as part of their statistical inference—as well as the practical challenges of storing, indexing, linking, and sharing large data sets. Morris then introduced the issue of defining a common unit of analysis, as different data observe different objects and phenomena. For example, methylation occurs at individual sites on a gene, which can contain more than 20,000 potential binding sites, so it is not trivial to align observations and elements across different platforms.
Morris summarized three main classes of statistical tasks described in the preceding presentation by Genevera Allen:
1. Building of predictive models that integrate diverse data and allow a larger set of possible predictors to search over, which is difficult with mixed multimodal data sets;
2. Structure learning to empirically estimate interrelationships and exploit correlations to reduce the number of parameters, which can be difficult because although structure can usually be found, not all structures are replicable and meaningful; and
3. Network structure learning and use of graphical models to estimate pairwise associations in the data.
different proteins results in different phenotypes or molecular subtypes and ultimately causes different clinical outcomes, so it would make sense to build a model that has this type of directed flow between data modalities. Similarly, incorporating biological knowledge from the broader literature, such as molecular pathway information, can inform model development. Additionally, focusing on biologically relevant information—for example, excluding methylation sites that are known not to affect gene expression—can simplify complex data sets.
For the remainder of his presentation, Morris described a case study evaluating subtypes of colorectal cancer that demonstrates incorporation of biological knowledge into integrative modeling. As motivation, he presented a continuum of precision medicine ranging from traditional practices in which all patients are given the same treatment regardless of personal variability to personalized care in which each patient is given a specifically designed treatment. A reasonable middle ground to aim for is identifying and treating cancer subtypes that share many biological characteristics, said Morris. To develop consensus regarding molecular subtypes of colorectal cancer, Morris and colleagues participated in an international consortium led by SAGE Biosystems that combined information from 18 different studies with mRNA data from approximately 4,000 patients. Their analysis yielded four distinct communities, representing different colorectal cancer subtypes, each characterized by different biological characteristics. The subtypes identified are consistently identified and replicable, in part because the data set is large and diverse, said Morris, and he believes it represents true biological differences. Unfortunately, mRNA data are not clinically actionable and require an understanding of the upstream effectors. TCGA data on colorectal cancer and MD Anderson internal data are now being combined with the goal of characterizing the biology of each colorectal cancer subtype to explore questions such as the following: Which subtype has the worst prognosis and is a priority for aggressive treatment? Do different subtypes respond differentially to a specific treatment? Are there subtype-specific targets that can be used to guide development of new treatments? Morris suggested that integrative modeling is critical to answering these questions.
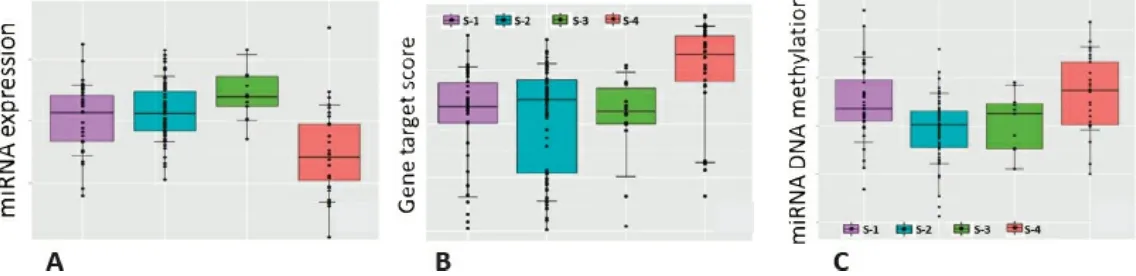
Providing one example, Morris showed boxplots of miRNA expression indicating that the particular miRNA was expressed less in one subtype than in the other subtypes. As miRNA affects expression of numerous other genes, gene set enrichment was used to show that downstream genes that would normally be inhibited by the miRNA were overexpressed in this subtype, and similarly the DNA coding for the miRNA itself is more methylated in this subtype. Putting this information together indicates that methylation inactivates this miRNA, which in turn results in greater downstream expression of genes that are a known hallmark of metastatic cancer (Figure 3.4). Morris described a strategy for relating methylation and mRNA data, which is challenging because methylation is measured at thousands of sites per gene, that involves restricting the analysis to sites for which methylation is correlated with mRNA expression and constructing a gene-level methylation score. In turn, this allowed estimation of the percent of gene expression that is explained by methylation to obtain a list of genes whose expression is strongly modulated by methylation.
pathways associated with that feature, and relate these pathways to the upstream genetic and epigenetic processes that dictate gene expression. Integrating multimodal data and known biology reduces the number of potentially relevant parameters, which makes modeling more efficient, and incorporating known biological information yields biologically coherent results that are more likely to be reproducible, said Morris. However, he cautioned that not everything in the literature is true, so incorporating biological knowledge may introduce additional bias. Furthermore, it requires detailed understanding of the underlying biology, and Morris concluded with an appeal for close collaboration between disciplinary scientists and statistical analysts.
FIGURE 3.4 Combining data from (A) micro RNA expression, (B) gene set enrichment, and (C) gene-level methylation with known biological information allowed researchers to infer that methylation drives differential gene expression in one colorectal cancer subtype. S-1 through S-4 correspond to the different cancer subtypes. SOURCE: Jeffrey Morris, MD Anderson Cancer Center, “Statistical integration for medical/health studies,” presentation to the workshop, June 8, 2016.
PANEL DISCUSSION
Genevera Allen and Jeffrey Morris participated in a panel discussion following their individual presentations. A participant remarked on the growing popularity of graphical models, such as the Ising and Gaussian used by Allen, but asked why Bayesian networks were not mentioned despite their ability to integrate mixed multimodal data and additional advantageous properties. Morris answered first, saying that graphical models can be fit using either a Bayesian or frequentist approach. He agreed that Bayesian networks have many advantages but pointed out that they may be more computationally demanding. Allen responded that a lot of good work has been done using Bayesian networks to integrate mixed multimodal data, and the framework she presented using exponential families to represent a multivariate distribution could be applied with Bayesian networks and priors. Many Bayesian approaches model dependencies between mixed data types in the latent hierarchical structure of the model; this avoids challenges related to scaling of data across modalities but is often more difficult to interpret. There are benefits and drawbacks to both approaches, and data should be analyzed with many different methods, concluded Allen.