Kretschmer Complex Degree Centrality and
Confidence Interval Estimation Implementation for
Validating User Reports on Integrated Disaster Portal
and Social Media Application
Dodi Wisaksono Sudiharto
1Johanes Haposan Napitupulu
2School of Computing Telkom University Bandung, Indonesia [email protected]
Tata Soemitra Wirasasmita
3 Center of Research and Expertise in StatisticsUniversitas Padjadjaran Bandung, Indonesia [email protected]
Abstract — Reporting a disaster is important for managing disasters. It is related to how a response is made to face an incident. However, a time which is consumed by a process of report validating can be too long if a conventional way is used. The problem which is related to a disaster reporting happens when a required time which is needed by a fire department to make a response cannot be fulfilled. To solve this problem, the authors design an integrated application between a social media application and a disaster management application to fulfill that requirement. An alternative tool is used like inputs which are came from a social media community, such as a Twitter. Two methods are used to find parameters such as a threshold value and minimal inputs for disaster reporting. The first method is Confidence Interval Estimation which is used to find minimal inputs for disaster reporting. The second method is Kretschmer Complex Degree Centrality which is used to find a threshold value for user report validation. On this research, the authors is going to perform an input validation from users in a required time which is needed by fire department to respond. The goal is to prove that inputs which are come from a social media community can be used as an alternative disaster reporting and can fulfill a required time which is needed by the fire department to respond.
Keywords — disaster reporting, incident response, input validation
I. INTRODUCTION
A. Background
A good disaster reporting can assist a fire department to carry out its duty optimally. In this research, a quality reporting is assessed by its time and its detail as parameters. In 2013, there were 131 fire disaster reports [1]. There were more than 50 false reports for each day, and there were some reports which were not clear either to describe the disaster location or a level of urgency [1]. All those cases are happened in Bandung.
In this paper, the authors design a disaster portal application which integrates with a social media application (Twitter). The disaster portal application is going to implement a threshold to check a validity of user by using Kretschmer Complex Degree Centrality. Confidence Interval Estimation is also implemented to calculate minimum inputs which are needed by the application. All those methods are used to process inputs from users to give better result of disaster reports.
II. BASICTHEORY
A. The Current Disaster Management System
The current system uses a line phone as a media to report a disaster. Problems that can exist are:
o Many reports are not derived from victims, but from community that lives near the place of happened disaster [1].
o There are approximately 50 false reports for each day which are received by fire department [1].
o In some cases, a line phone is busy. This condition can be happened because several causes, including:
At the time of fire reporting, there is a false reporting which comes. A real reporting is idle because it must wait until a line phone is released [1].
At one time, there are large quantity reports, such as more than 5 reports received simultaneously [1].
B A
B. Response Time
There is a response time which must be fulfilled by a fire department. The department must execute a response in 15 minutes after it receives a report which describes about a fire disaster, if the location of a fire disaster is approximately 7.5 km from the location of a fire department. The amount of time to decide what action should be done by a fire department, must be taken no longer than 5 minutes [1].
C. Kretschmer Complex Degree Centrality
Complex Degree Centrality method uses PPI (Probabilistic Partnership Index) which is used as a tool to measure relations between nodes in a network [11]. However, in this case, Complex Degree Centrality is used to create a threshold which is used by a disaster portal application.
Calculating Kretschmer Degree Centrality involves the calculation of weighted relation (weighted ties). Degree Centrality Calculation is divided into four parts, namely the Entropy Node (H), Degree Centrality (DC), Complex Degree centrality (CDC), and Complex Group Degree Centrality (CGDC) [11][14].
In this research, the calculation is used at node level. Complex Group Degree Centrality is a calculation at graph level, so that CGDC calculation is unused and not to be analysed in this paper [11].
1) Entropy Calculation (H)
Entropy is the value of a node probability as a bridge in the flow of information for other nodes. Higher entropy value means the node has a higher ability to obtain information and passes them to other nodes.
In a series of values of
K
i(i
1
,
2
,
3
,
...,
z),
which0
i
K
zi i
i
i
K
K
h
1
/
(2.1)then the calculation of an entropy
H
(
K
i)
is [7]:
zi i i
i
h
log
h
K
H
1
.
2)
(
(2.2)
with the requisite is:
if
0
1
z
i
K
i then2
0
) (Ki
H(2.3)
2) Degree Centrality Calculation (DC)
Degree Centrality Calculation is the calculation of a relation for A, with
K
ivalue equal to the pair value between Anode and B node [11]:
i AB
i
U
K
(2.4)so that the value of the Degree Centrality for A node is:
) (
2
H Ki ADC
(2.5)3) Complex Degree Centrality Calculation (CDC) Complex Degree Centrality can be calculated as follow [11]:
2 / 1
)
(
A AA
DC
TR
CDC
(2.6)which
TR
A is total weights of the relation of A.D. Confidence Interval Estimation
This method is used to process more than one data inputs and represent them to an output in a simple form. The data samples are collected and calculated to get its average. They are commonly taken from a random sample.
Suppose there are data samples as student heights. The average of height is 163 cm. This value is called as an appraiser point. In most cases, people may feel less confident with this appraiser point, then an interval is used. Interval Estimation aims to estimate a boundary price between two prices. For example, an average estimation of student heights are between 155 cm and 170 cm, and so on [13].
The general Confidence Interval Estimation formula is [6]:
)
(
A
B
P
(2.7)In this case, the formula is developed become as:
n
s
t
x
n
s
t
x
p.
p.
(2.8)which the value of
S
are going to be normalized first before it is used. Several steps that can be used to normalize are [12]:1.
Disposing an extreme value which makes distribution ofdata samples is not normal.
2. Performing a transformation for all data. So that, the differences of all data values are not too high
Explanations of the formula symbols are:
x
= mean of all data.s
= standard deviation.p
t
= value of T-Student distribution (using ordo = (n-1)).n
= all amount of data.E. Probabilistic Form
Probabilistic form is used to estimate data validity. Based on Bayes Theorem, the probabilistic form represents a relationship between data which can be a true positive, or true negative, or false positive, or false negative. The standard of a formula to represent this relationship is [5]:
) (
) (
) (
positive positive
negative positive
negative positive
False True
False False
True True
P
(2.9)
In this paper, the formula of data validity is going to be represented as:
) (
) (
) (
I V
I I V V
P false false
(2.10)
which:
P
= probabilistic of a data validityV
= user amount who are valid and each of them gives a correct input.false
V
= user amount who are valid and each of them gives an incorrect input.I
= user amount who are invalid and each of them gives a correct input.false
I
= user amount who are invalid and each of them gives an incorrect input.III. DESIGN
A. The Propose System
Disaster reporting are usually done by local residents. Victims usually concern about how to safe themselves and their properties. The social media which is used by local residents can be applied as an alternative channel for collecting data of disaster reporting, moreover, if the phone line condition is busy. Based on that facts, a disaster reporting by using an internet social media can be a good alternative choice to be proposed [2][8][9].
B. Steps to Find an Optimal Complex Degree Centrality Value as a Threshold
The disaster portal application uses inputs from Twitter users. Twitter uses a role that users have to have followers more than one third of all users who make interactions to them if they want to be stated as valid users or verified users [10]. The disaster portal application uses an Optimal Complex Degree Centrality Value as a Threshold to verify users. If their Complex Degree Centrality values are higher than the value of a threshold, then the users are stated as valid users.
The first step to find the threshold is by using Kretschmer Complex Degree Centrality formula. The calculation of
Complex Degree Centrality needs data which are weighted first before they are calculated. In this case, interaction weights are used as follow [3][11]:
Following : +2 Mention : +1.5 Reply : +1
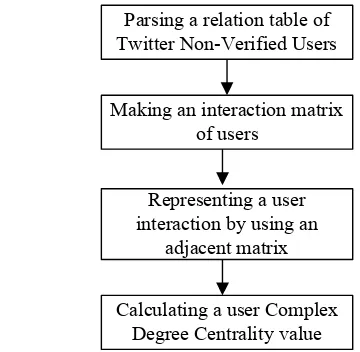
After the interaction weights are set, then the value of the Complex Degree Centrality is found by following steps like a figure below [11]:
Parsing a relation table of Twitter Non-Verified Users
Making an interaction matrix of users
Representing a user interaction by using an
adjacent matrix
Calculating a user Complex Degree Centrality value
Fig. 1. The steps of finding a Complex Degree Centrality value.
In this case, values from 20 to 26 as values of Complex Degree Centrality are used. The first value is got by calculating Complex Degree Centrality of a user who has followed interactions to five people. The second value is similar with the first, but the user has followed interactions to thirty people. Five people are the least number of followed interactions which is permitted by Twitter to someone who wants to make a Twitter account [4].
By using Bayes Theorem, several scenarios which use 50 data samples to 10 data samples are used. Those data samples are used to find the best optimal value of Complex Degree Centrality (from 20 to 26) which is used as a threshold on a disaster portal application.
The steps that can be followed to find a threshold value are:
1. Capturing data samples which are Twitter Non-Verified Users.
2. All those users are suggested to tap a point as a disaster location which is happened on a map of a disaster portal application.
3. All those user accounts are calculated to find their Complex Degree Centrality values. Thus, all those values are classified to find valid users (
V
andV
false)and invalid users (
I
andI
false).4. Finding a value of data validity probabilistic of the users (
P
)6. Choosing the best average value from several means of data validity probabilistics.
7. Choosing the value of Complex Degree Centrality which has the best average value of data validity probabilistic. That Complex Degree Centrality value is used as a threshold on a disaster portal application for that scenario.
C. Steps to Find The Disaster Report Application Minimal Inputs.
Confidence Interval Estimation method is used to find minimal inputs which are needed for disaster reporting. The process of finding minimal inputs is by tapping random points from all map points which are set in normal distribution form.
The steps which can be followed to find an optimal input amount are:
1. Several points are tapped on an application map. The point is assumed as a location of disaster which is happened
2. Finding a mean value and a standard deviation value from all those points
3. Generating random points are set
4. Finding a percentage of successful points which is resulted from an excel. The points are succeed if they are set at inside of the box which is created by a disaster portal application using Confidence Interval Estimation method.
5. Choosing a minimal percentage of successful points. The minimal points which have that percentage are minimal inputs for disaster reporting.
D. Steps to Test The Disaster Report Application.
By using all parameters which are created before (an Optimal Degree Centrality value as a threshold value and minimal inputs), then a test for a disaster portal application is executed. several users are suggested to tap a point on a map which is created by an application. That point is assumed as a disaster location which is happened. The times are set until 30 minutes for everyone to tap an application map.
The database table is used to record that activity. The headers of the table which are used are:
1. tn means a time which is counted per minute until 30
minutes.
2. Validity of User Complex Degree Centrality means if Complex Degree Centrality of the user is higher than a threshold, then a record on that column is going to be set by 1, other by 0.
3. Validity of Minimal User Amount means if the amount of the users is lower than the minimal inputs which are permitted by an application, then a record on that column is going to be set by 0, other by 1.
4. Report Amount per Minute means an amount of the users who give reports about happened disaster per minute.
5. Total of Report Amount means total amounts of users which give reports about happened disaster.
IV. ANALYSIS
A. Finding an Optimal Complex Degree Centrality Value as a Threshold
Finding an optimal value of Complex Degree Centrality can be done by using several scenarios. The range of data samples are used in the scenarios. They are from 50 data samples to 10 data samples. The data samples are divided into: 50 data samples, 45 data samples, 40 data samples, 35 data samples, 30 data samples, 25 data samples, 20 data samples, 15 data samples, and 10 data samples. So there are 9 scenarios. All scenarios are repeated until three times. For example, there is the value of Complex Degree Centrality 26 (CDC 26) which uses 50 data samples. The compositions are 29 valid users and also 21 invalid users. However, there are 2 persons who are valid users, choose wrong locations on an application map, and there are 9 persons who are valid users, choose wrong locations on an application map. By calculating data validity probabilistic in three times, an average value of data validity probabilistics is 37/50.
TABLE I. THE AVERAGE DATA VALIDITY PROBABILISTIC.
CDC Examination 1
Examination 2
Examination 3
Average 26 (29-2)39/50 (29-2)35/50 (29-3)37/50 37/50
24,5 (33-4)42/50 (33-3)39/50 (33-4)40/50 40.33/50
23 (38-6)44/50 (38-4)40/50 (38-4)39/50 41/50
21,5 (44-6)41/50 (44-7)41/50 (44-7)38/50 40/50 20 (48-10)39/50 (48-8)40/50 (48-8)41/50 40/50
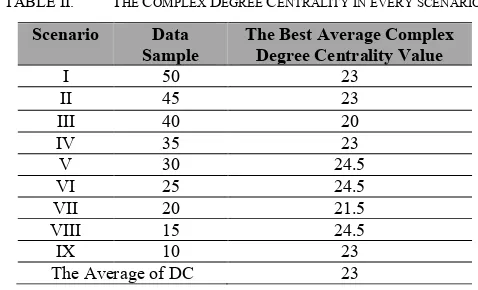
Based on Table II, the best average value of data validity probabilistic is 41/50 which is owned by CDC 23. So, we can assume that the best CDC value for scenario which uses 50 data samples is 23.
TABLE II. THE COMPLEX DEGREE CENTRALITY IN EVERY SCENARIO.
Scenario Data Sample
The Best Average Complex Degree Centrality Value
I 50 23
II 45 23
III 40 20
IV 35 23
V 30 24.5
VI 25 24.5
VII 20 21.5
VIII 15 24.5
IX 10 23
The Average of DC 23
Then, by calculating the average of all the best CDC values, that is 23. That value is used as a threshold by an application to analyse a valid user account.
B. Finding The Disaster Report Application Minimal Inputs.
close to 70%. Therefore, it can be understood that the disaster reporting is urgent to be responded.
The first scenario uses 3 data inputs to generate an area of latitude and longitude on an application map. The second scenario uses 10 data inputs. The last scenario uses 30 data inputs.
1) Finding Minimal Inputs for Disaster Reporting by Using 3 Data Inputs.
There are 3 points which are tapped on an application map as data inputs. They can be followed on a table below:
TABLE III. THREE DATA INPUTS FOR THE FIRST SCENARIO.
Latitude Longitude
-6.97583 107.630169 -6.97678 107.629867 -6.97644 107.631240
Calculation is done by using Confidence Interval Estimation, and the results are:
standard deviation of latitude: 0.000480179. standard deviation of longitude: 0.0007215. mean of latitude: -6.97635.
mean of longitude: 107.630425. T-student distribution: 1.885618083. interval estimation:
o lower bound of latitude: -6.97687. o upper bound of latitude: -6.97582758. o lower bound of longitude: 107.6296399. o upper bound of longitude: 107.6312108.
Then, 100 random points are generated by an excel formula to find a percentage of successful points which are set at inside of the red box area. If the point is set at inside means the point is valid, other is invalid. The results can be seen on a table below:
TABLE IV. THE VALIDITY OF RANDOM POINTS FOR THE FIRST SCENARIO.
Validity Number of points
Valid 57
Invalid 43
Based on information from Table IV, there are 57 points which are at inside of interval estimation area after 100 random points are generated on an application map by using an excel. It means the successful probability of 3 data inputs as minimal inputs is 57%.
2) Finding Minimal Inputs for Disaster Reporting by Using 10 Data Inputs.
By using 10 points as data inputs, after 100 random points are generated by an excel formula to find a percentage of
successful points which are set at inside of the red box area, there are results which can be seen on a table below:
TABLE V. THE VALIDITY OF RANDOM POINTS FOR THE SECOND SCENARIO.
Validity Number of points
Valid 68
Invalid 32
Based on information from Table V, the successful probability of 10 data inputs as minimal inputs is 68%.
3) Finding Minimal Inputs for Disaster Reporting by Using 30 Data Inputs.
By using 30 points as data inputs which are tapped on an application map, after generating 100 random points by an excel formula after that, the results can be seen on a table below:
TABLE VI. THE VALIDITY OF RANDOM POINTS FOR THE THIRD SCENARIO.
Validity Number of points
Valid 83
Invalid 17
Based on information from Table VI, the successful probability of 30 data inputs as minimal inputs is 83%.
Based on the three scenarios, it can be seen that if data samples are increased, then the successful probability increases. If we want to find a successful probability which is higher than 50%, and close to 70%, then the scenario which uses 10 data samples can be chosen. It means that 10 data inputs can be a minimal amount of inputs which are permitted by a disaster portal application.
C. Disaster Report Application Testing.
Activities of several users are recorded when they tap a point on an application map. The recording is set until 30 minutes for everyone. Parameter which is used as a threshold is 23, and parameter which is used as minimum inputs is 10.
TABLE VII. THE RESULT OF APPLICATION TESTING FOR A USER INPUT.
tn (in
minute)
Validity of User Complex
Degree Centrality
Validity of Minimal
User Amount
Report Amount per Minute
Total of Report Amount
1 0 0 0 0
2 0 0 0 0
3 1 0 1 1
4 0 0 0 1
5 1 0 1 2
6 1 0 2 4
7 0 0 0 4
tn (in
minute)
Validity of User Complex
Degree Centrality
Validity of Minimal
User Amount
Report Amount per Minute
Total of Report Amount
9 0 0 0 4
10 1 0 1 5
11 1 0 3 8
12 0 0 0 8
13 0 0 0 8
14 0 0 1 9
15 0 0 0 9
16 0 0 0 9
17 1 1 3 11
18 1 1 1 12
19 0 1 1 13
20 0 1 0 13
21 0 1 0 13
22 1 1 1 14
23 1 1 1 15
24 1 1 2 17
25 0 1 0 17
26 0 1 0 17
27 1 1 1 18
28 0 1 1 19
29 0 1 0 19
30 0 1 0 19
Based on Table VII, validity of minimal user which give disaster reports has a true value in 17 minutes. However, validity of Complex Degree Centrality has a true value in 3 minutes.
V. CONCLUSION
Disaster reporting by using a conventional tool such as a telephone line has a problem when it is going to be validated. The validation which is often used by the fire department staf is based on total of report amount. This condition makes the fire department cannot fulfill the required time to respond if the reports are too little. It means that it is easy to process a report validation if the amount of users which are send reports to the Fire Department are big enough, like more than 30 users. However, the Fire Department cannot wait incoming reports too long.
The authors use inputs which come from a social media community as an alternative disaster reporting. The first method uses Confidence Interval Estimation. By using it, the minimal data inputs which can be used are 10 inputs. It is based on the successful probability which is assumed still can
be accepted. The successful probability is around 70 %. However, 10 users inputs give a valid report in 17 minutes. It still cannot fulfill the required time which is needed by the Fire Department to respond in less than 5 minutes.
By using Kretschmer Degree Centrality, the calculation of weighted relation (weighted ties) in a network of social media can be represented. This method can validate the disaster reporting by creating a threshold value. A valid report can be admitted faster than the first method. It can give a valid report in 3 minutes. So that, validating a disaster reporting can fulfill a required time for the Fire Department in Bandung to decide an action for disaster responding.
REFERENCES [1] A. Hartono. Personal Interview. 7July 2014.
[2] A. Bruns. "Towards distributed citizen participation: Lessons from WikiLeaks and the Queensland Floods." Journal of e-Democracy and Open Government 4.2 (2012): 142-159.
[3] A. Sulasikin. “Analisis Degree Centrality dalam Social Network Analysis Menggunakan Probabilistic Affinity Index (PAI) pada Graf Berarah-Berbobot." Theses. Telkom Institute of Technology, Bandung. 2012. Print.
[4] Brendan. Twitter: How Many People Should You Follow?. 5 July 2012. Web. 10 Feb. 2015. < http://socialfiremedia.com/twitter-how-many-should-you-follow/>
[5] D. G. Fryback. "Bayes' theorem and conditional non independence of data in medical diagnosis." Computers and Biomedical Research 11.5 (1978): 423-434.
[6] D. W. Hosmer and S. Lemeshow. "Confidence interval estimation of interaction." Epidemiology 3.5 (1992): 452-456.
[7] H. Kretschmer and T. Kretschmer. "A new centrality measure for social network analysis applicable to bibliometric and webometric data."
Collnet Journal of Scientometrics and Information Management 1.1 (2007): 1-7.
[8] J. Miller and A. Hogg. “Internet VS. Telephone Data Collection: Does
Method Matter.” Third Brigade. 2.4. 2000. 10 Feb. 2015. <http://www.burke.com/Library/WhitePapers/B.WhitePaperVol2-2000-Iss4.pdf>.
[9] J. Camarero and C. A. Iglesias. "Disasters2. 0: application of web 2.0 technologies in emergency situations." International Journal of Emergency Management 6.3 (2009): 261-279.
[10] K. Makice. Twitter API: Up and running: Learn how to build applications with the Twitter API. " O'Reilly Media, Inc.", 2009. [11] N. Sharafina. "Implementasi Probabilistic Partnership Index (PPI) pada
Analisis Jejaring Sosial dengan Pendekatan Kretschmen." Theses. Telkom Institute of Technology, Bandung. 2012. Print.
[12] S. Hurst. "The characteristic function of the Student t distribution."
Research report: statistics research report/Centre for mathematics and its applications (Canberra) (1995).
[13] Sudjana. Metode Statistika. Bandung: Tarsito Bandung, 1996.