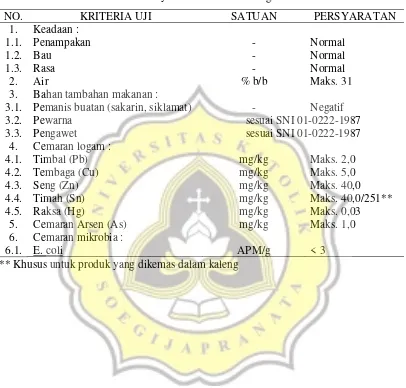
Standar Nasional Indonesia (SNI 01-3710-1995)
Tabel Syarat Mutu Buah Kering
NO. KRITERIA
UJI
SATUAN
PERSYARATAN
1. Keadaan
:
1.1. Penampakan
-
Normal
1.2. Bau
-
Normal
1.3. Rasa
-
Normal
2.
Air
% b/b
Maks. 31
3.
Bahan tambahan makanan :
3.1. Pemanis buatan (sakarin, siklamat)
-
Negatif
3.2. Pewarna
sesuai SNI 01-0222-1987
3.3. Pengawet
sesuai SNI 01-0222-1987
4. Cemaran
logam
:
4.1. Timbal (Pb)
mg/kg
Maks. 2,0
4.2. Tembaga (Cu)
mg/kg
Maks. 5,0
4.3. Seng (Zn)
mg/kg
Maks. 40,0
4.4. Timah (Sn)
mg/kg
Maks. 40,0/251**
4.5. Raksa (Hg)
mg/kg
Maks. 0,03
5.
Cemaran Arsen (As)
mg/kg
Maks. 1,0
6. Cemaran
mikrobia
:
6.1. E.
coli APM/g
<
3
LAMPIRAN 2
LEMBAR KUISIONER
Dihadapan saudara terdapat 12 jenis manisan nanas. Saudara diminta memberi penilaian
berdasarkan tingkat kesukaan saudara dengan range nilai yang telah tersedia. Atas kerja
sama saudara, saya ucapkan terima kasih.
Kriteria
235 248 255 305 332 375
Warna
Aroma
Rasa
Tekstur
Overall
Kriteria
418 422 455 536 542 599
Warna
Aroma
Rasa
Tekstur
Overall
Range Nilai :
1 : Tidak Suka
2 : Agak Suka
3 : Suka
4 : Sangat Suka
5 : Sangat Suka Sekali
Nonlinear Regression Analysis
[DataSet1] H:\laju pengeringan\laju 0 jam 1cm.sav
Iteration Historyb
21999.411 1.000 -.010 18214.956 75.063 -3.142 18214.956 75.063 -3.142 6.0E+020 68.343 1.231 18166.411 71.499 -2.907 18166.411 71.499 -2.907 18020.748 69.050 -2.029 18020.748 69.050 -2.029 6272.050 69.007 -.192 6272.050 69.007 -.192 188962.55 64.739 .096 4688.099 69.803 -.160 4688.099 69.803 -.160 2022.195 71.571 -.112 2022.195 71.571 -.112 663.288 73.858 -.048 663.288 73.858 -.048 348.708 76.496 -.067 348.708 76.496 -.067 348.012 76.049 -.067 348.012 76.049 -.067 348.012 76.051 -.067 348.012 76.051 -.067 348.012 76.051 -.067 Iteration Numbera
1.0 1.1 2.0 2.1 2.2 3.0 3.1 4.0 4.1 5.0 5.1 5.2 6.0 6.1 7.0 7.1 8.0 8.1 9.0 9.1 10.0 10.1 11.0 11.1
Residual Sum of
Squares a b
Parameter
Derivatives are calculated numerically.
Major iteration number is displayed to the left of the decimal, and minor iteration number is to the right of the decimal.
a.
Run stopped after 24 model evaluations and 11 derivative evaluations because the relative reduction between successive residual sums of squares is at most SSCON = 1.00E-008. b.
Parameter Estimates
76.051 5.194 63.768 88.334
-.067 .010 -.091 -.042
Parameter a b
Estimate Std. Error Lower Bound Upper Bound 95% Confidence Interval
Correlations of Parameter Estimates
1.000 -.725 -.725 1.000 a
b
a b
ANOVAa
22440.535 2 11220.267
348.012 7 49.716
22788.547 9
2914.126 8
Source Regression Residual Uncorrected Total Corrected Total
Sum of Squares df
Mean Squares
Dependent variable: y
Nonlinear Regression Analysis
[DataSet2] H:\laju pengeringan\laju 0jam, 2cm.sav
Iteration History b
30218.395 1.000 -.010
25236.307 83.422 -3.082
25236.307 83.422 -3.082
6.2E+019 77.811 .921
25189.113 80.090 -2.804
25189.113 80.090 -2.804
25003.387 78.382 -1.989
25003.387 78.382 -1.989
15828.937 78.531 -.330
15828.937 78.531 -.330
3.5E+011 66.273 .450
12908.356 79.010 -.254
12908.356 79.010 -.254
6708.188 80.130 -.153
6708.188 80.130 -.153
417.588 82.951 -.058
417.588 82.951 -.058
387.460 86.106 -.064
387.460 86.106 -.064
387.241 85.868 -.064
387.241 85.868 -.064
387.239 85.893 -.064
387.239 85.893 -.064
387.239 85.891 -.064
387.239 85.891 -.064
387.239 85.891 -.064
Iteration Number a 1.0
1.1 2.0 2.1 2.2 3.0 3.1 4.0 4.1 5.0 5.1 5.2 6.0 6.1 7.0 7.1 8.0 8.1 9.0 9.1 10.0 10.1 11.0 11.1 12.0 12.1
Residual Sum of
Squares a b
Parameter
Derivatives are calculated numerically.
Major iteration number is displayed to the left of the decimal, and minor iteration number is to the right of the decimal.
a.
Run stopped after 26 model evaluations and 12 derivative evaluations because the relative reduction between successive residual sums of squares is at most SSCON = 1.00E-008. b.
Parameter Estimates
85.891 4.616 75.449 96.333 -.064 .007 -.080 -.048 Parameter
a b
Estimate Std. Error Lower Bound Upper Bound 95% Confidence Interval
Correlations of Parameter Estimates
1.000 -.719 -.719 1.000 a
b
a b
ANOVAa
30823.496 2 15411.748
387.239 9 43.027
31210.735 11
4912.315 10
Source Regression Residual Uncorrected Total Corrected Total
Sum of Squares df
Mean Squares
Dependent variable: y
[DataSet3] H:\laju pengeringan\laju 0jam, 3cm.sav
Iteration Historyb
30108.558 1.000 -.010 24689.086 84.901 -3.269 24689.086 84.901 -3.269 2.3E+022 80.225 1.187 24651.099 81.792 -2.938 24651.099 81.792 -2.938 24467.274 80.599 -2.034 24467.274 80.599 -2.034 9873.742 80.869 -.211 9873.742 80.869 -.211 1468035.7 73.078 .136 7596.282 81.623 -.175 7596.282 81.623 -.175 3512.680 83.287 -.121 3512.680 83.287 -.121 426.590 86.134 -.055 426.590 86.134 -.055 286.370 87.343 -.065 286.370 87.343 -.065 286.228 87.101 -.065 286.228 87.101 -.065 286.228 87.106 -.065 286.228 87.106 -.065 286.228 87.105 -.065 Iteration Numbera
1.0 1.1 2.0 2.1 2.2 3.0 3.1 4.0 4.1 5.0 5.1 5.2 6.0 6.1 7.0 7.1 8.0 8.1 9.0 9.1 10.0 10.1 11.0 11.1
Residual Sum of
Squares a b Parameter
Derivatives are calculated numerically.
Major iteration number is displayed to the left of the decimal, and minor iteration number is to the right of the decimal.
a.
Run stopped after 24 model evaluations and 11 derivative evaluations because the relative reduction between successive residual sums of squares is at most SSCON = 1.00E-008. b.
Parameter Estimates
87.105 4.296 77.199 97.012
-.065 .007 -.081 -.049
Parameter a b
Estimate Std. Error Lower Bound Upper Bound 95% Confidence Interval
Correlations of Parameter Estimates
1.000 -.723 -.723 1.000 a
b
a b
ANOVAa
30784.433 2 15392.217
286.228 8 35.778
31070.661 10
4185.399 9
Source Regression Residual Uncorrected Total Corrected Total
Sum of Squares df
Mean Squares
Dependent variable: y
Nonlinear Regression Analysis
[DataSet6] H:\laju pengeringan\laju 12jam, 1cm.sav
Iteration History b
22517.282 1.000 -.010 18837.272 68.489 -2.142 18837.272 68.489 -2.142 1.6E+022 67.658 1.067 18728.859 68.242 -1.821 18728.859 68.242 -1.821 18110.538 68.239 -1.178 18110.538 68.239 -1.178 1287072.8 68.765 .120 17842.382 68.315 -1.048 17842.382 68.315 -1.048 16942.253 68.474 -.778 16942.253 68.474 -.778 9713.219 68.756 -.240 9713.219 68.756 -.240 487.999 70.114 -.069 487.999 70.114 -.069 163.911 69.178 -.049 163.911 69.178 -.049 152.503 69.993 -.053 152.503 69.993 -.053 152.484 69.911 -.052 152.484 69.911 -.052 152.484 69.916 -.053 152.484 69.916 -.053 152.484 69.915 -.053 Iteration Number a
1.0 1.1 2.0 2.1 2.2 3.0 3.1 4.0 4.1 4.2 5.0 5.1 6.0 6.1 7.0 7.1 8.0 8.1 9.0 9.1 10.0 10.1 11.0 11.1 12.0 12.1
Residual Sum of
Squares a b
Parameter
Derivatives are calculated numerically.
Major iteration number is displayed to the left of the decimal, and minor iteration number is to the right of the decimal.
a.
Run stopped after 26 model evaluations and 12 derivative evaluations because the relative reduction between successive residual sums of squares is at most SSCON = 1.00E-008. b.
Parameter Estimates
69.915 2.805 63.571 76.260
-.053 .005 -.063 -.042
Parameter a b
Estimate Std. Error Lower Bound Upper Bound 95% Confidence Interval
Correlations of Parameter Estimates
1.000
-.740
-.740
1.000
a
b
a
b
ANOVA
a23242.993
2
11621.497
152.484
9
16.943
23395.478
11
2547.655
10
Source
Regression
Residual
Uncorrected Total
Corrected Total
Sum of
Squares
df
Mean
Squares
Dependent variable: y
[DataSet7] H:\laju pengeringan\laju 12jam, 2cm.sav
Iteration Historyb
27390.169 1.000 -.010 23633.375 70.557 -1.806 23633.375 70.557 -1.806 2.5E+026 69.317 1.189 23424.862 70.322 -1.506 23424.862 70.322 -1.506 22272.367 70.311 -.906 22272.367 70.311 -.906
8.3E+010 70.686 .372
21774.259 70.383 -.786 21774.259 70.383 -.786 20092.883 70.523 -.546 20092.883 70.523 -.546 13738.928 70.883 -.241 13738.928 70.883 -.241 1878.123 72.074 -.075 1878.123 72.074 -.075 547.042 68.676 -.030 547.042 68.676 -.030 201.718 71.545 -.043 201.718 71.545 -.043 201.078 71.371 -.043 201.078 71.371 -.043 201.078 71.361 -.043 201.078 71.361 -.043 201.078 71.362 -.043 201.078 71.362 -.043 201.078 71.362 -.043 Iteration Number a
1.0 1.1 2.0 2.1 2.2 3.0 3.1 4.0 4.1 4.2 5.0 5.1 6.0 6.1 7.0 7.1 8.0 8.1 9.0 9.1 10.0 10.1 11.0 11.1 12.0 12.1 13.0 13.1
Residual Sum of
Squares a b
Parameter
Derivatives are calculated numerically.
Major iteration number is displayed to the left of the decimal, and minor iteration number is to the right of the decimal.
a.
Run stopped after 28 model evaluations and 13 derivative evaluations because the relative reduction between successive residual sums of squares is at most SSCON = 1.00E-008. b.
Parameter Estimates
71.362 2.903 64.892 77.831 -.043 .004 -.052 -.033 Parameter
a b
Estimate Std. Error Lower Bound Upper Bound 95% Confidence Interval
Correlations of Parameter Estimates
1.000 -.754 -.754 1.000 a
b
a b
ANOVAa
28200.384 2 14100.192 201.078 10 20.108 28401.461 12
2585.426 11 Source
Regression Residual Uncorrected Total Corrected Total
Sum of Squares df
Mean Squares
Dependent variable: y
Nonlinear Regression Analysis
[DataSet8] H:\laju pengeringan\laju 12jam, 3cm.sav
Iteration Historyb
18940.619 1.000 -.010 14858.121 66.950 -2.529 14858.121 66.950 -2.529 6.2E+018 69.296 .966 14795.346 68.007 -2.179 14795.346 68.007 -2.179 14398.363 68.827 -1.450 14398.363 68.827 -1.450 26282.495 69.701 .022 14216.542 68.940 -1.302 14216.542 68.940 -1.302 13615.169 69.149 -1.006 13615.169 69.149 -1.006 9466.244 69.520 -.397 9466.244 69.520 -.397 4848.430 70.747 -.018 4848.430 70.747 -.018 359.286 67.906 -.051 359.286 67.906 -.051 139.274 70.456 -.067 139.274 70.456 -.067 137.307 70.870 -.069 137.307 70.870 -.069 137.305 70.889 -.069 137.305 70.889 -.069 137.305 70.889 -.069 Iteration Numbera
1.0 1.1 2.0 2.1 2.2 3.0 3.1 4.0 4.1 4.2 5.0 5.1 6.0 6.1 7.0 7.1 8.0 8.1 9.0 9.1 10.0 10.1 11.0 11.1 12.0 12.1
Residual Sum of
Squares a b
Parameter
Derivatives are calculated numerically.
Major iteration number is displayed to the left of the decimal, and minor iteration number is to the right of the decimal.
a.
Run stopped after 26 model evaluations and 12 derivative evaluations because the relative reduction between successive residual sums of squares is at most SSCON = 1.00E-008. b.
Parameter Estimates
70.889 3.006 63.958 77.820
-.069 .006 -.083 -.055
Parameter a b
Estimate Std. Error Lower Bound Upper Bound 95% Confidence Interval
Correlations of Parameter Estimates
1.000 -.716 -.716 1.000 a
b
a b
ANOVAa
19567.388 2 9783.694
137.305 8 17.163
19704.693 10
2647.793 9
Source Regression Residual Uncorrected Total Corrected Total
Sum of Squares df
Mean Squares
Dependent variable: y
[DataSet10] H:\laju pengeringan\laju 24jam, 1cm.sav
Iteration Historyb
18159,483 1,000 -,010 14525,418 68,882 -2,854 14525,418 68,882 -2,854 1.9E+023 66,113 1,614 14478,387 67,357 -2,407 14478,387 67,357 -2,407 14066,601 66,771 -1,436 14066,601 66,771 -1,436 9.8E+009 67,148 ,516 13828,828 66,829 -1,240 13828,828 66,829 -1,240 12871,193 66,956 -,844 12871,193 66,956 -,844 5124,926 67,251 -,212 5124,926 67,251 -,212 212,731 69,335 -,072 212,731 69,335 -,072 161,364 69,482 -,063 161,364 69,482 -,063 160,903 69,733 -,064 160,903 69,733 -,064 160,901 69,707 -,064 160,901 69,707 -,064 160,901 69,709 -,064 160,901 69,709 -,064 160,901 69,708 -,064 Iteration Numbera
1.0 1.1 2.0 2.1 2.2 3.0 3.1 4.0 4.1 4.2 5.0 5.1 6.0 6.1 7.0 7.1 8.0 8.1 9.0 9.1 10.0 10.1 11.0 11.1 12.0 12.1
Residual Sum of
Squares a b
Parameter
Derivatives are calculated numerically.
Major iteration number is displayed to the left of the decimal, and minor iteration number is to the right of the decimal.
a.
Run stopped after 26 model evaluations and 12 derivative evaluations because the relative reduction between successive residual sums of squares is at most SSCON = 1,00E-008. b.
Parameter Estimates
69,708 3,888 60,195 79,222 -,064 ,009 -,087 -,042 Parameter
a b
Estimate Std. Error Lower Bound Upper Bound 95% Confidence Interval
Correlations of Parameter Estimates
1,000 -,734 -,734 1,000 a
b
a b
ANOVAa
18692,337 2 9346,169 160,901 6 26,817 18853,238 8
1728,711 7 Source
Regression Residual Uncorrected Total Corrected Total
Sum of Squares df
Mean Squares
Dependent variable: y
Nonlinear Regression Analysis
[DataSet11] H:\laju pengeringan\laju 24jam, 2cm.sav
Iteration Historyb
21940,283 1,000 -,010 17971,826 70,313 -2,487 17971,826 70,313 -2,487 4.2E+018 69,535 ,859 17911,439 69,966 -2,152 17911,439 69,966 -2,152 17557,407 69,919 -1,480 17557,407 69,919 -1,480 3537,602 70,461 -,134 3537,602 70,461 -,134 6817,080 67,479 -,008 268,994 72,679 -,072 268,994 72,679 -,072 137,437 72,670 -,061 137,437 72,670 -,061 135,582 73,038 -,062 135,582 73,038 -,062 135,579 73,006 -,062 135,579 73,006 -,062 135,579 73,008 -,062 135,579 73,008 -,062 135,579 73,008 -,062 Iteration Numbera
1.0 1.1 2.0 2.1 2.2 3.0 3.1 4.0 4.1 5.0 5.1 5.2 6.0 6.1 7.0 7.1 8.0 8.1 9.0 9.1 10.0 10.1
Residual Sum of
Squares a b
Parameter
Derivatives are calculated numerically.
Major iteration number is displayed to the left of the decimal, and minor iteration number is to the right of the decimal.
a.
Run stopped after 22 model evaluations and 10 derivative evaluations because the relative reduction between successive residual sums of squares is at most SSCON = 1,00E-008. b.
Parameter Estimates
73,008 2,719 66,856 79,159 -,062 ,005 -,073 -,051 Parameter
a b
Estimate Std. Error Lower Bound Upper Bound 95% Confidence Interval
Correlations of Parameter Estimates
1,000 -,722 -,722 1,000 a
b
a b
ANOVA
a22658,421
2
11329,210
135,579
9
15,064
22794,000
11
3213,199
10
Source
Regression
Residual
Uncorrected Total
Corrected Total
Sum of
Squares
df
Mean
Squares
Dependent variable: y
[DataSet12] H:\laju pengeringan\laju 24jam, 3cm.sav
Iteration Historyb
21804,135 1,000 -,010 17643,715 68,295 -2,267 17643,715 68,295 -2,267 3.0E+017 70,521 ,719 17559,017 69,151 -1,968 17559,017 69,151 -1,968 17106,457 69,975 -1,354 17106,457 69,975 -1,354 2305,325 70,968 -,115 2305,325 70,968 -,115 1249,181 70,037 -,036 1249,181 70,037 -,036 67,900 71,595 -,057 67,900 71,595 -,057 41,756 72,601 -,062 41,756 72,601 -,062 41,732 72,639 -,063 41,732 72,639 -,063 41,732 72,639 -,063 Iteration Numbera
1.0 1.1 2.0 2.1 2.2 3.0 3.1 4.0 4.1 5.0 5.1 6.0 6.1 7.0 7.1 8.0 8.1 9.0 9.1
Residual Sum of
Squares a b Parameter
Derivatives are calculated numerically.
Major iteration number is displayed to the left of the decimal, and minor iteration number is to the right of the decimal.
a.
Run stopped after 19 model evaluations and 9 derivative evaluations because the relative reduction between successive residual sums of squares is at most SSCON = 1,00E-008. b.
Parameter Estimates
72,639 1,411 69,495 75,783 -,063 ,002 -,068 -,057 Parameter
a b
Estimate Std. Error Lower Bound Upper Bound 95% Confidence Interval
Correlations of Parameter Estimates
1,000
-,715
-,715
1,000
a
b
a
b
ANOVAa
22639,633 2 11319,817 41,732 10 4,173 22681,365 12
3474,965 11 Source
Regression Residual Uncorrected Total Corrected Total
Sum of Squares df
Mean Squares
Dependent variable: y
Nonlinear Regression Analysis
[DataSet1] C:\DONNA\laju pengeringan\laju 72jam,1cm.sav
Iteration History
b13851,852
1,000
-,010
10441,379
62,956
-2,997
10441,379
62,956
-2,997
3.7E+017
63,287
1,148
10418,001
63,169
-2,582
10418,001
63,169
-2,582
10239,904
63,352
-1,751
10239,904
63,352
-1,751
134,224
63,819
-,089
134,224
63,819
-,089
71,283
64,974
-,078
71,283
64,974
-,078
70,901
65,120
-,079
70,901
65,120
-,079
70,901
65,109
-,079
70,901
65,109
-,079
70,901
65,110
-,079
Iteration Number
a1.0
1.1
2.0
2.1
2.2
3.0
3.1
4.0
4.1
5.0
5.1
6.0
6.1
7.0
7.1
8.0
8.1
Residual
Sum of
Squares
a
b
Parameter
Derivatives are calculated numerically.
Major iteration number is displayed to the left of
the decimal, and minor iteration number is to the
right of the decimal.
a.
Run stopped after 17 model evaluations and 8
derivative evaluations because the relative
reduction between successive residual sums of
squares is at most SSCON = 1,00E-008.
b.
Parameter Estimates
65,110 2,654 58,616 71,603 -,079 ,007 -,097 -,061 Parameter
a b
Estimate Std. Error Lower Bound Upper Bound 95% Confidence Interval
Correlations of Parameter Estimates
1,000 -,711 -,711 1,000 a
b
a b
ANOVA
a14378,822
2
7189,411
70,901
6
11,817
14449,723
8
1755,902
7
Source
Regression
Residual
Uncorrected Total
Corrected Total
Sum of
Squares
df
Mean
Squares
Dependent variable: y
[DataSet14] H:\laju pengeringan\laju 72jam, 2cm.sav
Iteration Historyb
17742,542 1,000 -,010 14103,251 68,250 -2,837 14103,251 68,250 -2,837 9.7E+022 66,030 1,591 14057,577 67,052 -2,395 14057,577 67,052 -2,395 13667,118 66,615 -1,460 13667,118 66,615 -1,460 6.4E+008 67,008 ,417 13450,272 66,673 -1,272 13450,272 66,673 -1,272 12613,195 66,798 -,892 12613,195 66,798 -,892 4954,956 67,063 -,215 4954,956 67,063 -,215 211,225 69,109 -,078 211,225 69,109 -,078 101,569 68,990 -,063 101,569 68,990 -,063 100,033 69,360 -,065 100,033 69,360 -,065 100,029 69,324 -,065 100,029 69,324 -,065 100,029 69,326 -,065 100,029 69,326 -,065 100,029 69,326 -,065 Iteration Numbera
1.0 1.1 2.0 2.1 2.2 3.0 3.1 4.0 4.1 4.2 5.0 5.1 6.0 6.1 7.0 7.1 8.0 8.1 9.0 9.1 10.0 10.1 11.0 11.1 12.0 12.1
Residual Sum of
Squares a b
Parameter
Derivatives are calculated numerically.
Major iteration number is displayed to the left of the decimal, and minor iteration number is to the right of the decimal.
a.
Run stopped after 26 model evaluations and 12 derivative evaluations because the relative reduction between successive residual sums of squares is at most SSCON = 1,00E-008. b.
Parameter Estimates
69,326 3,071 61,811 76,841
-,065 ,007 -,083 -,047
Parameter a b
Estimate Std. Error Lower Bound Upper Bound 95% Confidence Interval
Correlations of Parameter Estimates
1,000 -,733 -,733 1,000 a
b
a b
ANOVAa
18328,971 2 9164,485
100,029 6 16,672
18429,000 8
1660,701 7
Source Regression Residual Uncorrected Total Corrected Total
Sum of Squares df
Mean Squares
Dependent variable: y
Nonlinear Regression Analysis
[DataSet3] C:\DONNA\laju pengeringan\laju 72jam, 3cm.sav
Iteration Historyb
20903,052 1,000 -,010 17331,811 70,433 -2,581 17331,811 70,433 -2,581 7.8E+023 66,655 1,457 17266,959 68,838 -2,217 17266,959 68,838 -2,217 16840,652 67,912 -1,409 16840,652 67,912 -1,409 9390421.1 68,101 ,223 16628,817 67,950 -1,246 16628,817 67,950 -1,246 15867,910 68,047 -,915 15867,910 68,047 -,915 8471,377 68,262 -,253 8471,377 68,262 -,253 557,920 69,855 -,077 557,920 69,855 -,077 191,954 70,377 -,053 191,954 70,377 -,053 176,436 71,346 -,058 176,436 71,346 -,058 176,395 71,214 -,058 176,395 71,214 -,058 176,394 71,223 -,058 176,394 71,223 -,058 176,394 71,222 -,058 176,394 71,222 -,058 176,394 71,223 -,058 Iteration Number a
1.0 1.1 2.0 2.1 2.2 3.0 3.1 4.0 4.1 4.2 5.0 5.1 6.0 6.1 7.0 7.1 8.0 8.1 9.0 9.1 10.0 10.1 11.0 11.1 12.0 12.1 13.0 13.1
Residual Sum of
Squares a b
Parameter
Derivatives are calculated numerically.
Major iteration number is displayed to the left of the decimal, and minor iteration number is to the right of the decimal.
a.
Run stopped after 28 model evaluations and 13 derivative evaluations because the relative reduction between successive residual sums of squares is at most SSCON = 1,00E-008. b.
Parameter Estimates
71,223 3,623 62,654 79,791
-,058 ,007 -,075 -,040
Parameter a b
Estimate Std. Error Lower Bound Upper Bound 95% Confidence Interval
Correlations of Parameter Estimates
1,000 -,740 -,740 1,000 a
b
a b
ANOVAa
21509,035 2 10754,517 176,394 7 25,199 21685,429 9
2035,931 8 Source
Regression Residual Uncorrected Total Corrected Total
Sum of Squares df
Mean Squares
Dependent variable: y
Uji Normalitas Manisan Nanas Kering
Tests of Normality
,173 9 ,200* ,949 9 ,677 ,166 9 ,200* ,964 9 ,843 ,196 9 ,200* ,902 9 ,263 ,149 9 ,200* ,960 9 ,803 ,208 9 ,200* ,878 9 ,151 ,209 9 ,200* ,853 9 ,081 ,175 9 ,200* ,911 9 ,320 ,212 9 ,200* ,884 9 ,174 ,300 9 ,019 ,846 9 ,067 ,259 9 ,083 ,845 9 ,065 ,222 9 ,200* ,838 9 ,055 ,191 9 ,200* ,917 9 ,365 ,147 9 ,200* ,983 9 ,979 ,152 9 ,200* ,948 9 ,664 ,179 9 ,200* ,926 9 ,441 ,150 9 ,200* ,937 9 ,549 ,188 9 ,200* ,895 9 ,224 ,184 9 ,200* ,895 9 ,224 ,227 9 ,199 ,905 9 ,285 ,223 9 ,200* ,910 9 ,318 ,275 9 ,049 ,837 9 ,054 ,184 9 ,200* ,901 9 ,260 ,182 9 ,200* ,898 9 ,238 ,190 9 ,200* ,894 9 ,218 Perendaman
0 jam 12 jam 24 jam 72 jam 0 jam 12 jam 24 jam 72 jam 0 jam 12 jam 24 jam 72 jam 0 jam 12 jam 24 jam 72 jam 0 jam 12 jam 24 jam 72 jam 0 jam 12 jam 24 jam 72 jam Kadar_Air
Kadar_Abu
Vitamin_C
Kadar_Sukrosa
Hardness
Chewiness
Statistic df Sig. Statistic df Sig. Kolmogorov-Smirnova Shapiro-Wilk
This is a lower bound of the true significance. *.
Lilliefors Significance Correction a.
Tests of Normality
,144 12 ,200* ,971 12 ,925 ,248 12 ,041 ,885 12 ,102 ,119 12 ,200* ,962 12 ,815 ,219 12 ,115 ,881 12 ,090 ,232 12 ,075 ,837 12 ,025 ,239 12 ,057 ,825 12 ,018 ,233 12 ,072 ,887 12 ,109 ,201 12 ,193 ,905 12 ,181 ,221 12 ,109 ,901 12 ,164 ,112 12 ,200* ,983 12 ,992 ,144 12 ,200* ,969 12 ,897 ,176 12 ,200* ,945 12 ,562 ,245 12 ,045 ,881 12 ,090 ,187 12 ,200* ,939 12 ,484 ,236 12 ,063 ,805 12 ,011 ,242 12 ,051 ,723 12 ,001 ,186 12 ,200* ,892 12 ,126 ,208 12 ,159 ,873 12 ,071 Ketebalan
1 cm 2 cm 3 cm 1 cm 2 cm 3 cm 1 cm 2 cm 3 cm 1 cm 2 cm 3 cm 1 cm 2 cm 3 cm 1 cm 2 cm 3 cm Kadar_Air
Kadar_Abu
Vitamin_C
Kadar_Sukrosa
Hardness
Chewiness
Statistic df Sig. Statistic df Sig. Kolmogorov-Smirnova Shapiro-Wilk
This is a lower bound of the true significance. *.
LAMPIRAN 5
Uji Diskriptif Two Way
* Kadar Air Manisan Nanas Kering
Descriptive Statistics
Dependent Variable: Kadar_Air
19.4767 .37608 3 19.9533 .44298 3 20.1933 .38175 3 19.8744 .46974 9 20.1467 .44298 3 20.1967 .87460 3 20.2933 1.01894 3 20.2122 .70994 9 20.2400 .68242 3 20.4833 .90473 3 20.7300 1.02825 3 20.4844 .79398 9 20.6300 .38743 3 20.7733 .14503 3 20.9200 .44000 3 20.7744 .32704 9 20.1233 .60106 12 20.3517 .65609 12 20.5342 .73571 12 20.3364 .66932 36 Ketebalan
1 cm 2 cm 3 cm Total 1 cm 2 cm 3 cm Total 1 cm 2 cm 3 cm Total 1 cm 2 cm 3 cm Total 1 cm 2 cm 3 cm Total Perendaman 0 jam
12 jam
24 jam
72 jam
Total
Mean Std. Deviation N
* Kadar Abu Manisan Nanas Kering
Descriptive Statistics
Dependent Variable: Kadar_Abu
5.5000 .20000 3 4.7667 .41633 3 3.2000 .17321 3 4.4889 1.04695 9 3.4000 .10000 3 1.7667 .28868 3 .9333 .11547 3 2.0333 1.09886 9 2.8667 .11547 3 2.4000 .17321 3 1.7000 .10000 3 2.3222 .52148 9 1.8000 .10000 3 1.2000 .17321 3 1.2667 .05774 3 1.4222 .30322 9 3.3917 1.41129 12 2.5333 1.43801 12 1.7750 .91067 12 2.5667 1.40895 36 Ketebalan
1 cm 2 cm 3 cm Total 1 cm 2 cm 3 cm Total 1 cm 2 cm 3 cm Total 1 cm 2 cm 3 cm Total 1 cm 2 cm 3 cm Total Perendaman 0 jam
12 jam
24 jam
72 jam
Total
Descriptive Statistics
Dependent Variable: Vitamin_C
22.9567 1.01614 3 21.7833 2.03227 3 24.4233 .50807 3 23.0544 1.63321 9 17.6700 1.02191 3 17.6700 1.02191 3 21.1967 1.01614 3 18.8456 1.97221 9 15.9067 1.01614 3 18.2600 1.02191 3 16.4933 1.01614 3 16.8867 1.37941 9 14.1467 1.01614 3 15.9067 1.01614 3 17.6700 1.02191 3 15.9078 1.76209 9 17.6700 3.55093 12 18.4050 2.50727 12 19.9458 3.34216 12 18.6736 3.22090 36 Ketebalan
1 cm 2 cm 3 cm Total 1 cm 2 cm 3 cm Total 1 cm 2 cm 3 cm Total 1 cm 2 cm 3 cm Total 1 cm 2 cm 3 cm Total Perendaman 0 jam
12 jam
24 jam
72 jam
Total
Mean Std. Deviation N
* Kadar Sukrosa Manisan Nanas Kering
Descriptive Statistics
Dependent Variable: Kadar_Sukrosa
79.7867 19.12820 3 68.4900 8.52741 3 44.2133 14.66490 3 64.1633 20.27856 9 98.3667 22.02644 3 93.9500 24.34611 3 90.6533 6.77809 3 94.3233 17.09368 9 89.3567 10.30756 3 67.1933 21.34690 3 75.1767 13.35552 3 77.2422 16.72061 9 85.6933 11.64546 3 56.4200 21.71946 3 43.6433 7.72118 3 61.9189 22.69997 9 88.3008 15.75669 12 71.5133 22.28493 12 63.4217 23.19411 12 74.4119 22.66307 36 Ketebalan
1 cm 2 cm 3 cm Total 1 cm 2 cm 3 cm Total 1 cm 2 cm 3 cm Total 1 cm 2 cm 3 cm Total 1 cm 2 cm 3 cm Total Perendaman 0 jam
12 jam
24 jam
72 jam
Total
*
Hardness
Manisan Nanas Kering
Descriptive Statistics
Dependent Variable: Hardness
3.8708 1.96574 3 9.0035 2.68193 3 9.5499 2.87233 3 7.4747 3.49123 9 1.2043 .93636 3 4.0036 2.08254 3 4.2510 .50785 3 3.1530 1.87495 9 2.7789 2.43510 3 4.8486 1.35807 3 3.8974 1.46955 3 3.8416 1.81339 9 1.7175 .41976 3 4.5121 2.07393 3 3.4062 1.03795 3 3.2119 1.69538 9 2.3929 1.76584 12 5.5920 2.74675 12 5.2761 2.97918 12 4.4203 2.87606 36 Ketebalan
1 cm 2 cm 3 cm Total 1 cm 2 cm 3 cm Total 1 cm 2 cm 3 cm Total 1 cm 2 cm 3 cm Total 1 cm 2 cm 3 cm Total Perendaman 0 jam
12 jam
24 jam
72 jam
Total
Mean Std. Deviation N
*
Chewiness
Manisan Nanas Kering
Descriptive Statistics
Dependent Variable: Chewiness
.9213
.46163
3
1.9107
2.00819
3
2.3183
1.17230
3
1.7168
1.33869
9
.3234
.54201
3
.3037
.39084
3
.7143
.40126
3
.4471
.43832
9
1.5182
1.86891
3
1.4887
1.25500
3
.7415
.88941
3
1.2494
1.26888
9
.2283
.14703
3
1.5308
.72642
3
.7753
.66789
3
.8448
.75477
9
.7478
1.01191
12
1.3085
1.24094
12
1.1373
1.00585
12
1.0645
1.08645
36
Ketebalan
1 cm
2 cm
3 cm
Total
1 cm
2 cm
3 cm
Total
1 cm
2 cm
3 cm
Total
1 cm
2 cm
3 cm
Total
1 cm
2 cm
3 cm
Total
Perendaman
0 jam
12 jam
24 jam
72 jam
Total
LAMPIRAN 6
Uji Post Hoc Two Way Anova :
* Kadar Air Manisan Nanas Kering
Kadar_Air
Duncan
a,b9
19.8744
9
20.2122
20.2122
9
20.4844
20.4844
9
20.7744
.074
.098
Perendaman
0 jam
12 jam
24 jam
72 jam
Sig.
N
1
2
Subset
Means for groups in homogeneous subsets are displayed.
Based on Type III Sum of Squares
The error term is Mean Square(Error) = .432.
Uses Harmonic Mean Sample Size = 9.000.
a.
Alpha = .05.
b.
Kadar_Air
Duncan
a,b12
20.1233
12
20.3517
12
20.5342
.160
Ketebalan
1 cm
2 cm
3 cm
Sig.
N
1
Subset
Means for groups in homogeneous subsets are displayed.
Based on Type III Sum of Squares
The error term is Mean Square(Error) = .432.
Uses Harmonic Mean Sample Size = 12.000.
a.
Alpha = .05.
b.
Kadar_Abu
Duncan
a,b9
1.4222
9
2.0333
9
2.3222
9
4.4889
1.000
1.000
1.000
1.000
Perendaman
72 jam
12 jam
24 jam
0 jam
Sig.
N
1
2
3
4
Subset
Means for groups in homogeneous subsets are displayed.
Based on Type III Sum of Squares
The error term is Mean Square(Error) = .037.
Uses Harmonic Mean Sample Size = 9.000.
a.
Alpha = .05.
b.
* Kadar Vitamin C Manisan Nanas Kering
Vitamin_C
Duncan
a,b9
15.9078
9
16.8867
9
18.8456
9
23.0544
.073
1.000
1.000
Perendaman
72 jam
24 jam
12 jam
0 jam
Sig.
N
1
2
3
Subset
Means for groups in homogeneous subsets are displayed.
Based on Type III Sum of Squares
The error term is Mean Square(Error) = 1.230.
Uses Harmonic Mean Sample Size = 9.000.
a.
Alpha = .05.
b.
Vitamin_C
Duncan
a,b12
17.6700
12
18.4050
12
19.9458
.118
1.000
Ketebalan
1 cm
2 cm
3 cm
Sig.
N
1
2
Subset
Means for groups in homogeneous subsets are displayed.
Based on Type III Sum of Squares
The error term is Mean Square(Error) = 1.230.
Uses Harmonic Mean Sample Size = 12.000.
a.
Alpha = .05.
b.
Duncan
a,b9
61.9189
9
64.1633
9
77.2422
9
94.3233
.070
1.000
Perendaman
72 jam
0 jam
24 jam
12 jam
Sig.
N
1
2
Subset
Means for groups in homogeneous subsets are displayed.
Based on Type III Sum of Squares
The error term is Mean Square(Error) = 265.398.
Uses Harmonic Mean Sample Size = 9.000.
a.
Alpha = .05.
b.
Kadar_Sukrosa
Duncan
a,b12
63.4217
12
71.5133
12
88.3008
.236
1.000
Ketebalan
3 cm
2 cm
1 cm
Sig.
N
1
2
Subset
Means for groups in homogeneous subsets are displayed.
Based on Type III Sum of Squares
The error term is Mean Square(Error) = 265.398.
Uses Harmonic Mean Sample Size = 12.000.
a.
Alpha = .05.
b.
*
Hardness
Manisan Nanas Kering
Hardness
Duncan
a,b9
3.1530
9
3.2119
9
3.8416
9
7.4747
.460
1.000
Perendaman
12 jam
72 jam
24 jam
0 jam
Sig.
N
1
2
Subset
Means for groups in homogeneous subsets are displayed.
Based on Type III Sum of Squares
The error term is Mean Square(Error) = 3.356.
Uses Harmonic Mean Sample Size = 9.000.
a.
Hardness
Duncan
a,b12
2.3929
12
5.2761
12
5.5920
1.000
.677
Ketebalan
1 cm
3 cm
2 cm
Sig.
N
1
2
Subset
Means for groups in homogeneous subsets are displayed.
Based on Type III Sum of Squares
The error term is Mean Square(Error) = 3.356.
Uses Harmonic Mean Sample Size = 12.000.
a.
Alpha = .05.
b.
•
Chewiness
Manisan Nanas Kering
Chewiness
Duncan
a,b9
.4471
9
.8448
.8448
9
1.2494
1.2494
9
1.7168
.136
.106
Perendaman
12 jam
72 jam
24 jam
0 jam
Sig.
N
1
2
Subset
Means for groups in homogeneous subsets are displayed.
Based on Type III Sum of Squares
The error term is Mean Square(Error) = 1.090.
Uses Harmonic Mean Sample Size = 9.000.
a.
Duncan
a,b12
.7478
12
1.1373
12
1.3085
.226
Ketebalan
1 cm
3 cm
2 cm
Sig.
N
1
Subset
Means for groups in homogeneous subsets are displayed.
Based on Type III Sum of Squares
The error term is Mean Square(Error) = 1.090.
Uses Harmonic Mean Sample Size = 12.000.
a.
LAMPIRAN 7
Berikut adalah waktu, suhu dalam dan suhu luar STD juga RH di dalam STD yang
dicatat dari pengukuran dengan alat thermohigrometer selama penimbangan sampel
guna menentukan laju pengeringan manisan nanas.
Pengambilan Ke-
Waktu Pengambilan
Suhu Dalam STD
Suhu Luar STD
RH
0
pukul 14.45 WIB
28.4 ºC
25.6 ºC
68 %
2
pukul 09.15 WIB
30 ºC
29.5 ºC
71 %
4
pukul 11.15 WIB
51.5 ºC
29.2 ºC
60 %
6
pukul 09.15 WIB
38.4 ºC
25.7 ºC
75 %
8
pukul 11.15 WIB
47.8 ºC
28 ºC
64 %
10
pukul 13.15 WIB
66.4 ºC
30.4 ºC
54 %
12
pukul 09.30 WIB
31 ºC
29.2 ºC
66 %
14
pukul 11.30 WIB
63 ºC
31.5 ºC
53 %
16
pukul 12.00 WIB
65.4 ºC
31.2 ºC
58 %
18
pukul 10.15 WIB
59.1 ºC
29.4 ºC
57 %
20
pukul 12.15 WIB
85 ºC
32 ºC
45 %