40
PREDICTING OF TSUNAMI HAZARD AREA USING SATELLITE
REMOTE SENSING DATA AND GIS
A. Suharyanto1 , A.Pujiraharjo1, A. Yudono2, K. Murakami3, C. Deguchi4
1Associate Professor, Department of Civil Engineering, University of Brawijaya,
Malang 65145, Indonesia, Email:[email protected], [email protected]
2Assistant Professor, Department of Regional and City Planning, University of
Brawijaya, Malang 65145, Indonesia, Email:[email protected]
3Associate Professor, Civil and Environmental Engineering, University of Miyazaki,
Miyazaki 889-2192, Japan, Email:[email protected].
4Professor, Civil and Environmental Engineering, University of Miyazaki, Miyazaki
889-2192, Japan, Email:[email protected].
ABSTRAK
Tsunami is very important phenomena in the disaster management problems. Based on the tsunami was occurred in Aceh Indonesia on December 26, 2004 killed more than 200.000 peoples, the tsunami disaster management become very important to study. According to the geological data, area of east Java Ocean has high potential of earthquake. The history shows that there are many time tsunami occurred in east Java. In 1994 the tsunami was occurred in
Kabupaten Banyuwangi (Banyuwangi
Prefecture) beach and was killed 240 peoples. To minimize the effect of tsunami hazard, the study of tsunami disaster management is necessary. The first step of study is predicting of area in along shoreline of east Java province, Indonesia. The study based on the topographic map in scale 1:25.000, SPOT HRV satellite imageries scanned on 2009. Geographic Information System (GIS)
technology was used in this research. The tsunami runup was simulated using COMCORT. From the analyzed results it can be seen that there are five important areas have dangerous effect of tsunami. The areas from west to east are Pacitan city, Prigi fishermen residential area, Ambulu residential area,
Grajagan tourist’s area, and several small
INTRODUCTION
On December 26, 2004, the biggest tsunami on world was occurred in Banda Aceh, Indonesia. More than 200.000 peoples were killed by this tsunami. To prevent this disaster in the others areas which are dangerous with the tsunami hazard, it is necessary to analyze how to mitigate the peoples if tsunami occurs. Therefore, the study to predict the area along shoreline in east Java province was done. Base on the studied result, the research of tsunami mitigation management will be done on the most dangerous of tsunami hazard. The purposes of this study is to predict the area along shoreline in southern beach of east Java province dangerous with tsunami hazard.
East Java province located in dynamic area, because there are three plates get together in Java Island. Three plates are Eurasian, Indian Ocean, and Australian plates. Consequently, the earthquake often occurs in Java Island included east Java province area (Kabupaten
Banyuwangi, 2005). Tsunami will be occurred
if there is earthquake in the sea area. Therefore, the potential of tsunami occurrences in southern beach of east Java province is high. To prevent the tsunami disaster hazard, the area along shoreline of southern beach of east Java province which are dangerous affected to tsunami hazard is predicted. From the predicting result, the most dangerous area affected to The tsunami hazard the tsunami disaster management in those area will be studied. The area which is dangerous with the tsunami hazard are area facing directly to the ocean, the topographic condition is flat, and the population density living in those are is high. To understanding the shoreline physical characteristics and existing land use condition, the study was done by supporting the satellite remote sensing (R/S) data and GIS. The R/S data is used to analyze the land use condition and GIS is used to simulate the inundation area due to the wave elevation of run-up.
The run-up elevation can be simulated using numerical method base on the initial wave generated by earthquake location and magnitude (Xiaoming, et.al., 2008). The tsunami propagation and run-up numerical
model was developed base on Cornel Multi-grid Coupled Tsunami Model (COMCOT). The numerical solution was done with assumed (1) full explicit scheme is used, (2) Leap-Frog scheme calculates free surface elevation at point, (3) Upwind scheme is applied for Non-linear convection terms. Extended weakly non-linear Boussinesq-type equations in which time-dependent of water depth (bottom) term is included to the models based on derivation of Lynett and Liu (2002) are used as governing equations. Additional terms to accommodate bottom friction and energy dissipation caused by breaking waves are also included into the momentum equation. In this paper, numerical analysis to find the run-up elevation is not discussed deeply. Only the run-up elevation simulation result was used to predict the inundation area. Base on run-up elevation from the simulation result, the inundated area of along shoreline in southern beach of each Java province will be simulated. Base on the contour of topographic map and land use category especially residential category, the dangerous location of tsunami hazard will be predicted. The purpose of this study is to predict the location of dangerous tsunami hazard along shoreline area of southern beach east Java Province, Indonesia. The inundation area was simulated based on the run-up elevation simulation result using COMCOT. In this research the 5 m and 10 m of run-up elevation was simulated to find the inundation areas. To realize the purpose of the research, the appropriate data is used.
STUDY AREA
The study area is along shoreline of southern beach of east Java province. East Java province is one of provinces occupied in Java island. There are four provinces and two special administrative areas occupied in Java island. The provinces occupied in Java island are
Banten (Banten), West Java (Jawa Barat),
Middle Java (Jawa Tengah), and East Java
42
administrative areas are Special Capital Area Jakarta (Daerah Khusus Ibu Kota Jakarta) and Yogyakarta Special Area (Daerah Istimewa
Yogyakarta).
Geographically, shoreline of east Java province located between 110°50’ - 114°10’ East Longitude and between 8°05’ - 8°30’ South Latitude. Almost the topographic condition of shore line is hilly (Fac. of Engineering, 2007). Part of the east Java shoreline topographic condition can be seen in figure 1.
Fig.1. Topographic condition of part of shoreline in east Java province
RESERACH MATERIALS AND METHODS
There are many data was used in this research. The most important data are topographic map and satellite remote sensing data. The all data used in this research can be summarized as follows.
1. Topographic map from published by BIG
(Geomatics Information Agency) in scale 1:25.000.
2. Satellite R/S data of SPOT HRV scanned in 2009.
3. East Java Province regional plan document.
4. Regional plan document books of all
Kabupaten occupied shoreline area of East
Java Province.
5. Land use map along shoreline area.
6. Population density along shoreline area (from BPS - National Statistic Bureau).
7. Existing road map.
GIS is used to analyze the inundation area along shoreline. Consequently, all of the data is convert to the GIS format data. To analyze the area which are dangerous to the tsunami hazard, contour, elevation, shoreline, land use, and population density layers are needed. The contour and shoreline layers are generated from topographic map. For elevation run-up layer is generated from the tsunami run-up simulation result. The land used map is classified from satellite R/S data and combined with regional plan map of east Java province area. The population density layer is developed using administrative map and population density data from BPS. After all layers data was ready, the overlapping process was done to analyze the inundation area along shoreline. The analyzing process in principle can be summarized as follows.
1. First step is overlapping between contour layer and elevation layer.
2. From this process, the area which are inundated by the tsunami run-up will be found.
3. Overlapping between contour, elevation, and land use layers.
4. The result of the overlapping process is which location have residential area will be inundated by the tsunami run-up. By looking the population density, the number of people will be inundated can be calculated.
5. From the above process, the most dangerous of area along shoreline of east Java province can be decided.
population density data on the related area. From this process, the dangerous area due to the tsunami hazard can be predicted. The area is dangerous by the tsunami hazard if those area inundated by tsunami run-up and have high density population.
The satellite R/S data is used to derivate the land use map (Mather, 1997). The combination of land use derived from regional planning map and land used classified from R/S data is used as final land use map. The unsupervised classification method with maximum likelyhood distance is use to classify the land use from the satellite R/S data.
RESULT AND DISCUSSION
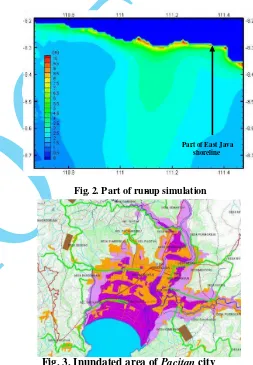
To predict the inundated area due to the tsunami run-up elevation, it is necessary to decide the run-up elevation. Based on the tsunami history occurred in the southern each of Java Island and from the simulation result, the elevation of run-up are 5 m and 10 m. Part of the tsunami run-up simulation result is shown in figure 2. Based on these elevation, the simulation of inundated area was done along shoreline area of east Java province. From the simulation results it can be concluded that there are four locations has highest risk of tsunami disaster. These locations are Pacitan city, Prigi fisheries port area, Ambulu residential area, and Grajagan
tourist area. Beside of these locations, there are many small residential areas along the beach has dangerous effect of tsunami disaster. The detail description of four location which are has higher risk of tsunami hazard can be written in the following paragraphs.
Pacitan city is located in the most west of East
Java Province area. The city has flat topographic condition. The city is water front of Indonesian sea. There is no both vegetative and artificial water front protection. The flat area has boundary with the hilly area. Pacitan city is surrounded by hilly topographic condition.
Pacitan beach area is functioned as tourist area.
From the simulation result is can be seen that the city will be inundated by tsunami with run-up 5
m. As shown in figure 3, the violet color indicated the 5 m run-up inundated area. The yellow color is residential area. From this figure it can be seen that there are many residential area will be inundated by the tsunami with run-up 5 m. It is indicated that Pacitan city is very dangerous affected to the tsunami disaster. On the future it is very necessary to make the research of tsunami disaster management for this area.
Fig. 3. Inundated area of Pacitan city
Prigi fisheries port area is located in Kabupaten
Trenggalek. There are many infrastructures
related to the fisheries equipment such as boat terminal, fish market, break water for port facilities, etc. Near with the port, there is fishermen residential area. Due to the simulation result as shown in figure 4, it can be seen that the residential area will be inundated by tsunami with 10 m run-up elevation. Beside residential area, the fisheries infrastructure will also be damaged by the tsunami wave energy.
Fig. 2. Part of run-up simulation Part of East Java
44
This phenomena shows in the tsunami occurred on 1994. There many boats, fish market, and port infrastructures damage by that tsunami. To mitigate this disaster it is necessary to manage the disaster due to the Prigi condition which is dominated by infrastructure of fisheries equipment.
Fig. 4. Inundated area of Prigi fisheries area
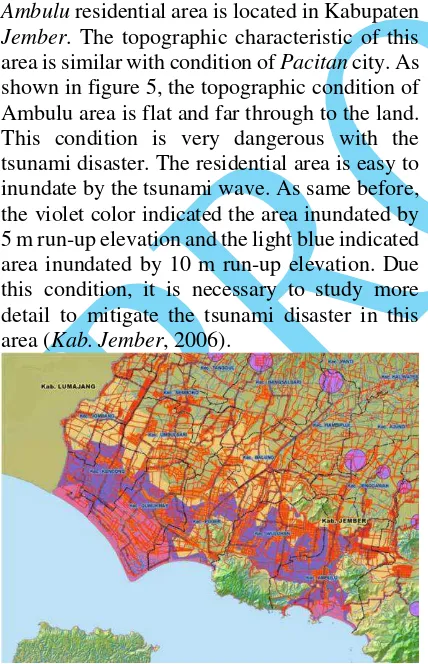
Ambulu residential area is located in Kabupaten
Jember. The topographic characteristic of this
area is similar with condition of Pacitan city. As shown in figure 5, the topographic condition of Ambulu area is flat and far through to the land. This condition is very dangerous with the tsunami disaster. The residential area is easy to inundate by the tsunami wave. As same before, the violet color indicated the area inundated by 5 m run-up elevation and the light blue indicated area inundated by 10 m run-up elevation. Due this condition, it is necessary to study more detail to mitigate the tsunami disaster in this area (Kab. Jember, 2006).
Fig. 5. . Inundated area of Ambulu residential area
Grajagan tourist area is one of famous tourist
destination in east Java province. This area is
very popular for surfing and breeding location for green tortoise. The residential area is far from the beach. The residential area is not so much inundated by the tsunami wave. This condition shows in figure 6. The important thing on this area is the infrastructure of tourist area such as hotel, road, etc. Therefore, it is necessary to manage the evacuation route and shelter area for tourist.
Figure 6. Inundated area of Grajagan Tourist Area
CONCLUSIONS
From this research the result can be summarized as follows:
1. The area with topographic condition is flat, facing directly to the sea, and occupied by high density population is potential inundated by tsunami run-up.
2. GIS supported by Satellite R/S data is powerful to predict the area will be inundated by tsunami run-up with certain run-up elevation.
3. In case of east Java province, Indonesia, there are four area are predicted will be inundated by tsunami with run-up 5 m and 10 m. The four areas are Pacitan city, Prigi
fisheries area, Ambulu residential area, and
Grajakan tourist area.
ACKNOWLEDGEMENTS
acknowledge the LPPM University of Brawijaya for their help in this research administration.
REFERENCES
Faculty of Engineering Brawijaya University, 2007. Final Report Research and Regional Arrangement as Buffer Zone of Tsunami Effect in East Java Province Indonesia, 255 pp.
Kabupaten Banyuwangi 2005, Regional Plan 2005 – 2015 of Kabupaten Banyuwangi, 215 pp.
Kabupaten Jember, 2006. Regional Plan 2006 – 2016 of Kabupaten Jamber, 300 pp. Lynett, P., and Liu, P.L.-F. 2002. A numerical
study of submarine landslide generated waves and runup, Proc. R. Society London, 458, 2885-2910.
Mather P.M. 1997. Computer Processng of Remotely-Sensed Images An Introduction, Chichester: Biddles Ltd., Guildford and
King’s Lynn, 350 pp.