Site this Article As ……….
Paper Accepted : January, 26th 2018
Paper Published : March, 7th 2018 58
ALTERNATIVE PLASTIC BOX 260 ASSEMBLY LINE USING
HEURISTIC METHOD AND SIMULATION METHOD APPROACH
TO INCREASE ASSEMBLY LINE EFFICIENCY
Sabdha Purna Yudha
1), Pratikto
2), Ishardita Pambudi Tama
3)Mechanical Engineering, Faculty of Engineering, University of Brawijaya
1,2)Industrial Engineering, Faculty of Engineering, University of Brawijaya
3)
Abstract
Assembly is the one step on productions. Efficiency of assembly line is affecting to the level of production. To increase the level of production, the efficiency of assembly line must increase to. Aims of this research is to create the alternative assembly line with using heuristic method and simulation approach, to meet higher level of efficiency and increase the assembly line capacity. The result from this research could increase the efficiency of assembly line from 53,2% to 91,5%, and result from simulation approach could increase capacity of assembly line from 9035 box per month to 11249 box per month.Keywords: assembly line, efficiency, heutistic method, simulation method
1. Introduction
Nowadays the manufacturing industry is required to be more competitive so it can win the market. One way or step to make it happen is through the development of operational and processing systems by eliminating unnecessary operating stages and improving productivity of a company can be seen from the company's ability to run the production process effectively and efficiently.
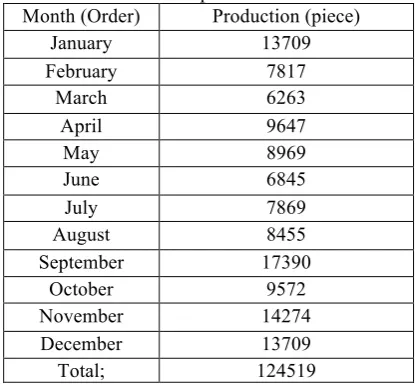
PT. XYZ is one of the strategic industrial companies within the scope of state-owned enterprises (BUMN) owned by the Indonesian government. With the incessant increase in the existing industry in Indonesia caused PT. XYZ must also be able to compete in the existing market, in order to compete in the market it must be done improvements in various lines in PT. XYZ includes existing production lines. One of the existing production lines in PT. XYZ is a box production for packaging needs of various products which are also produced by PT. XYZ. The production data of PT.XYZ 2016 is in Table 1.
From the table above can be seen that the number of orders look not the from month to month during the year 2016, with the average production during the year 2016 which amounted to 10377 pieces of plastic box 260 in production every month. To get around these
* Corresponding author. Email : [email protected] Published online at http://Jemis.ub.ac.id
Copyright ©2017 JTI UB Publishing. All Rights Reserved
different orders the company's strategy is to move the workers from one station to the station that experienced the shortage of workers and done overtime in the last shift to meet the existing order target, and based on the results of preliminary observation, it was found that in the process production of plastic box 260 is still often found barriers or activities that can not give value added that impacts the occurrence of over capacity in certain stations caused by the balance of the existing assembly line.
The purpose of this research is to improve the efficiency of existing stages of operation, one of the way analysis which can be used is using line balancing analysis. After obtaining the line balance analysis of the line,
Table 1. Plastic Box production 260 in 2016 Month (Order) Production (piece)
January 13709
February 7817
March 6263
April 9647
May 8969
June 6845
July 7869
August 8455
September 17390
October 9572
November 14274
December 13709
Site this Article As ………. broadening properties because it uses the unification and development of several methods. and experiments. The heuristic method does not guarantee optimal results, but the method is designed to produce a relatively better strategy with reference to certain constraints. This heuristic method is widely used in the matter of track balance. Some commonly known heuristic methods:
a. Ranked Positional Weight Method (RPW)/
Hegelson and Birine
RPW is one of the heuristic techniques introduced by Helgeson & Bernie. In this method, the Positional Weight Value is calculated from the processing time of each operation that follows. Grouping operations into the work station is done on the basis of the RPW sequence (of the largest) and also takes into account the time limit of the cycle. This Heuristic method prioritizes the longest working elements time, where the elements of this work will be prioritized first to be placed in the work station and followed by other work elements that have lower element time. This process is done by giving weight. This weight is given to each element of work with respect to the precedence diagram. By itself the elements of work that have a great dependence will have a greater weight too, in other words will be prioritized (Groover, 2000).
The steps of RPW method with manual calculation. First draw the precedence diagram according to the actual state, then specify the positional weight for each job element of an operation that has the longest
completion time from the start of the job to the end of the work element that has the completion time (standard time ) The lowest, then sort the element of work based on positional weight in step 2 above the work elements that have the highest positional weight sorted first, then proceed by placing the element of work that has the highest positional weight to the lowest to each work station, then if At each work station there is an excess of time in this case station time exceeds the cycle time, exchange or replace work elements that exist in the work station to the next work station as long as not violate the precedence diagram, last repeat step 4 And the 5th above until all elements of work have been placed into the work station.
b. Killbridge’s and wastern/Region Approach Method (RA)
This method received more attention since its introduction in 1961 and has applied with real success to some of the complicated trajectories of industrial pathways. This heuristic method selects work elements to be assigned to work stations in the precedence diagram. One difficulty of this method is where the work elements are selected because they have a high Te value regardless of their place in the precedence diagram. Overall kill bridge and wastren method provides superior track balance solution (Groover, 2000).
The steps of RA method with manual calculation. First make precedence diagrams, then divide the precedence diagrams into areas ranging from left to right and re-describe precedence diagrams, place all tasks in the leftmost area as far as possible, then from each region sort the tasks starting from the largest operating time Until the smallest operating time, then specify the cycle time (CT), finally load the task in the following order (note also to adjust to the boundary area): a. Leftmost area first; B. In region I, load the task with the largest time first time (in priority); In the last stages of each work station loading, the station time should not exceed the cycle time.
Site this Article As ……….
Paper Accepted : January, 26th 2018
Paper Published : March, 7th 2018 60
longest method of operation, this method is the simplest method. In this method to approach the production line balancing based on the longest operating time will prioritized placement in the work station. The basic principle is to combine processes on the basis of sequencing operations of the largest processing time. Before the merger, must be determined first, how much cycle time will used. This cycle time will be used as a barrier in merging operations within a work station (Groover, 2000).
Steps to do first, sort all the elements of work the most time to the smallest, then work elements on the first work station has taken from the top sequence. Work elements move to the next work station, if the number of work elements has exceeded the cycle time, then continue the process of the previous step, until all work elements have been in the work station and smaller or equal to the cycle time.
2.1.2 Simulation
Simulation is the process of planning a model of a real system and using it as an experimental means for understanding the behavior of a system, as well as evaluating the strategies used to run the system (Law and Kelton, 2000: 7). Meanwhile, according to Banks several uses of the simulation is to enable learning, experimental, and internal interaction of a complex system, to see changes in information, and offer suggestions for
improvements to the real system being observed. From the simulation perspective itself, a system could said to consist of entities, activities, resources and control (Harel, et al., 2004), following the meaning of the mentioned elements of the simulation:
a. Entity: is everything that is processed in the system such as products, consumers, and documents.
b. Activity: is a task undertaken in the system is either directly or indirectly involved in the processing of the entity.
c. Resources : Is a tool or operator to run the activity.
d. Control: is everything that determines how, when and where activities are run.
In certain circumstances, making observations to a system is very important in order to get a picture of the relationship between the various components and to estimate the performance of a system.
2.2 Results and Discussion
2.2.1 Plastic box 260 Production Process
Plastic Box 260 is one of the packaging used to pack ammunition and other equipment PT. XYZ has production. The raw materials of plastic box itself imported from other companies and then added other supporting components, while the own supporting components produced by PT.XYZ itself.
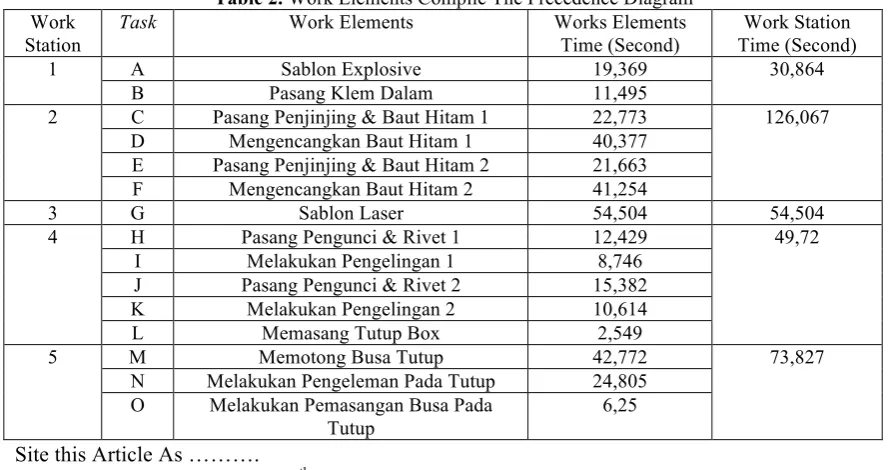
Table 2. Work Elements Compile The Precedence Diagram Work
Station
Task Work Elements Works Elements
Time (Second)
D Mengencangkan Baut Hitam 1 40,377
E Pasang Penjinjing & Baut Hitam 2 21,663
F Mengencangkan Baut Hitam 2 41,254
3 G Sablon Laser 54,504 54,504
4 H Pasang Pengunci & Rivet 1 12,429 49,72
I Melakukan Pengelingan 1 8,746
J Pasang Pengunci & Rivet 2 15,382
K Melakukan Pengelingan 2 10,614
L Memasang Tutup Box 2,549
5 M Memotong Busa Tutup 42,772 73,827
N Melakukan Pengeleman Pada Tutup 24,805
O Melakukan Pemasangan Busa Pada
Tutup
Site this Article As ……….
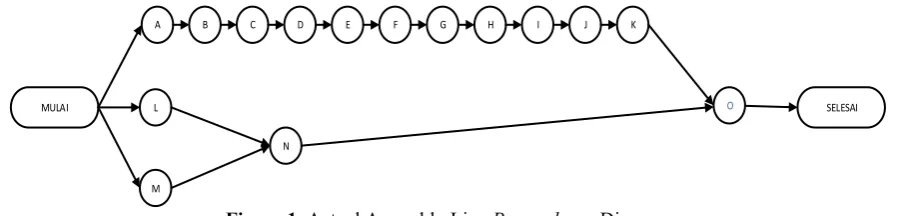
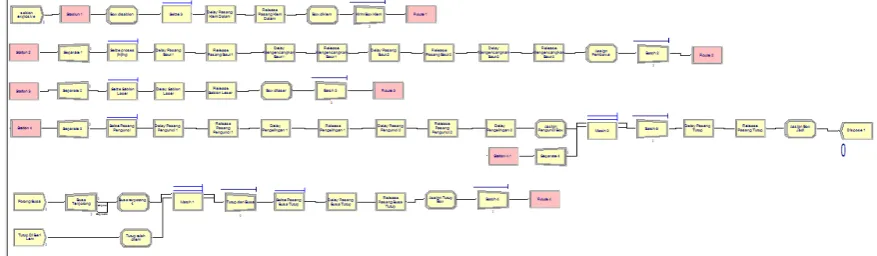
Figure 1. Actual Assembly Line Precendence Diagram
2.2.2 Precedence Diagram Arrangement
From the results of observations on the existing assembly line, found the relationship between elements of existing work. The relationship has shown on the work elements of the precedence diagram in Table 2.
By looking at the arrangement of existing work elements on the assembly line of plastic box 260, the next is to arrange the precendence of the existing assembly line diagram that exists, as in Figure 1.
Precedence diagram above is formed based on observation in the field, where there are 5 work stations with some work elements inside as shown in Table 1.
2.2.3 Line Efficiency, Balance Delay And Smoothing Index Existing Line
Here is the calculation of line efficiency, balance delay and smoothing index of the actual assembly line (Baroto;2002), the following calculations:
After seeing the above calculation, it can be seen that the line efficiency is 53.2%, the assembly track delay is 47% and the smoothing index is 150.8 seconds.
2.2.4 Line Efficiency, Balance Delay And Smoothing Index Heuristic Method Line
The calculation by heuristic method is intended for the calculated existing efficiency to be further enhanced.
a. Calculation by using ranked positional weight method
For balance delay as follows:
Site this Article As ……….
Paper Accepted : January, 26th 2018
Paper Published : March, 7th 2018 62
b. Calculation by using largest candidate rules method
For balance delay as follows:
𝐵𝐷= and the smoothing index of 39,5 seconds.
c. Calculation by using region approach method
For balance delay as follows:
𝐵𝐷= smoothing index of 30,6 seconds.
2.2.5 Results of Actual Assembly Line Simulation and Alternative Assembly Line Simulation
After obtaining the first path of the calculation using the heuristic method, then performed simulation process to see capacity of the alternative line that has established before. a. Determination of Distribution and
Parameters of Each Work Element
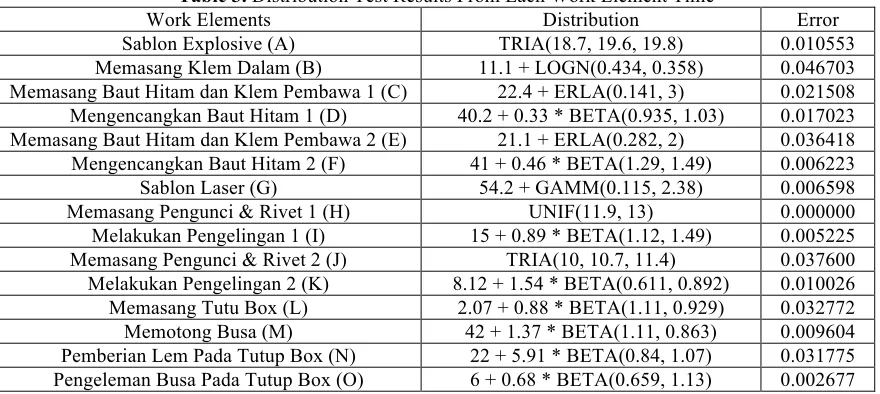
Determination of the distribution and parameters of each work element is done based on the results of direct observation on the existing assembly line. Observation results on the actual line there is a working time of each working element, ranging from work elements A to work elements O. By using the help of one of the tools in ARENA 14 that is Input Analyzer, the following is the result of testing distribution of the working element time, In Table 3.
Table 3. Distribution Test Results From Each Work Element Time
Work Elements Distribution Error
Sablon Explosive (A) TRIA(18.7, 19.6, 19.8) 0.010553
Memasang Klem Dalam (B) 11.1 + LOGN(0.434, 0.358) 0.046703
Memasang Baut Hitam dan Klem Pembawa 1 (C) 22.4 + ERLA(0.141, 3) 0.021508
Mengencangkan Baut Hitam 1 (D) 40.2 + 0.33 * BETA(0.935, 1.03) 0.017023
Memasang Baut Hitam dan Klem Pembawa 2 (E) 21.1 + ERLA(0.282, 2) 0.036418
Mengencangkan Baut Hitam 2 (F) 41 + 0.46 * BETA(1.29, 1.49) 0.006223
Sablon Laser (G) 54.2 + GAMM(0.115, 2.38) 0.006598
Memasang Pengunci & Rivet 1 (H) UNIF(11.9, 13) 0.000000
Melakukan Pengelingan 1 (I) 15 + 0.89 * BETA(1.12, 1.49) 0.005225
Memasang Pengunci & Rivet 2 (J) TRIA(10, 10.7, 11.4) 0.037600
Melakukan Pengelingan 2 (K) 8.12 + 1.54 * BETA(0.611, 0.892) 0.010026
Memasang Tutu Box (L) 2.07 + 0.88 * BETA(1.11, 0.929) 0.032772
Memotong Busa (M) 42 + 1.37 * BETA(1.11, 0.863) 0.009604
Pemberian Lem Pada Tutup Box (N) 22 + 5.91 * BETA(0.84, 1.07) 0.031775
Site this Article As ……….
Paper Accepted : January, 26th 2018
Paper Published : March, 7th 2018 63
b. Analysis Simulation of Existing Assembly Line
Existing line built based on observations in the field during the observation where there are 5 work stations that has built with several work elements of each station, where work station 1 consists of work elements (A, B), work station 2 consists of work elements (C, D , E, F), work station 3 consists of work elements (G), work station 4 consists of working elements (H, I, J, K, L), and work station 5 consists of work elements (M, N, O). Here is the simulation model that has made in Figure 2. Based on the simulation result of the existing assembly line using ARENA 14 software above, obtained the output of finished product on the existing assembly line of 9035 pieces of plastic box 260.
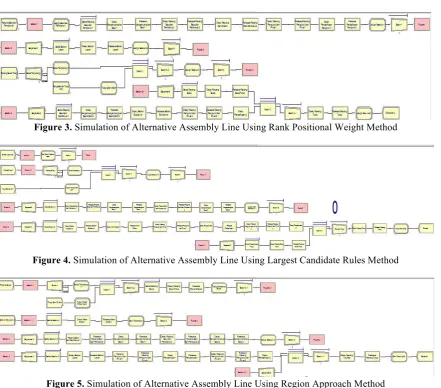
c. Analysis Simulation of Ranked Positional Weight Method
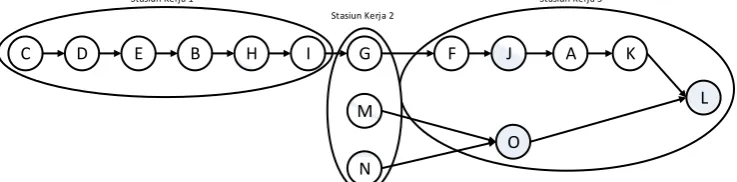
This assembly line has built based on the calculation result with ranked positional weight method on the previous heuristic method where there are 3 work stations with some work elements there, where work station 1 consists of working elements (C, D, E, B, H, I ), Work station 2 consists of working elements (G, M, N), work station 3 consists of working elements (F, J, A, K, O, L). Here is the simulation model that has made in Figure 3. After seeing the simulation result of the assembly line constructed based on calculation of ranked positional weight method using ARENA 14 software above, obtained the output of finished product on the assembly line of 11249 pieces of plastic box 260 which has finished.
d. Analysis Simulation of Largest Candidate Rules Method
The built assembly line based on the calculation result with the largest candidate rules method on calculation of the previous heuristic method where there are 3 work stations with some work elements there, where work station 1 consists of working elements (G, M, N), station Work 2 consists of working elements (C, D, E, F), work station 3 consists of working elements (A, B, H, I, J, K, O, L). Here is the simulation model that has made in Figure 4. After seeing the simulation result of the assembly line that was built based on calculation of the largest candidate rules method using ARENA 14 software above, obtained the output of the finished product on the assembly line of 9040 pieces of plastic box 260 which has finished.
e. Analysis Simulation of Region Approach Method
The assembly line constructed has built based on the results of the calculation by the approach region method of the previous heuristic method where there are 3 work stations with several working elements there, wherein the work station 1 consists of working elements (M, N, A, B, O) , Work station 2 consists of working elements (C, D, E, F), work station 3 consists of working elements (G, H, I, J, K, L). Here is the simulation model that has made in Figure 5. After seeing the simulation result of the assembly line constructed based on calculation of the approach method using ARENA 14 above, the result of the finished product output on the assembly line of 9055 pieces of plastic box 260 which has finished.
Site this Article As ……….
Paper Accepted : January, 26th 2018
Paper Published : March, 7th 2018 64
Figure 3. Simulation of Alternative Assembly Line Using Rank Positional Weight Method
Figure 4. Simulation of Alternative Assembly Line Using Largest Candidate Rules Method
Figure 5. Simulation of Alternative Assembly Line Using Region Approach Method
2.2.6 Discussion
An alternative assembly line that could applied to improve the efficiency of the plastic box 260 assembly line, using the heuristic method approach that has done above. The existing assembly line efficiency is 53.2%, balance delay is 47% and the smoothing index is 17.2 seconds. Can be increased by using calculation of heuristic method, the ranked positional weight method assembly line efficiency is 91.5%, balance delay of the assembly line of 8.6% and the smoothing index of 27.1 seconds. While the line efficiency using Largest Candidate Rules method is 88,6%, balance delay of assembly line is 11,43% and smoothing index is 39,5 seconds. For assembly line efficiency using region approach method is 88,6%, balance delay of assembly line is 11,43% and smoothing index 30,6 second.
On the result of calculation by heuristic method yield three alternative solution
assembly line which then simulate using ARENA 14 software produce different output with result as in Table 4.
Table 4. Average Output of Simulation for Each Assembly Line
Assembly Line Output (Per Month)
Existing 9035
RPW 11249
LCR 9040
RA 9055
Site this Article As ……….
Figure 6. Ranked Positional Weight Assembly Line
Thus, to decide the best alternative assembly line of the three alternative assembly line, the output of the assembly line simulation constructed using ARENA 14 software shown in Table 4 above shows that the assembly path generated from the heuristic method using the RPW method has the result The simulated output of 11249 pieces of plastic box 260, is an alternative to the assembly line with the best results seen from the amount of output plastic box 260 produced.
3. Conclusion
The conclusions from this study:
a. By looking at the calculation result from the actual assembly line, the assembly line efficiency is 53.2%, balance delay is 47% and the smoothing index is 150.8 seconds. After performing the calculation using heuristic method, using three kinds of calculation method, the path ranking efficiency of ranking positional weight method is 91.5%, the balance delay of the seconds. While for the line efficiency of the region approach method that is 88,6%, balance delay is 11,43%, and smoothing index is 30,6 seconds.
b. There are three kinds of assembly line alternatives based on the calculation using the heuristic method, the simulation result from each assembly line solutions found that the output difference. An existing line of only 9035 per month could increased to 11249 pieces per month based on a solution with ranked positional weight method, increased to 9040 pieces per month based on the largest candidate rules method alternative line, increased to 9050 pieces per
month based on the region approach method alternative line. Based on the simulated product output from the assembly line solution obtained through the calculation of the heuristic method, the highest increase was obtained from the ranked positional weight method (RPW) with the output of 11249 pieces of product per month, with an assembly line efficiency of 91.5%, The balance delay of the assembly line of 8.6% and the smoothing index of 27.1 seconds.
REFERENCES
[1] Banks, J. Handbook of simulation: Principles, methodology, advances, applications, and practice. New York: Jhon Wiley and Sons 1998.
[2] Baroto, Teguh. Perencanaan Dan
Pengendalian Produksi. Jakarta : Ghalia Indonesia 2002.
[3] Mulyana. Fajar. Redesign Layout Workstation Proses Injection Molding Berdasarkan Workload Analysis dan Proses Simulasi Pada Pembuatan Komponen LCD TV. Thesis 2015.
[4] Groover, Mikell P. Automation, Production Systems, and CIM, 2nd edition. Prentice Hall. New Jersey. USA. 2001.
[5] Law, Averill M. and Kelton, W.D.
Simulation Modelling and Analysis, 3rd edition, MC Graw-Hill, USA. 2000.
[6] Nuzulis, Kamalia. Redesign Layout
Fasilitas Kerja Dengan Metode Blocplan
dan Simulasi Arena di CV. Buah Segar Hutama. Thesis. 2014.
[7] Saiful, Dkk. Penyeimbangan Lintasan Produksi Dengan Metode Heuristik (Studi Kasus PT XYZ Makassar). Jurnal Teknik Industri, Vol. 15, No. 2 Agustus 2014.
Site this Article As ……….
Paper Accepted : January, 26th 2018
Paper Published : March, 7th 2018 66
[9] Wedel, Michael, Real-time bottleneck detection and prediction to prioritize fault repair in interlinked productin lines. Jurnal Sceience Direct Prosedia CIRP 37 (2015) 140-145. 2015.
[10]Weldemar. Assembly Line Balancing Problem With Reduse Number of Work Stasions. Jurnal Sceince Direct.
Preoceedings of the 19th world congress The Internasional Federation of Automatic Control. Cape Town South Africa. 2014.