Journal of Life Sciences
Volume 10, Number 1, January 2016 (Serial Number 92)
Dav i d
David Publishing Company www.davidpublisher.com
Publication Information
Journal of Life Sciences is published monthly in hard copy (ISSN 1934-7391) and online (ISSN 1934-7405) by David Publishing Company located at 616 Corporate Way, Suite 2-4876, Valley Cottage, NY 10989, USA.
Aims and Scope
Journal of Life Sciences, a monthly professional academic journal, covers all sorts of researches on molecular biology, microbiology, botany, zoology, genetics, bioengineering, ecology, cytology, biochemistry, and biophysics, as well as other issues related to life sciences.
Editorial Board Members
Dr. Stefan Hershberger (USA), Dr. Suiyun Chen (China), Dr. Farzana Perveen (Pakistan), Dr. Francisco Torrens (Spain), Dr. Filipa João (Portugal), Dr. Masahiro Yoshida (Japan), Dr. Reyhan Erdogan (Turkey), Dr. Grzegorz Żurek (Poland), Dr. Ali Izadpanah (Canada), Dr. Barbara Wiewióra (Poland), Dr. Valery Lyubimov (Russia), Dr. Amanda de Moraes Narcizo (Brasil), Dr. Marinus Frederik Willem te Pas (The Netherlands), Dr. Anthony Luke Byrne (Australia), Dr. Xingjun Li (China), Dr. Stefania Staibano (Italy), Dr. Wenle Xia (USA), Hamed Khalilvandi-Behroozyar (Iran).
Manuscripts and correspondence are invited for publication. You can submit your papers via Web Submission, or E-mail to [email protected] or [email protected].
Editorial Office
616 Corporate Way, Suite 2-4876, Valley Cottage, NY 10989, USA Tel: 1-323-9847526, Fax: 1-323-9847374
E-mail: [email protected], [email protected]
Copyright©2016 by David Publishing Company and individual contributors. All rights reserved. David Publishing Company holds the exclusive copyright of all the contents of this journal. In accordance with the international convention, no part of this journal may be reproduced or transmitted by any media or publishing organs (including various websites) without the written permission of the copyright holder. Otherwise, any conduct would be considered as the violation of the copyright. The contents of this journal are available for any citation. However, all the citations should be clearly indicated with the title of this journal, serial number and the name of the author.
Abstracted / Indexed in
Database of EBSCO, Massachusetts, USA Chemical Abstracts Service (CAS), USA
Database of Cambridge Science Abstracts (CSA), USA Database of Hein Online, New York, USA
Ulrich’s Periodicals Directory, USA Universe Digital Library S/B, Proquest
American Federal Computer Library center (OCLC), USA China National Knowledge Infrastructure, CNKI, China
Chinese Scientific Journals Database, VIP Corporation, Chongqing, China Index Copernicus, Index Copernicus International S.A., Poland
Google Scholar (scholar.google.com)
Subscription Information Price (per year): Print $680.
David Publishing Company
616 Corporate Way, Suite 2-4876, Valley Cottage, NY 10989, USA Tel: 1-323-9847526, 323-410-1082; Fax: 1-323-9847374
E-mail: [email protected]
David Publishing Company www.davidpublisher.com
DAV ID P UBL ISH IN G
J LS
Journal of Life Sciences
Volume 10, Number 1, January 2016 (Serial Number 92)
Contents
Zoology and Botany
1 Teat Length and Lactation Period as A Predisposition Factor of Subclinical Mastitis in Dairy
Cattle in Bandung, Indonesia
Herwin Pisestyani, RP Agus Lelana and Yeti Nevia Septiani
7 The Effects of Calcium Chloride and Ascorbic Acid Treatment on Ready-to-use Carrot Shreds
Mehmet Ufuk Kasim and Rezzan Kasim
16 The Cytochrome b Polymorphism of Meat Lines Rabbits
Vladimir Parkanyi, Lubomir Ondruska and Dusan Vasicek
Ecology
21 Using Magnetic Technique to Increase Efficiency of Organic Pollutants Biodegradation in
Wastewater
Khalid Falih Hassan, Suadad Awad Kadhim, Noor Nihad Baqer and Elaaf Safa Al-deen Hassan
33 The Impact of Life Sciences Developments on the UK Urban Environment
Peter Jones, Martin Wynn, David Hillier and Daphne Comfort
Interdisciplinary Researches
39 Serpentine Design on Forest Roads by the Internal Circular Curve Method: A Case Study in
Serbia
Bogdan Ž. Stefanović
48 The Role of Homocysteine and Other Clinical Laboratory Markers in Assessing Cardiovascular
Risk in Patients on Hemodialysis
Irena Ivanova Gencheva-Angelova, Adelaida Lazarova Ruseva and Pavlina Dimitrova Yordanova-Laleva
54 Epidemiology of ADRs in Internal Medicine, HCC
Journal of Life Sciences 10 (2016) 1-6 doi: 10.17265/1934-7391/2016.01.001
Teat Length and Lactation Period as A Predisposition
Factor of Subclinical Mastitis in Dairy Cattle in Bandung,
Indonesia
Herwin Pisestyani1, RP Agus Lelana2 and Yeti Nevia Septiani2
1. Veterinary Public Health Division, Department of Animal Health and Veterinary Public Health, Faculty of Veterinary Medicine,
Bogor Agricultural University, Bogor 16680, Indonesia
2. Clinic Division, Department of Clinic Reproduction and Pathology, Faculty of Veterinary Medicine, Bogor Agricultural
University, Bogor 16680, Indonesia
Abstract: In order to improve the practical approach to clinical diagnosis of subclinical mastitis, 72 dairy cattle from KPSBU Lembang Bandung Regency was used in this research. The purpose of this research was to study the correlation between udder length and lactation period with the profile of subclinical mastitis. Lactation period data was collected from interviews with farmers. Subclinical mastitis testing by IPB-1 Mastitis Test reagent and udder length measured using measuring tape (cm). Data was analyzed using Duncan test and logistic regression. The highest correlation of subclinical mastitis occurred to dairy cattle with average udder length of 7.5 cm and was in the third and forth lactation period. This result shows that udder length and lactation period of dairy cattle is a predisposing factor for subclinical mastitis. This finding is important to improve the milking management as well as a way to diagnose subclinical mastitis.
Key words: Lactation period, subclinical mastitis, udder length.
1. Introduction
Subclinical mastitis is a disease in dairy cattle that has not been handled well. Subclinical mastitis is inflammation of the internal tissue of the udder [1]. Losses caused by subclinical mastitis are decreased in milk production, decreased of milk quality, expensive cost for treatment and medication, early culling of cattle as well as purchasing of new dairy cattle [2]. These threats are faced by 127,211 farmers in Indonesia whose cattle population reached 475 thousand heads with 19 million liter of milk production [3]. It will be hard for Indonesia to reach self-sufficiency in milk if it does not pay attention to these threats are. Indonesia is currently only able to fulfill 20-30% of its domestic demand [4].
One of the problems faced in handling subclinical mastitis lies on the ability to diagnose in the field and
Corresponding author: Herwin Pisestyani, DVM, research field: veterinary public health.
the farmers accessibility to obtain a subclinical mastitis diagnosis kit. These conditions are also faced by the livestock in West Java with business scale of 5.8 heads per business unit and production capability of approximately 11.6 liter/head/day [5]. Therefore a more practical alternative solution is needed, such as studying the predisposing factors that can be used as an indicator of subclinical mastitis.
An attempt to identify subclinical mastitis predisposing factors among others is to assess udder health. According to Blakely, J. [6], udder health of dairy cattle in relation to milk production is affected by the cows’ physical condition, milking habits, body condition score and udder scoring. Udder scoring covers teats length, position of the front teat, front udder linkage, udder depth, rear udder height, middle ligament and position of rear teat [6]. Saragih, B. [7] stated that other than the anatomical factor of the udder, cleanliness of the floor, floor surface and hygienic milking of udder also affect udder health. Udder health
D
Teat Length and Lactation Period as A Predisposition Factor of Subclinical Mastitis in Dairy Cattle in Bandung, Indonesia
2
can be achieved by maintaining personal hygiene, milking hygiene, good shed management, good milking management, vaccination program, and administrating antibiotic periodically [8].
BIF [9] assign a standard that average size teat length for both front teats of Frisian Holstein (FH) cow should be 6 cm in length and 2.9 cm in diameter, while the rear has an average size of 5 cm in length and 2.6 cm in diameter. Prihadi, S. [10] stated that Indonesian FH cow is different then it’s origin, it has the ability to produce an average of 10 liter per day with 12-15 month calving interval and lactation period approximately 10 month or an average milk production of 2,500-3,000 liter per lactation. The average age of dairy cows first lambing is 2-2.5 years and this is the first lactation period [11]. Lactation period is the period the cow produces milk between birth and dry period, therefore duration of lactation is between 8-10 months [2].
There have not been many studies of predisposing factors for subclinical mastitis in dairy cattle. Therefore this research is needed to know teat length and lactation period as one of the predisposition factor for subclinical mastitis in the livestock in KPSBU Lembang Bandung Regancy.
2. Material and Methods
2.1 Time and Place of Research
The research is conducted in the month of July-December 2012, on the livestock who are members of KPBSU Lembang in Sukajaya Village, District Lembang, Bandung Regency, West Java.
2.2 Tools and Materials
Tools used in this research are paddle, measuring tape (cm), cloth and stationery. Materials used are IPB-1 reagent mastitis test and milk sample from each quarter.
2.3 Research Method
This research is a field study of subclinical mastitis cases. Data is obtained through research and interview. Interview is conducted to obtain information regarding
farmer and cow in normal lactation condition. Farmers’ information includes: name of farmer, village, and number of cow in a shed. Cow information includes: cow number, age and lactation period, and amount of milk production per day. Somatic Cell Count (JSS) testing is done by indirect method. The indirect method used is subclinical mastitis diagnosis using IPB-1 Mastitis Test reagent. Measuring the length of teats is done using tape measure expressed in centimeters (cm).
2.4 Determination of Sample Size and Withdrawal
Determination of sample size begin with recording the number of dairy cattle in Sukajaya Village based on udder health testing requirements which are; cows is in its normal lactation condition. The amounts of sample size obtained are 72 dairy cows.
2.5 Measuring of Teat Length
Teat length is measured using measuring tape (cm). Measuring is performed on each quarter after cow is bathed.
2.6 Subclinical Mastitis Testing
Subclinical mastitis testing is done by indirect method using IPB-1 Mastitis Test reagent [12]. Paddle is filled with 2 mL of milk from a cow that was previously bathed, udder cleaned, and then milk is milked from the teat. First and second spray is disposed, and then the next spray of milk is collected in the paddle. IPB-1 Mastitis Test reagent is added in the sample with a 1:1 ratio. Sample and reagent is homogenized horizontally for 15-30 s. Test principles of IPB-1 Mastitis Test is that the reagent will bind with somatic cell nucleus DNA which will form a think gelatin like mass. A thicker mass shows more somatic cell nucleus DNAs that are bind with IPB-1 Mastitis Test reagent.
Mastitis in Dairy Cattle in Bandung, Indonesia
thicker mucous, positive three mucous is very thick like a gelatin mass.
2.7 Data Analysis
Data is analyzed descriptively, Gamma test and logistic regression analysis. Descriptive analysis and Gamma test is used to see relation or correlation between variables in the study and to determine the association variables that are ordinal [13]. Data is also analyzed by using Microsoft Office Excel 2007 and Duncan test.
3. Result and Discussion
3.1 Influence of Teat Length Towards the Severity of Subclinical Mastitis
Udder or cows mammary gland consist of 4 separate parts. The left and right part is separated by a sulcus called sulcus intermamaria that runs longitudinally. Aspects that must be observed from the udder are size, production capacity, udders’ height from floor surface when cow is standing, and udder symmetry [14].
Ligamentum suspensorium is the divider from each udder quarter. This ligament functions as a foundation for the udder and a divider between quarters. The outer ligament is the Ligamentum lateralis [15]. This ligament functions as a buffer and gives the shape of the udder. Age can affect the strength of the ligament, which separates each quarter of the udder. The higher the lactation period shows the older the age of the cow. Average teat lengths of each lactation period of dairy cattle in KPSBU Lembang Bandung Regency are shown in Table 1.
Results of this study show an increase of teat length in each lactation period. In the first lactation period teat length is 4.75 cm, second lactation 5.6 cm, third lactation 6.5 cm, forth lactation 7.5 cm, fifth lactation 7.6 cm, and sixth lactation 8 cm. Teats that become longer is influenced by incorrect ways of milking and weakness of ligament.
Traditional milking by using two fingers (Strip Method) will affect the anatomical shape of the udder.
Table 1 Average of teat length in each period of lactation of dairy cattle in KPSBU Lembang, Bandung Regency.
Lactation Teat length (cm)
average min max
Milking with two fingers is milking with the thumb and forefinger that shifts from the base of the teat down while messaging, loosen and tighten to the top. The weakness of milking this way is that the teat and udder are always wet, this can cause lesion on the udder and can slowly change the anatomical shape of the teat to become longer [16]. This method of milking is applied on farms in KPSBU Lembang. Udder with weak ligaments will show an udder shape that falls and hangs. Weak Ligamentum suspensorium will cause the udder to loose shape and loose its fold between quarters. Weakness of this ligament also causes the cows’ teat to be prominent and long [15]. This study also shows the influence of teat length towards the degree of severity of subclinical mastitis from KPSBU Lembang dairy farm that is presented in Table 2.
Data obtain from this study indicates that teat length significantly affects the level of severity of subclinical mastitis (P < 0.05). Table 2 shows that teat with a 7.5 cm length is more susceptible to subclinical mastitis compared to teat with a 4.75 cm length, therefore teat length can be used as a predisposing factor of
Table 2 Influence of teat length towards the degree of severity of subclinical mastitis from KPSBU Lembang Bandung Regency.
Teat Length and Lactation Period as A Predisposition Factor of Subclinical Mastitis in Dairy Cattle in Bandung, Indonesia
4
subclinical mastitis. Teat with a 7.5 cm length has a level of subclinical mastitis severity of positive 3 (+++), teat with a 6.5 cm has a level of subclinical mastitis severity of positive 2 (++), and teat with a 5.75 cm has a level of subclinical mastitis severity of positive 1 (+). Teat condition that does not have subclinical mastitis is shown by teat that has a length of 4.75 cm. According to the result of the study, farmers can use teat length as a diagnosis indicator for subclinical mastitis that is dairy cattle with teat length of 6.5-7.5 cm may have subclinical mastitis.
BIF [9] stated that subclinical mastitis cases occur in teats with a length category of 7-9 cm. Subronto [2] stated udders that hangs tremendously or udders that are long and have large teat opening is a predispose factor to udder inflammation in terms of the cattle. Long teats will make it easy for microbes to enter the internal tissue of the udder from the outside of the teat through the teat hole (ascendens) and lesions on the udder due to friction with the floor [16]. Teat size that are to short is also a predispose factor for subclinical mastitis. This is because farmers have difficulty in milking therefore the alveoli cannot secrete milk completely.
3.2 Influence of Lactation Period towards Severity Level of Subclinical Mastitis
Mastitis is an inflammation of the udder, whether it is acute, sub acute or chronic, with the increase of somatic cells in the milk and physical as well as the composition of milk, with or without pathological changes in the gland [2]. 95-98% of mastitis incidence is subclinical mastitis, while 2-3% incidence of clinical mastitis is detected [1]. Losess caused by subclinical mastitis are decreased in milk production, decreased of milk quality, expensive cost for treatment and medication, early culling of cattle as well as purchasing of new dairy cattle [2].
Length of the teat, ligament linkage, feed, weather, lactation period and genetic quality of the cow can influence subclinical mastitis [17]. The influence of lactation period towards the degree of severity of
subclinical mastitis in dairy cattle in KPSBU Lembang is presented in Figure 1.
This study shows that lactation period significantly affects the degree of severity of subclinical mastitis (P
< 0.05), meaning that the higher the lactation period will increase the degree of severity of subclinical mastitis. Base on Figure 1 it appears that the incidence of subclinical mastitis with different degree of severity has increased on each lactation period. For cows in its first lactation, age between 2.5-3 years and its first time giving birth, shows that the presentation of subclinical mastitis incidence with a degree of severity ranging between 0.7%-1.7%. Incidence of subclinical mastitis with a positive three degree of severity continues to increase until its peak that is at the forth lactation period as high as 8.3%. This is likely due to cows that previously experienced subclinical mastitis with a degree of severity of 1 and 2 whom later became worse and became a positive 3. In cows that have reached the fifth and sixth lactation period with age range of 8-9 years, it is seen that the degree of severity of subclinical mastitis of positive three experience a decrease. Cows that initially experienced subclinical mastitis but because they were not handled well became a clinical mastitis case may have caused this. The decrease of percentage of positive 3 degree of severity of subclinical mastitis can also be due to healing process because of
Mastitis in Dairy Cattle in Bandung, Indonesia
good handling. This study is consistent to [18] study that stated that subclinical mastitis incidence will increase until cow reaches the age of around eight years and will continue to increase from the first lactation until its peak that is in the third and forth lactation period which will then decrease according to the next lactation period.
Increase of subclinical mastitis incidence may occur because the older the cow becomes the udders main supporting tissue that is Ligamentum suspensatorium lateral et medial weakens and nutrition that is given to the cow lacks guarantee which can lead to clinical mastitis incidence [15]. The increase of lactation period will cause the time needed for teat cistern to close longer which will facilitate the entrance of microorganisms from outside into the udder. Age factor and degree of milk production of cow also affects the incidence of mastitis. The older the cow and the higher its milk production, the more loose the teat sphincter is. Teat with a loose sphincter will enable the cow to be infected with microorganism. The more a cow produces milk; therefore the longer time is needed for the sphincter to close completely [2].
3.3 Correlation between Teat Length and Lactation Period with Degree of Incidence of Subclinical
Mastitis
Subclinical mastitis causes loss milk production
up 70% per head [1]. In the practices of dairy farming, it is known that the correlation between lactation periods, teat length with subclinical mastitis cannot be separated from the affects of early selection [19]. Correlation between teat length and lactation period with subclinical mastitis incidence of dairy farms in KPSBU Lembang is presented in Figure 2.
Figure 2 shows a linear correlation between teat length and lactation period towards degree of incidence of subclinical mastitis in KPSBU Lembang. This means there is a significant correlation between teat length and lactation period towards degree of incidence of subclinical mastitis. Higher lactation period and longer teats will increase the percentage of subclinical mastitis incidence. In the first lactation period, cows with teat length of 4.75 cm experience subclinical mastitis incidence as high as 45%. Percentage of subclinical mastitis incidence as high as 48% occur in cows with teat length of 6.5 cm and has entered the third lactation period. Cows that has entered the fifth and sixth lactation period with teat length of 7.6 cm and 8 cm has a 60% and 70% chance of being affected by subclinical mastitis. From this study it is obtained that teat length and lactation period can be used as diagnosis indicator of subclinical mastitis and can also be used as a predisposed factor from subclinical mastitis incidence.
Fig. 2 Correlation between lactation period and teat length with subclinical mastitis incidence in KPSBU Lembang Bandung Regency (r = 0.972, P < 0.05).
48%
70% 60%
50%
Teat Length and Lactation Period as A Predisposition Factor of Subclinical Mastitis in Dairy Cattle in Bandung, Indonesia
6
This study is consistent with [20] that stated higher lactation period and longer teat length will cause the degree of incidence of subclinical mastitis to increase. This is due to weakness of ligament in maintaining the anatomical shape and the closing of the teat sphincter which need longer time. Sudarwanto M. [1] stated that time needed for the teat sphincter to close or restore of teat width after milking is 10-15 sec. The more time the sphincter needs to close, causes more amounts of microorganisms form the environment to enter the udder. One of the preventive measures to suppress the incidence of subclinical mastitis is teat dipping. Teat dipping is dipping of teats after milking into a liquid that contains disinfectant. Disinfectant used is iodophore with a 1% iodine concentration [15].
4. Conclusions
Lactation period and length of udder is a predisposing factor towards the level of incidence of subclinical mastitis in dairy cattle. Highest incidence of clinical mastitis occurred to dairy cattle with average teat length of 7.5 cm and was on the third and forth lactation period.
References
[1] Sudarwanto M. 1999. Usaha peningkatan produksi susu melalui program mastitis subklinis. Orasi Ilmiah. Bogor, 22 Mei 1999.
[2] Subronto. 2003. Ilmu Penyakit Ternak 1. Yogyakarta (ID): UGM Pr.
[3] DSSP (Data Sementara Statistik Peternakan). 2009. Produksi Susu Sapi Perah. [Internet]. [diacu 2013 April 17]. Tersedia dari: http://faterna.unand.ac.id/index.php? tabel=1&id_subyek=36.
[4] Luthan, F. 2011. Pengembangan Agribisnis Persusuan di Indonesia. Sumatera Barat (ID): Universitas Andalas. [5] DSSP (Data Sementara Statistik Peternakan). 2008.
Produksi Susu Sapi Perah. [Internet]. [diacu 2013 April 17]. Tersedia dari: http://faterna.unand.ac.id/index.php? tabel=1&id_subyek=36.
[6] Blakely, J., and Bade, D. H. 1991. Ilmu Peternakan. Ed
ke-4. Terjemahan: Srigandono B. Yogyakarta (ID): UGM Pr.
[7] Saragih, B. 2000. Kumpulan Pemikiran: Agribisnis Berbasis Peternakan. Bogor (ID): Pustaka Wirausaha Muda.
[8] Alluwaimi, A. M. 2004. The Cytokines of Bovine Mammary Gland: Prospect for Diagnosis and Therapy. Research in Veterinary Science (in Pr).
[9] BIF (Beef Improvement Federation). 2011. BIF Guidelines for Unifrom Beef Improvement Program. 8th ed. Beef Improvement Federation. Athens (GR): Georgia Univ.
[10] Prihadi, S. 1997. Dasar Ilmu Ternak Perah. Yogyakarta (ID): Fakultas Peternakan Universitas Gajah Mada. [11] Sudono, A. 1999. Ilmu Produksi Ternak Perah. Diktat
Kuliah Fakultas Peternakan IPB, Bogor. Jurusan Ilmu-ilmu Sosial Ekonomi Pertanian. Bogor (ID): Fakultas Pertanian IPB.
[12] Sudarwanto M. 1998. Pereaksi IPB-1 sebagai pereaksi alternatif untuk mendeteksi mastitis subklinis. Bogor (ID): Fakultas Kedokteran Hewan Institut Pertanian Bogor.
[13] Agresti, A., and Finlay, B. 2009. Statistical Methods for the Social Science. New Jersey (US): Pearson E.
[14] Farmer, W. S., and Chrestman, G. 2006. Dairy Cattle Judging. Mississipi (US): Mississipi State University. [15] Falvey, L., and Chantalakhana, C. 1999. Smallholder
Dairying in the Tropics. Bibliography: Milking, chapter 16. Nairobi. Kenya (KE): Internasional Livestock Research Institute.
[16] Lukman, D. W., Sudarwanto, S., Sanjaya, A. W., Purnawarman, T., Latif, H., Soejoedono, R. R., and Pisestyani, H. 2009. Higiene Pangan. Bagian Kesehatan Masyarakat Veteriner Departemen Ilmu Penyakit Hewan dan Kesmavet. Bogor (ID): Fakultas Kedokteran Hewan Institut Pertanian Bogor.
[17] Ikawati, A. 2011. Analisis kandungan protein dan lemak susu hasil pemerahan pagi dan sore pada peternakan sapi perah di Wonocolo Surabaya [skripsi]. Surabaya (ID): Fakultas Kedokteran Hewan Universitas Airlangga. [18] Siregar, S. 1995. Jenis Teknik Pemeliharaan dan Analisa
Usaha Sapi Perah. Jakarta (ID): Penebar Swadaya. [19] Lush, S. 1990. “Jenetic Progress trough Selection in a
Closed Herd of Indian Cattle.” J. Dairy Sci. 51: 1059-64. [20] Sudono, A., Rosdiana, R. F., and Setiawan, B. S. 2003.
Journal of Life Sciences 10 (2016) 7-15 doi: 10.17265/1934-7391/2016.01.002
The Effects of Calcium Chloride and Ascorbic Acid
Treatment on Ready-to-use Carrot Shreds
Mehmet Ufuk Kasim and Rezzan Kasim
Kocaeli University, Graduate School of Natural and Applied Sciences, Vocational School of Arslanbey, Kocaeli 41285,
Kartepe-Kocaeli/Turkey
Abstract: This study aimed to evaluate the effect of calcium and ascorbic acid treatments on the quality of carrot shreds during storage. Towards this aim, carrot shreds were dipped into a 5 L solution of 2 g/L ascorbic acid containing 1%, 3%, or 5% CaCl2 (Ca
+ AA) for 3 min at room temperature (~20 °C). In case of the control group (control, C), samples were dipped into distilled water for the same time interval. Subsequent to treatment, carrot shreds were stored in a cold room at 5 ± 1 °C, 85-90% RH for a period of 11 days. Color values (L*, a* b*), whiteness index, saturation index, hue angle values, visual quality, firmness scores, bitterness scores, total soluble solids (TSS) and electrolyte leakage measurements were conducted at various sampling dates. The results from this study demonstrated that brightness of carrot shreds was augmented by calcium and ascorbic acid treatments irrespective of the dosage used. Whiteness index values for the 5% Ca + AA treated samples were observed to be low whereas saturation indices of 5% Ca + AA and 3% Ca + AA treated carrot shreds were higher as compared to other treatments. This study concludes that treatment with calcium at high doses improves the color quality of carrot shreds under storage conditions. Visual quality and firmness of carrot shreds was maintained till day 4 of storage, thereafter it declined as compared to the control group. Bitterness of carrot shreds was also observed to increase upon treatment with calcium and ascorbic acid. However, calcium treatment of the test carrot shreds was seen to decrease weight loss and cause an increase in the TSS under storage conditions.
Key words: Calcium, ascorbic acid, color, bitterness, quality.
1. Introduction
Fresh-cut vegetables are vegetables that are available in a ready-to-use format. They are minimally-processed plant products that are peeled, trimmed and/or cut prior to being packaged in a way that retains freshness whilst being convenient to the end user. Lettuce and pre-prepared salads are the most common types of fresh-cut vegetables available commercially, although fresh-cut carrots, tomatoes, broccoli, cauliflower, and cabbage can also be found [1].
In recent years, Turkey has witnessed an increase in the demand and availability of fresh-cut vegetables as well as fruits; the examples include pre-washed and trimmed spinach, sliced carrots, leeks, apples, etc.
The basic premise for obtaining high quality
Corresponding author: Rezzan Kasim, Dr., associate professor, research field: postharvest technology of vegetables.
fresh-cut vegetables is minimal processing such that the produce retains fresh-like texture, color, flavor, and safe-to-use quality. However, injuries that occur during processes such as peeling, slicing, cutting, shredding, etc. result in stress at the tissue cellular, subcellular and biochemical levels leading to several undesirable changes in the vegetables during the course of storage and transportation [2].
In the case of fresh-cut carrots, the most significant problem faced is surface whitening. It is a phenomenon that arises as a result of dehydration and lignin synthesis. Several treatments, such as application of edible coatings [3], treatment with citric acid [4, 5] or ascorbic acid [6] are available to prevent the whitening.
Results from previous studies have indicated that treatment of carrot shreds with ascorbic acid is successful in preventing the appearance of surface whitening. However, as this treatment results in
D
The Effects of Calcium Chloride and Ascorbic Acid Treatment on Ready-to-use Carrot Shreds
8
softening of the shreds, the application of a firming agent has been suggested for maintaining the crispness [6]. Calcium treatments that use either calcium chloride (CaCl2) or calcium lactate have been shown to be effective in maintaining the firmness of several fresh-cut fruits and vegetables during storage [7]. It is also known that treatment with Ca2+ has the potential to maintain the textural qualities of carrot for as long as up to 10 days of storage [2]. As softening and other undesirable textural changes in fresh-cut products are related to their tissue calcium levels, application of calcium salts (calcium-chloride, -carbonate, -lactate, -propionate, -pectate, etc.) to fruits and vegetables, such as pears, strawberries, kiwis, shredded carrot, honeydew melon discs, nectarines, peaches and melons, helps in retaining tissue firmness [8]. Calcium, in a 1% CaCl2 formulation, and ascorbic acid dips have been employed as firming agents that aid in extending the postharvest shelf life of sliced pears and strawberries that have been stored in a controlled atmosphere [9].
The objective of this study was to determine the effect of calcium chloride and ascorbic acid treatments on the quality parameters of shredded carrots.
2. Materials and Methods
2.1 Plant Material and Sample Preparation
Carrots were obtained from the Kocaeli Wholesale Distribution Center. They were transported immediately to the laboratory, thoroughly washed, peeled, trimmed of tap root and stem plate prior to preparation. A grate was used to prepare carrot shreds (about 5 mm wide, 40 long, and 2 mm thick).
Processed carrots (100 g for each replicate) were dipped into the following calcium and ascorbic acid solutions:
(1) 1% Ca + AA: 5 L solution of 1% CaCl2 containing 2 g/L ascorbic acid for 3 min.
(2) 3% Ca + AA: 5 L solution of 3% CaCl2 containing 2 g/L ascorbic acid for 3 min.
(3) 5% Ca + AA: 5 L solution of 5% CaCl2
containing 2 g/L ascorbic acid for 3 min.
(4) C: The control group samples were dipped in distilled water for 3 min.
All treatments were carried out at room temperature (~20 °C). Treated carrot shreds were dried by first using a salad spinner (2 min, room temperature) so as to remove excessive surface solution and then at room temperature (15 min).
2.2 Packaging and Storage Condition
The samples of shredded carrots (100 g) were placed in covered plastic boxes 110 × 110 × 50 mm in size. Triplicates of each treatment were stored for 11 days at 5 ± 1 °C with relative humidity of 85-90%.
2.3 Color Measurements
Color measurements (L*, a* and b* values) were performed using a chroma meter CR-400 (Konica Minolta Inc. Osaka, Japan) with an illuminant D65 with 8 mm aperture. The instrument was calibrated with a white reference tile (L* = 97.52, a* = -5.06, b* = 3.57) prior to measurements. The L* (0 = black, 100 = white), a* (+red, green) and b* (+yellow, –blue) color coordinates were determined as per the CIELAB coordinate color space system.
Whiteness index [WI, Eq. (1)], saturation index [SI, Eq. (2)] and hue angle [H, Eq. (3)] were calculated using L*, a* and b* values that were computed as described below; these values were used to compare the color changes of the test samples with that of the control (fresh-cut carrot shreds) [10].
WI 100 100 L a b (1)
√ (2)
arctan (3)
2.4 Visual Quality, Firmness and Bitterness
Assessments
extremely poor quality.
Firmness of the carrot shreds was scored as a subjective variable; the perceived hardness or softness experienced when carrot shreds were taken between two fingers and pressure was applied and was graded on a five-point Likert scale: 5, very firm; 4, firm; 3, partially firm/soft; 2, soft; 1, very soft (not usable).
Bitterness of the carrot shreds was also scored on a five-point Likert scale: 5, no bitterness; 4, slightly bitter; 3 bitter; 2, very bitter; 1, extremely bitter (not consumable).
The judging panel for sensory evaluation was composed of nine food-science students enrolled at the university. All the students had prior classroom training and experience in the sensory evaluation of food items.
2.5 Electrolyte Leakage Measurement
Electrolyte leakage (EL) was measured in the test carrot shreds. Distilled water was used for washing as well as immersion of test sample shreds and conductivity was measured 2 h after immersion. Total electrolyte conductivity of the carrot shreds was measured after they had been frozen and thawed. EL was calculated as percentage of the conductivity after 2 h [11].
2.6 Loss of Weight
The weight of the triplicate samples was recorded on the day of harvest and after the designated sampling dates. The loss in weight was calculated using the following formula:
weight loss (%) = (Wi – Ws/Wi) × 100; where Wi = initial weight; Ws = weight at sampling period.
2.7 Total Soluble Solids (TSS)
For each of the test replicates, TSS was determined for two parallel using an Atago DR-A1 digital refractometer (Atago Co. Ltd., Japan). The experiment was conducted at 20 °C and the results were expressed as percent value.
2.8 Statistical Analysis
Experiments were conducted in a completely randomized design with a minimum of three replications per treatment per sampling date. The resultant data were analyzed by application of the ANOVA test and differences between mean values were determined using Duncan’s multiple range test. The results were regarded as significant when P < 0.05 and P < 0.001.
3. Results and Discussions
3.1 L* values and Whiteness Index
L* values of treated carrot shreds were observed to have increased irrespective of the type of treatment applied. The highest value was observed on day 4 for shreds treated with 5% Ca + AA (59.757), which was followed by those treated with 3% Ca + AA (57.790), 1% Ca + AA (57.003) and C (control, 56.287). The difference between the treatments was statistically significant (P < 0.05). Post day 4, L* values of samples were observed to be changing whilst in storage: Initially a decrease was observed (day 8) subsequent to which L* values started increasing again (Fig. 1).
The Effects of Calcium Chloride and Ascorbic Acid Treatment on Ready-to-use Carrot Shreds
10
Fig. 1 L* and whiteness index (WI) values of carrot shreds. 1%: 1% CaCl2 and 2 ppm ascorbic acid (AA); 3%: 3% CaCl2
and 2 ppm AA; 5%: 5% CaCl2 and 2 ppm AA; C: Control.
treating carrot shreds with a combination of calcium chloride and ascorbic acid was effective in maintaining their brightness.
Previously Rico et al., (2007) have reported that in instances of a colorimeter being used to analyze color, increases in luminosity can be correlated with the development of whiteness in the test samples. In this study, however, the whiteness index (WI, Fig. 1) values of high calcium treated samples (3% and 5% Ca + AA) were lower than those of control and 1% Ca + AA treatments. Therefore, on account of the decrease in WI values of the samples, it can be concluded that treatment with a high dose of calcium prevented the whitening of samples. Similar results were reported for ascorbic acid treatments of carrots [6, 10]. Interestingly, in case of carrot shreds calcium treatments alone did not impact white tissue formation and WI values were observed to increase [2]. However, ascorbic acid alone was effective in inhibiting white color formation on surface of carrots [6]. Therefore, as a result of this study, it can be concluded that the combined use of calcium and ascorbic acid enhances the color quality and also prevents whitening of carrot shreds. Similar results were found [12] in case of nectarine halves.
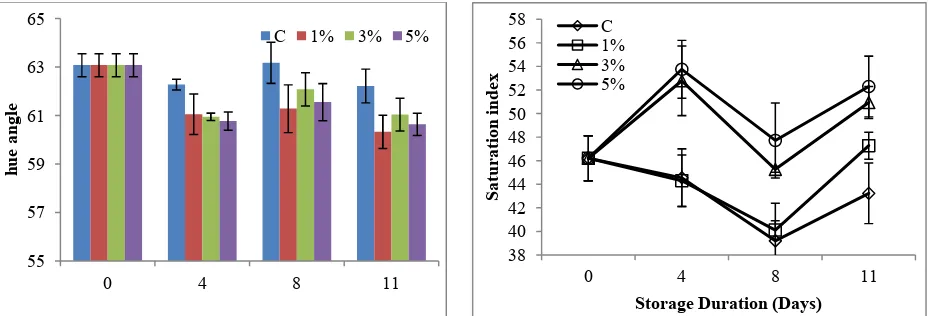
3.2 Hue Angle and Saturation Index Values
Fig. 2 shows the hue angle (h*) values measured at
day 1 and day 11 of storage. During storage, it was seen that treatment with a combination of ascorbic acid and calcium, irrespective of dose, resulted in a reduction in h* values. This conclusion was arrived at because significantly higher values were found in control samples compared to those that were treated with Ca + AA (P < 0.05). Saturation index (SI) values of samples subjected to 3% Ca + AA and 5% Ca + AA were higher than those treated with 1% Ca + AA and control (Fig. 2; P < 0.05). On day 4, the highest value of SI (53.756) was found in fruits treated with 3% Ca + AA. By contrast, the lowest value was observed in carrot shreds treated with 1% Ca + AA (44.303). However, from 4th day of storage till the conclusion of the study, carrot shreds in the control group had the lowest measures of SI values.
Fig. 2 Hue angle (h*) and saturation index (SI) values of carrot shreds. 1%: 1% CaCl2 and 2 ppm ascorbic acid (AA); 3%:
3% CaCl2 and 2 ppm AA; 5%: 5% CaCl2 and 2 ppm AA; C: Control.
control samples with respect to color or general appearance, treatment with 2% CaCl2 at 20 °C resulted in consistent maintenance of high quality with less intense browning and the best general appearance [13]. These results were also confirmed in the present study.
3.3 Visual Quality, Firmness and Bitterness Scores of Carrot Shreds
Visual quality scores of test samples, regardless of type of treatment, were observed to be decreased by day 4. Subsequently, scores increased until the 8th day of storage after which they continued decreasing till the end of the storage (Fig. 3). However, the appearance of samples treated with calcium and ascorbic acid was superior as compared to control during the first eight days of storage with the difference between treatments assuming statistical significance at day 4 (P < 0.05). Therefore it can be said that as compared to the control samples, the visual quality scores of test carrot shreds were highest during the first 4 days of the storage, but subsequent to that the effectiveness of the treatments decreased such that by the end of the storage period the visual quality scores of the Ca + AA treated samples were much below that of the control group.
According to the firmness scores, the texture of the shredded carrots was retained best in the control group followed by samples treated with 1% Ca + AA, 3% Ca
The Effects of Calcium Chloride and Ascorbic Acid Treatment on Ready-to-use Carrot Shreds
12
Fig. 3 Visual quality, firmness and bitterness scores of carrot shreds. 1%: 1% CaCl2 and 2 ppm ascorbic acid (AA); 3%: 3%
CaCl2 and 2 ppm AA; 5%: 5% CaCl2 and 2 ppm AA; C: Control.
for 1% Ca + AA and control. Hence, the high firmness values of samples in control and 1% Ca + AA treatments can be potentially explained as a byproduct of water loss.
Bitterness of carrot shreds increased upon increasing CaCl2 dose (Fig.3) with the highest (least bitter) values being obtained by 1% Ca + AA treatment (4.33) followed by 3% Ca + AA (2.0) and 5% Ca + AA as recorded on day 4, and these results continued during the storage. Differences amongst the treatments were statistically significant at the level of
P < 0.001 (4 and 8 days of storage) and P < 0.05 (11th day of storage). Studies [16] determined that exogenous administration of CaCl2 in form of a solution can reduce browning as well flesh softening in case of zucchini squash slices. However, CaCl2, when used in high concentrations (> 0.5%), has been known to cause a detectable off-flavor. The results of
present study corroborate the above mentioned results.
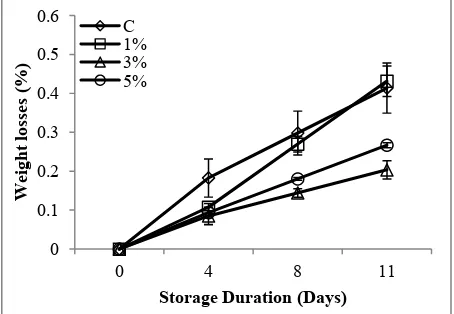
3.4 Weight Loss
Weight loss of all the treated samples was observed to increase during storage (Fig. 4). The highest weight
loss was observed in the control group (0.18 and 0.29) and followed by the 1% Ca + AA (0.10 and 0.26), 5% Ca + AA (0.09 and 0.18) and 3% Ca + AA (0.008 and 0.14) groups as noted on day 4 and 8. Also, statistically significant differences were observed between the various treatment groups while in storage. Therefore it can be concluded that CaCl2—ascorbic acid treatments have a significant effect on weight loss especially at higher doses.
Peel or skin is a very important barrier against desiccation and loss of turgor. Several fruits and vegetables have a protective waxy coating that makes them highly resistant to water loss. Mechanical injury to the skin brought about by peeling, cutting, slicing, shredding, etc. makes fresh cut products highly susceptible to weight loss as the protective peel is no longer intact [11, 15]. In the present study, water lost by carrot shreds was reduced when treated with a combination of calcium and ascorbic acid. Izumi and Watada [2] have previously reported that Ca has no observable effect on weight loss in case of carrot slices and sticks but is effective in preventing the same in case of carrot shreds. Their results also proved that carrot shreds have almost two and three times more Ca content as compared to sticks and slices respectively. Additionally, Ca has widely been reported to play an important role in preserving the structural integrity and mechanical strength of cell walls [9]. The basis for the reduced weight loss observed in case of carrots shreds treated with Ca + AA in the present study, can be accounted for by the Ca absorbed by the samples under test.
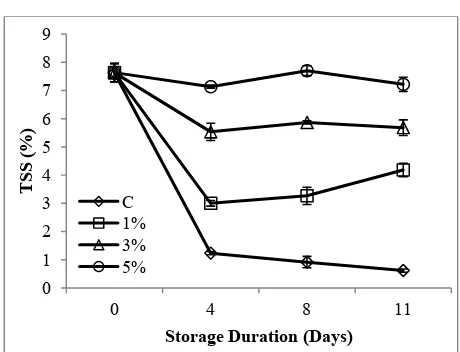
3.5 Total Soluble Solids
Fig. 5 shows total soluble solid (TSS) values for carrot shreds subjected to different treatments. TSS of carrot shreds was observed to be decreased on day 4 but this decrease was higher in the control group as compared to the calcium and ascorbic acid treated samples. In quantitative terms, TSS of the control group was 1.2%; for the Ca treated carrot shreds it
Fig. 5 Total soluble solids (TSS) of carrot shreds. 1%: 1% CaCl2 and 2 ppm ascorbic acid (AA); 3%: 3% CaCl2 and 2
ppm AA; 5%: 5% CaCl2 and 2 ppm AA; C: Control.
ranged from 3% to 7%. Subsequent to day 4, TSS of the control group was observed to steadily decrease till the end of the storage period whereas in case of the Ca treated carrots it was observed to increase. It was also seen that TSS of samples treated with a combination of Ca and AA was higher than that of control and that the higher values were observed in correlation with high doses of CaCl2 treatment during storage. Differences in TSS values amongst the various treatments were statistically significant (P < 0.001).
The edible portion of carrot contains about 10% carbohydrate with the soluble carbohydrate composition ranging from 6.6 to 7.7 g per 100 g [14]. In the present study, the initial TSS content of carrot shreds was observed to be 8%. This value was seen to decrease across treatments under storage conditions. Interestingly, the maximum decrease in TSS values was observed in case of the control group where values fell from 1% on day 4 to below 1% on days 8 and 11. In contrast, TSS of calcium treated carrot shreds maintained constant high values especially in the case of shreds treated with 5% calcium where values ranged from 7.1% to 7.7%. TSS of samples in 1% Ca + AA and 3% Ca + AA treatment groups was also found to be high as compared to the control. Therefore it can be concluded that calcium and ascorbic acid
The Effects of Calcium Chloride and Ascorbic Acid Treatment on Ready-to-use Carrot Shreds
14
Fig. 6 Electrolyte leakage of carrot shreds. 1%: 1% CaCl2
and 2 ppm ascorbic acid (AA); 3%: 3% CaCl2 and 2 ppm
AA; 5%: 5% CaCl2 and 2 ppm AA; C: Control.
treatments prevent loss of TSS in case of carrot shreds especially when used in high doses.
3.6 Electrolyte Leakage
On day 4, it was observed that electrolyte leakage (EL) from carrot shreds in the control group and 1% Ca + AA treated group decreased, whereas in the 3% Ca + AA and 5% Ca + AA treated samples it was increased (Fig. 6). The EL values of the control samples continued to decline but an increase was noted in the 1% Ca + AA and 3% Ca + AA treated groups. Moreover, it showed variations between decrease and increase in 3% Ca + AA treatments during the storage. Differences in EL values among the treatments were statistically significant (P < 0.001). Leakage of electrolytes or cellular content is commonly used as an index for evaluating changes in membrane integrity arising due to ripening, stress damage or mechanical injury [7]. Electrolyte leakage is considered as an indirect measure of plant cell membrane damage [17]. In the present study, EL values for calcium and ascorbic acid treated samples were observed to be higher than that of the control group. Therefore, it can be concluded that CaCl2 treatments have no membrane stabilizing effect conferred by exogenous calcium ions.
4. Conclusions
This study aimed to determine the impact of
calcium and ascorbic acid on the quality of carrot shreds during storage. For this purpose, carrots were grated and treated with solutions containing varying doses of calcium along with 2 g/L ascorbic acid. The carrots were then stored for 11 days in a cold room at 5 ± 1 °C and 85-90% RH. According to the results obtained from this study, calcium was found to improve color quality and brightness while decreasing the development of whiteness on carrot shreds. As a cautionary note, however, it was observed that calcium, especially at higher doses, could cause bitterness of carrot shreds. Weight losses of carrot shreds treated with calcium and ascorbic acid was found to be higher than that of the control group; also firmness values of these test samples were low compared with the control. While calcium treatment was observed to improve the visual quality of the produce during the first eight days of storage, it was found to lose its efficacy after that. In addition, the calcium treatments showed no membrane stabilizing effect.
References
[1] Krasaekoopt, W., and Bhandari, B. 2011. “Fresh Cut Vegetables.” In: Handbook of Vegetables & Vegetable Processing (Ed: Nirmal K. Sinha), Blackwell Publishing Ltd. pp: 226.
[2] Izumi, H., and Watada, A. E. 1994. “Calcium Treatments Affect Storage Quality of Shredded Carrots.” Journal of Food Science 59 (1): 106-9.
[3] Sargent, S. A., Brecht, J. K., Zoelner, J. J., Baldwin, E. A., and Campbell, C. A. 1994. “Edible Films Reduce Surface Drying of Peeled Carrots.” Proc. Fla. State Hort. Soc.
107: 245-7.
[4] Bolin, H. R., and Huxsoll, C. C. 1991. “Control of Minimally Processed Carrot (Daucus carota L.) Surface Discoloration Caused by Abrasion Peeling.” J. Food Sci.
56: 416-8.
[5] Kato-Nofuchi, H., and Watada, A. E. 1997. “Citric Acid Reduces the Respiration of Fresh-cut Carrots.” Hort. Science 32: 136.
[6] Kasim, R., and Kasim, M. U. 2014. “Ascorbic Acid Treatments for Preventing Lignification on Ready-to-use Carrot.” Balkan Agriculture Congress 8-11 September 2014, Edirne, Turkey. Turkish Journal of Agricultural and Natural Science 2: 1518-23.
[7] Ngamchuachit, P., Sivertsen, H. K., Mitcham, E. J., and Barrett, D. M. 2014. “Effectiveness of Calcium Chloride and Calcium Lactate on Maintenance of Textural and Sensory Qualities of Fresh-cut Mangoes.” Journal of Food Science 00 (0): 1-9.
[8] Siddiqui, M. D. W., Chakraborty, I., Ayala-Zavala, J. F., and Dhua, R. S. 2011. “Advances in Minimal Processing of Fruits and Vegetables: a Review.” Journal of Scientific & Industrial Research 70: 823-34.
[9] Alzamora, S. M., and Salvatori, D. M. 2006. Minimal Processing: Fundamentals and Applications Handbook of Food Science, Technology, and Engineering (Ed. YH. Hui), Vol: 3, CRC Press, 712p.
[10] Kasim, R., Kasim, M. U., and Uyar, G. E. O. 2015. “Postharvest Ascorbic Acid Treatments on Color and Sugar Change on Fresh-cut Carrots.” International Journal of Research in Agriculture and Food Sciences 2 (10): 1-8.
[11] Ayala-Zavala, J. F., Del-Toro-Sanchez, L., Alvarez-Parrilla, E., and Gozalez-Aguilar, G. A. 2008. “High Relative Humidity in-package of Fresh-cut Fruits and Vegetables: Advantage or Disadvantage Considering Microbiological Problems and Antimicrobial Delivering Systems.” J. Food Sci. 73: 41-7.
[12] Miguel-Pintado, C., Nogales, S., Fernández-León, A. M., Delgado-Adámez, J., Hernández, T., Lozano, M.,
Cañada-Cañada, F., and Ramírez, R. 2013. “Effect of Hydrostatic High Pressure Processing on Nectarine Halves Pretreated with Ascorbic Acid and Calcium during Refrigerated Storage.” LWT-Food Science and Technology 54: 278-84.
[13] Salata, A. C., Cardoso, A., Evangelista, R. M. and Magro, F. 2014. “Use of Ascorbic Acid and Calcium Chloride on Quality of Minimally Processed Cabbage.” Hortic. Bras.
32 (4), Vitoria da Conquista Oct./Dec. 2014. Epub Dec 2014.
[14] Sharma, K. D., Karki, S., Thakur, N. S., and Attri, S. 2012. “Chemical Composition, Functional Properties and Processing of Carrot-a Review.” J. Food Sci. Technol.
(January-February 2012) 49 (1): 22-32.
[15] Garcia, E., and Barret, D. M. 2002. “Preservative Treatments for Fresh-cut Fruits and Vegetables.” In:
Fresh-Cut Fruits and Vegetable: Science, Technology and Market (Ed: Lamiranka, O.), CRC Press Inc., Boca Raton. FL, USA, pp: 267-303.
[16] Izumi, H., and Watada, A. E. 1995. “Calcium Treatment to Maintain Quality of Zucchini Squash Slices.” J. Food Sci. 60: 789-93.
[17] Fan, X., and Sokorai, K. J. B. 2005. “Assessment of Radiation Sensitivity of Fresh-cut Vegetables using Electrolyte Leakage Measurement.” Post. Biol. Technol.
Journal of Life Sciences 10 (2016) 16-20 doi: 10.17265/1934-7391/2016.01.003
The Cytochrome b Polymorphism of Meat Lines Rabbits
Vladimir Parkanyi, Lubomir Ondruska and Dusan Vasicek
Research Institute for Animal Production, National Agricultural and Food Centre, Hlohovecka 2, Luzianky 951 41, Slovak Republic
Abstract: The cytochrome b mtDNA was analysed from peripheral whole blood samples of meat lines rabbits. The PCR product—692 bp long fragment of Oryctolagus cuniculus_cytochrome b (OCU07566 GenBank, NCBI, USA) was amplified. Synthetically produced oligonucleotides for the detection of cyt b were designed by own algorithm: ORYCTO-cyt b-FOR 5'- CTA TCA GCA ATC CCA TAT ATC -3' and ORYCTO-cyt b-REV 5'- CTT CAT TTG AGG ATT TTG TT -3'. Based on AluI-RFLP were described two cytochrome b haplotypes—cyt b 430 and cyt b 306. Haplotype cyt b 430 is 571A (190Threonine-T) + 877G (292Alanine-A). The new haplotype cyt b 306 is presented A571G nucleotide substitution, i.e, 571G (190Alanine-A) + 877G (292Alanine-A).
Key words: Rabbit, cytochrome b, SNP, new haplotype, A571G.
1. Introduction
MtDNA genome encodes 13 oxidative phosphorylation enzymes, two rRNA, tRNA, 22 necessary for protein synthesis and a control region (D-loop), in which begin and end of all the replication of mitochondrial DNA sequences. Mitochondrial DNA is traditionally used in population genetics as a marker of choice to characterize the phylogeny [1]. Many researchers have drawn attention to the functional role of mtDNA, and drew attention to the direct use of mitochondrial data for the needs of ecology and evolution [2-4]. Reparation mechanisms at the level of mtDNA quickly remove most of harmful mutations. However non-correction mechanism of mtDNA sequences affects the quality of production mitochondrial enzymes and therefore their effective share in the overall energy metabolism of the cell. These changes affect the male generative cells to a much greater extent in comparison with influencing somatic cells or female generative cells. Sperm have high power requirements relative to the motility, the amount of the mitochondria is only a fraction compared to the other cells [5-8].It follows that any mutation in the mtDNA and following the relative loss of
Corresponding author: Vladimir Parkanyi, RNDr., Ph.D., research fields: genetics, breeding and reproduction of farm animals.
efficiency is least in the complex OXPHOS can significantly reduce sperm function. This is also negatively affected male fertility. However, the occurrence of mtDNA mutations has no significant effect on the vitality of the eggs due to their lower energy requirements. Female fertility is therefore not adversely affected, since maternal inheritance of mtDNA, the mutant haplotype occurring in the population of the female line. This effect was called the “mother’s curse effect” [8]. The mitochondria occupy a central role in the metabolism of the eukaryotic cell [3], in Genetic disease [9], in Genetic Programming death (apoptosis) [10], RFLP identification of species [11] and aging [12]. Authors [11] used five animal species (Mustela vison, Mustela putorius furo, Sus scrofa domesticus, Oryctolagus cuninculus, Anser anser) for the mitochondrial cytochrome b gene analysis. Length of PCR product was 359 bp and authors used universal primers. Restriction fragment length polymorphism was analyzed by using the restriction endonuclease AluI. Results of cleavage were visualized by using electrophoresis and UV transilluminator. Every animal specie has a unique combination of restriction fragments i.e. Mustela vison 81 bp, 109 bp and 169 bp, Mustela putorius furo
169 bp and 190 bp, Sus scrofa domesticus 115 bp and 244 bp, Oryctolagus cunninculus is not cleaved by
D
AluI so it has whole 359 bp fragment on agarose gel, Anser anser 130 bp and 229 bp. The results suggest that the method of PCR—RFLP is rapid and simple method for identification of species. PCR—RFLP can reliably identify chosen species.
2. Material and Methods
2.1 Animals
The experimental animals (rabbits) were bred in an approved test facility of Research Institute for Animal Production (RIAP), National Agricultural a Food Centre Nitra, Slovakia. Cytochrome b mtDNA was analysed from samples of peripheral whole blood (collected from a. auricularis centralis to heparinised tubes; Heparin, 25,000 IU, 4 μL/1 mL) from 18 males and 24 females breeding parental generation and their F1 generation of the original meat lines (M91 and P91) rabbits bred in RIAP Nitra.
Females of the parental generation were divided into two groups: 1.—experimental group (12 animals) was subjected to strict divergent selection and selection criteria should be more stringent (selected female had to have at least three litters with 7-10 live kits). 2.—control group (12 animals) had at least three litters a large variation range of live-born kits at birth 1-15 kits. The animals were housed in individual cages, under a constant photoperiod of 14 h of light day. Temperature and humidity in the building were recorded continuously by means of a thermograph positioned at the same level as the cages (average relative humidity and temperature during the year was maintained at 60 ± 5% and 17 ± 3 °C). The rabbits were fed ad libitum with a commercial diet (KV; TEKRO Nitra, Ltd.) and water was provided ad libitum with nipple drinkers. The treatment of the animals was approved by the Ministry of Agriculture and Rural Development of the Slovak Republic, no. SK P 28004 and Ro 2058/06-221/1c.
2.2 Cytochrome b mtDNA Analysis
For isolation of mtDNA from heparinized peripheral
blood, it used the Maxwell DNA Purification Kit. The concentration of DNA in the samples was measured on a UV/VIS spectrophotometer Nano Photometer (Implen). The polymerase chain reaction (PCR) technology has been used for specific segments amplification of isolated small mitochondrial (mtDNA) male and female rabbits. As a reference was the elution solution used to elute the DNA for purification. PCR conditions (PTC-200 DNA Engine, BioRad) were 95 for 2 min, 94 °C for 30 sec, 54 °C for 30 sec, 72 °C for 30 sec, 35 cycles, the last step of extension at 72 °C 10 min. The PCR reaction volume (25 μL) containing 10 mM Tris-HCl (pH 8.6 at 25 °C, 50 mM KCl, 1.5 mM MgCl2, Taq DNA polymerase, dNTPs 0.2 mM each, 5% glycerol, 0.08% Igepal CA-630, 0.05% Tween-20) (New England Biolabs), 10 pmol/μL each primer (ORYCTO-cyt b-21nt-FOR and ORYCTO-cyt b-20nt-REV), and the mtDNA samples. The amplified mtDNA was electrophoretically separated on a 2% agarose gel containing ethidium bromide at 80 mA, 120 V in 10 mM lithium borate buffer, pH 8.0 during 90 min.
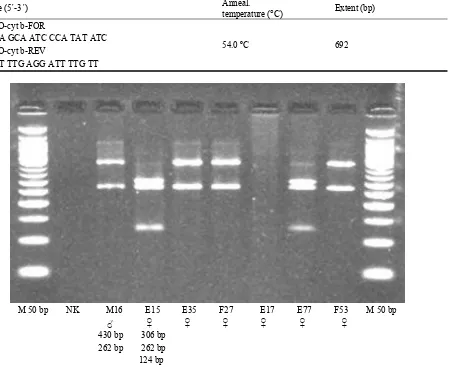
3. Results and Discussion
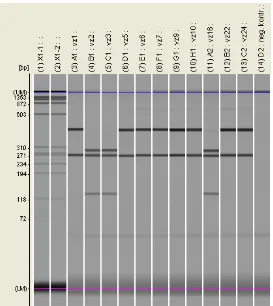
PCR products were visualized under UV light and photographed using a documentation system MiniBis Pro (Bio-Imaging Systems) (Fig. 1). It was detected 692 bp long fragment of Oryctolagus cuniculus_cytochrome b (OCU07566 GenBank, NCBI,
USA) rabbit mitochondrial DNA. To find a definition of the analyzed section of mtDNA was applied in the laboratory designed synthetically produced oligonucleotides (Table 1).
The Cytochrome b Polymorphism of Meat Lines Rabbits
18
Table 1 Oligonucleotides for detection of partial cytochrome b Oryctolagus cuniculus (OCU07566 GenBank, NCBI, USA).
Sequence (5´-3´) Anneal.
temperature (°C) Extent (bp) ORYCTO-cyt b-FOR
54.0 ºC 692
CTA TCA GCA ATC CCA TAT ATC ORYCTO-cyt b-REV
CTT CAT TTG AGG ATT TTG TT
Fig. 1 Alu I cleavage of cytochrome b 692 bp PCR product visualised on 2% Agarose gel by MiniBis Pro (Bio-Imaging Systems). Haplotype cyt b 430 = samples M16, E35, F27, F53; haplotype cyt b 306 = samples E15 and E77; NK = negative control, M = 50 bp DNA Ladder (Jena Bioscience).
were divided into two haplotype groups cyt b 430 and cyt b 306. Haplotype cyt b 430 is 571A (Threonine-T) + 877G (Alanine-A). Haplotype cyt b 306 is presented A571G nucleotide substitution, i.e., 571G (Alanine A) + 877G (Alanine-A).
This nucleotide change is a causal consequence of
the conversion and translational changes in the peptide chain, where an essential amino acid Threonine-T is replaced with Alanine amino acid -A190. Haplotype cyt b 430 is defined by one restriction site (877G) (Fig. 3). While cyt b 306 is a new haplotype defined by two
restriction sites 571G and 877G (Fig. 4).
4. Conclusions
The new haplotype cyt b 306 A571G polymorphism of meat lines rabbits mtDNA (cell line LEU-RAB) is registered and described as BioSample: SAMN03701526; Sample name: cyt b O.C. (Model organism or animal sample from Oryctolagus
cuniculus), in NCBI, USA:
http://www.ncbi.nlm.nih.gov/biosample/3701526 and http://www.ncbi.nlm.nih.gov/bioproject/284428.
Application of these genetic and molecular methods is very useful for breeding of livestock and protection of biodiversity.
M 50 bp NK M16 E15 E35 F27 E17 E77 F53 M 50 bp
♂ ♀ ♀ ♀ ♀ ♀ ♀ 430 bp 306 bp
Fig. 2 The rabbit cytochrome b: PCR-RFLP (AluI) results. The Microchip electrophoresis MCE®-202 MultiNA. 1-2: X1-1 and X1-2 = phiX174 DNA/Hae III Markers (Promega), 3-13: samples, 14: negative control.
571
541 t t t c a c t t c a t c t t g c c a t t t a t c a t t g c a a c t t t a g t c t t a a t t F H F I L P F I I A T L V L I
190
586 c a c c t c c t c t t t c t a c a t g a a a c t g g c t c c a a c a a c c c c a c a g g a H L L F L H E T G S N N P T G 631 a t t c c t t c a a a c t c a g a t a a a a t c c c t t t c c a c c c c t a c t a c a c a I P S N S D K I P F H P Y Y T 676 a t c a a a g a c a c c c t a g g t t t c c t t g t a g c c a t t c t t c t c c t c c t t I K D T L G F L V A I L L L L 721 a t t t t a g t c c t a t t t t c a c c a g a c c t a t t a g g a g a c c c a g a c a a c I L V L F S P D L L G D P D N 766 t a c a c c c c t g c c a a c c c c c t t a a t a c c c c t c c c c a t a t c a a a c c a Y T P A N P L N T P P H I K P 811 g a a t g a t a c t t t c t a t t t g c c t a c g c t a t c c t a c g c t c t a t t c c a
E W Y F L F A Y A I L R S I P 877
856 a a t a a a c t c g g a g g a g t c c t a g c t c t a g t c c t a t c c a t c c t t g t t N K L G G V L A L V L S I L V
292
The Cytochrome b Polymorphism of Meat Lines Rabbits
20
571
541 t t t c a c t t c a t c t t g c c a t t t a t c a t t g c agc t t t a g t c t t a a t t F H F I L P F I I A A L V L I
190
586 c a c c t c c t c t t t c t a c a t g a a a c t g g c t c c a a c a a c c c c a c a g g a H L L F L H E T G S N N P T G 631 a t t c c t t c a a a c t c a g a t a a a a t c c c t t t c c a c c c c t a c t a c a c a I P S N S D K I P F H P Y Y T 676 a t c a a a g a c a c c c t a g g t t t c c t t g t a g c c a t t c t t c t c c t c c t t
I K D T L G F L V A I L L L L 721 a t t t t a g t c c t a t t t t c a c c a g a c c t a t t a g g a g a c c c a g a c a a c
I L V L F S P D L L G D P D N 766 t a c a c c c c t g c c a a c c c c c t t a a t a c c c c t c c c c a t a t c a a a c c a
Y T P A N P L N T P P H I K P 811 g a a t g a t a c t t t c t a t t t g c c t a c g c t a t c c t a c g c t c t a t t c c a
E W Y F L F A Y A I L R S I P 877
856 a a t a a a c t c g g a g g a g t c c t a g c t c t a g t c c t a t c c a t c c t t g t t N K L G G V L A L V L S I L V
292
Fig. 4 Haplotype cyt b 306: AluI Cytochrome b (GenBank OCU07566) = 306-262-124 bp, 571G (190Alanine-A) + 877G (292Alanine-A).
Acknowledgments
This work was supported by the Slovak Research and Development Agency under the contract No. APVV-0044-12.
References
[1] Avise, J. C., Arnold, J., and Ball, R. M. 1987.
“Intraspecific Phylogeography—the Mitochondrial—DNA Bridge between
Population—Genetics and Systematics.” Annual Review of Ecology and Systematics 18: 489-522.
[2] Ballard, J. W. O., and Whitlock, M. C. 2004. “The Incomplete Natural History of Mitochondria.” Molecular Ecology 13: 729-44.
[3] Brand, M. D. 1997. “Regulation Analysis of Energy Metabolism.” J. Exp. Biol. 200: 193-202.
[4] Corpet, F. 1988. “Multiple Sequence Alignment with Hierarchical Clustering.” Nucl. Acids Res. 16: 10881-90. [5] Cummins, J. 1998. “Mitochondrial DNA in Mammalian
Reproduction.” Review of Reproduction 3: 172-82. [6] Diez-sanchez, C., Ruiz-pesini, E., and Lapen, A. C. 2003.
“Mitochondrial DNA Content of Human Spermatozoa.”
Biology of Reproduction 68: 180-5.
[7] Dowling, D. K., Friberg, U., and Lindell, J. 2008. “Evolutionary Implications of Non-neutral Mitochondrial Genetic Variation.” Trends in Ecology & Evolution 23: 546.
[8] Gemmell, N. J., Metcalf, V. J., and Allendorf, F. W. 2004. “Mother’s Curse: the Effect of mtDNA on Individual Fitness and Population Viability.” Trends in Ecology & Evolution 19: 238.
[9] Graeber, M. B., and Muller, U. 1998. “Recent Developments in the Molecular Genetics of Mitochondrial Disorders.” J. Neurol. Sci. 153: 251-63. [10] Kroemer, G., Dallaporta, B., and Resche, R. 1998. “The
Mitochondrial Death/Life Regulator in Apoptosis and Necrosis.” Annu. Rev. Physiol. 60: 619-42.
[11] Minarovic, G., Trakovicka, A., Rafayova, A., and Lieskovska, Z. 2010. “Animal Species Identification by PCR—RFLP of Cytochrome b.” Scientific Papers: Animal Science and Biotechnologies 43: 296-9.
Journal of Life Sciences 10 (2016) 21-32 doi: 10.17265/1934-7391/2016.01.004
Using Magnetic Technique to Increase Efficiency of
Organic Pollutants Biodegradation in Wastewater
Khalid Falih Hassan, Suadad Awad Kadhim, Noor Nihad Baqer and Elaaf Safa Al-deen Hassan
Ministry of Science and Technology, Directorate of Water and Environment, Baghdad 10001, Iraq
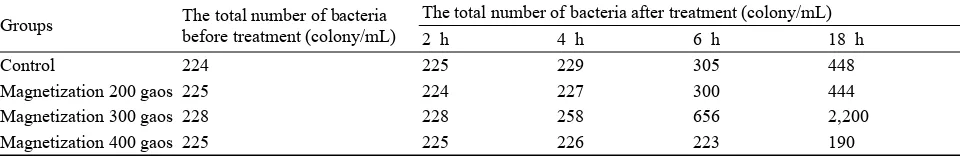
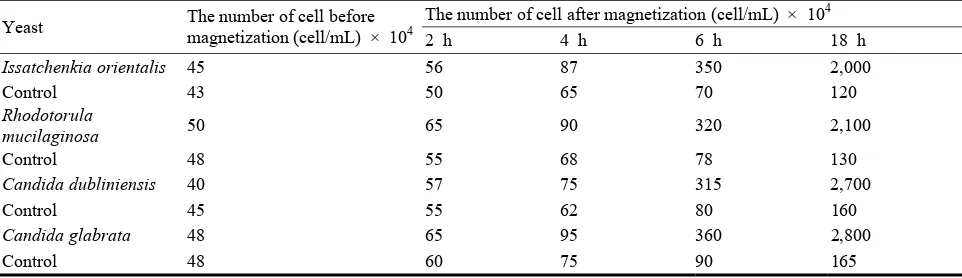
Abstract: The intensity of Magnetic field by 200, 300 and 400 gaos were selective to study their impacts on bacteria Bacillus, Pseudomonas and yeasts Candida dubliniensis, Candida glabrata, Issatchenkia orientalis and Rhodotorula mucilaginosa growth and to reduce organic pollutants in wastewater by COD, TOC, TN and TP in concentrations of 180, 75, 52 and 84 ppm in pH 7.6 and treatment periods of 2, 4, 6 and 18 h in batch system. Results showed that magnetic field 300 gaos had higher ability to increase bacterial and yeasts growth by 400-600% in 18 h and reduced COD, TOC, TN and TP by 88, 85, 90 and 98.5% in same period treatment. While, the intensity of magnetic field 200 and 400 gaos have no effect on microorganisms growth and reducing organic pollutants. This study is first record for showing and explaining the positive effective of magnetic field on microorganisms growth.
Key words: Magnetic, yeast, bacteria, increase growth, biodegradation, wastewater.
1. Introduction
The waste water represents of the major sources of pollution to water bodies after being discharged into rivers without proper or partial treatment as it contains toxic organic substances that lead to a decline in natural water; and disruption the balance of the environment which causes the occurrence of water pollution. Wastewater treatment processes rely on assimilation of microorganisms and enzymatic effectiveness in breakage chains carbon of soluble organic pollutants; as sewage water contains many of the aliphatic, aromatic, phenolic compounds and toluene, which are toxic and carcinogenic compounds [1]. The bacteria are considered as the efficient microorganisms in biological treatments for waste water. It has the ability to secrete a wide range of analysis enzymes that break down organic substance and hydrocarbon and converting them into simple compounds; and adsorption a lot of heavy elements on the cell wall, in addition to its deployment in all aquatic body and rapid growth. Bacillus, Pseudomonas and some Micrococcus strains have
Corresponding author: Khalid Falih Hassan, B.Sc. Biology, research field: treatment technology of environment and water.
highly efficiency for breakage of organic material soluble by enzymatic analysis [2].
Proved [3] in their study the ability of bacteria
Chromatium and Bacillus consume sulfate significantly, in addition to nitrates and nitrites from polluted water and reduce their concentrations significantly. It has proven in considerable studies that bacteria have the ability to consume organic substances, hydrocarbon, phosphorus compounds and nitrogen because its system of enzymatic active that adopted on the basis of transferring energy which represented of Carbon from bacteria species to another [4].
Bacteria are divided into several classifications according to their ability of assimilation and breaking down such as Hydrolytic Bacteria, that secrete a group of enzymes working in the fragmentation of polysaccharides, fats and proteins convert into organic acids, amino acids and other simpler compounds. While, Fermentative Bacteria that work to convert these compounds into alcohol and fatty acid, then Acetogenic Bacteria convert it into Acetate and hydrogen. Whilst, Degradable Bacteria are working to break down these compounds and convert it into carbon dioxide and water [5].